|
Elliott Wave Charts and
Market Timing Analysis of the U.S. Stock Market
2007 Updates
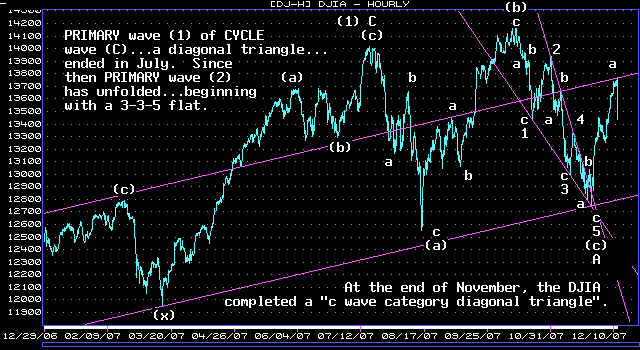
| December 11, 2007 update...In my previous update, I indicated that a rally beyond 13407 would suggest that the DJIA had completed a 5 wave "c wave category diagonal triangle". Five trading days later, on November 30th, that happened...and left the DJIA with a completed 3-3-5 flat pattern from July through November. Other market indices have slightly different counts, but the likely outcome for all in the coming weeks is the same...a "b wave" test of the the October highs. If my analysis is correct, the DJIA today completed wave "a" of this "b wave" pattern at 13780. Wave "b" of the pattern should unfold over the next week or two...to be followed by a final "c" wave rally that will test or break the October highs. |
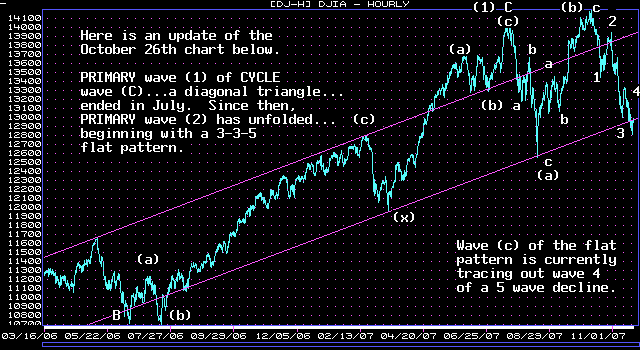
| November 23, 2007 update...So far, the market is following our forecast of a month ago perfectly. Our current analysis suggests that the DJIA is tracing out the 4th wave of a 5 wave decline that began at the October 11th high. This week's high of 13211 must be exceeded (or this week's low of 12786 must not be broken) next week for the 4th wave to be discernible on the weekly chart. A 5th wave decline will follow. Keep in mind than a rally above 13407 would suggest that the DJIA completed a 5 wave "c wave category diagonal triangle" (click here for an explanation of this pattern) on Wednesday...indicating that a low of some importance is already in place. For this to occur, however, recently broken support levels for some indices would have to be exceeded...which I think is unlikely in the short run. |
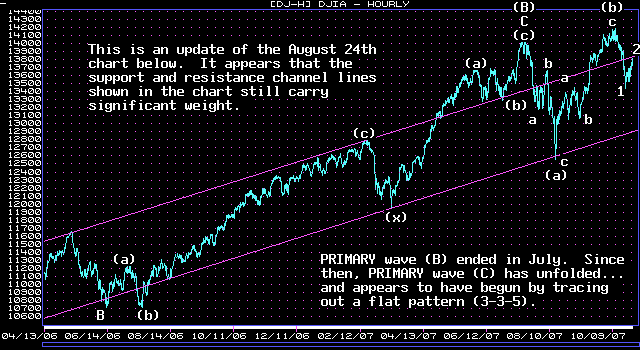
| October 26, 2007 update...The chart above updates a chart that was previously shown on August 24th. As suggested in the previous update, it now appears that PRIMARY wave (C) is tracing out a flat pattern...which further suggests that CYCLE wave [B] is tracing out a triangle. Take a look at the DJIA's pattern from October 1989 to October 1990 for an idea of what might transpire over the next year or two. If my anaylsis is correct, the DJIA is currently tracing out a five wave decline (wave (c)) that will test the August lows between now and the end of December. Wave 3 of that decline is next...and it should be powerful! (By the way...the 63 week cycle high predicted below was one week late.) |
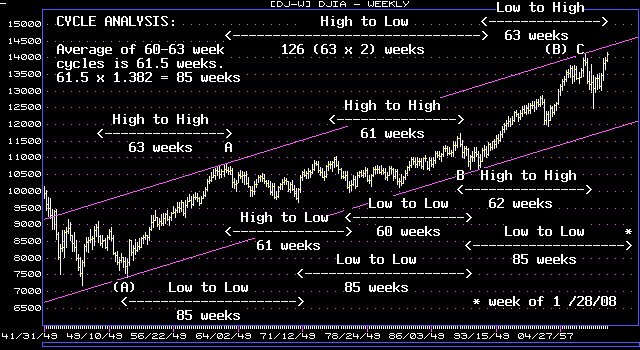
| October 2, 2007 update...The chart above updates my previous chart of cycle analysis found below. It suggests that an important high is likely this week. Given the DJIA's new high yesterday we now know that either: (1) PRIMARY wave (C) is a flat...suggesting that CYCLE wave [B] is tracing out a triangle, or (2) PRIMARY wave (B) is ending with a diagonal triangle pattern...similar to the triangle pattern that preceeded the March 12, 2003 low. In any case, be prepared for continued volatilily in the coming months. |

| September 18, 2007 update...As we suggested in the last update, the DJIA held above 13035 (low close was 13113) and a rally followed the three day decline. If my analysis is correct, the corrective action since the August 16th low is ending...and a major decline below that level is about to begin. |
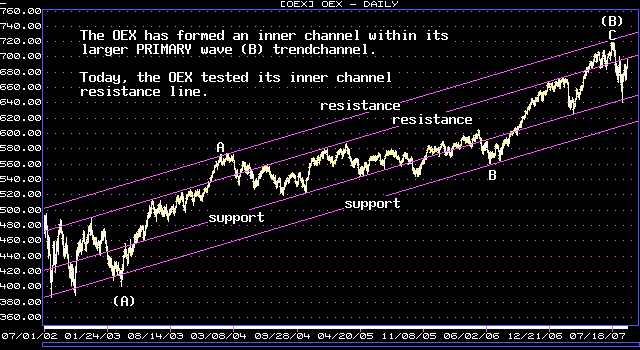
| September 4, 2007 update...The DJIA closed at 13448 today. Does that number sound familiar? In the last update we referenced that number as an important Fibonacci retracement level. With various market indexes completing a-b-c patterns at important resistance (see OEX chart), the market should now turn down. The only uncertainty is how low the market will go during this selloff. The larger pattern allows for the formation of a diagonal triangle pattern (if the market holds above 13035), i.e., one more rally would follow the decline. So, keep that in mind as the next declining wave pattern develops in the coming days. |
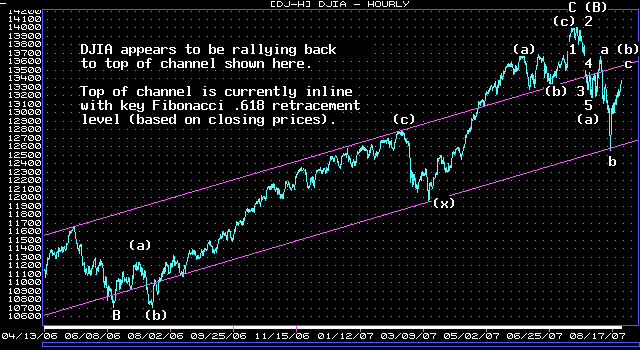
| August 24, 2007 update...The market's current countertrend rally should end next week. Key Fibonacci .618 retracement levels to watch are 13448 (based on intraday prices) and 13559 (based on closing prices). The second Fibonacci target (13559) appears to be more inline with trendline resistance as shown in the chart above. |
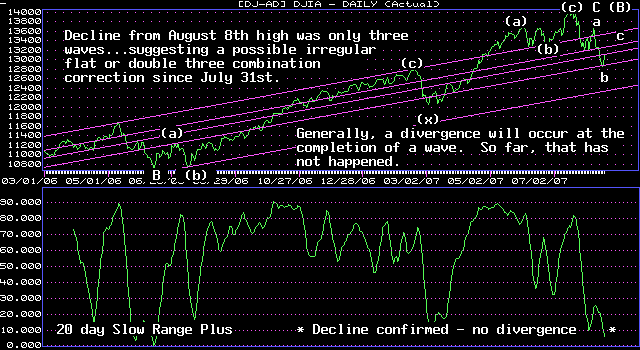
| August 18, 2007 update...Before the Fed acted yesterday, the market seemed poised to begin the 5th wave decline that I mentioned on Thursday. The Asian markets closed sharply lower and the index futures indicated the market would gap to the downside. Then, the Fed dropped the discount rate...the futures soared...and the DJIA opened 300 points higher. Thus, we saw a perfect illustration of the impact of a fundamental event on the formation of an Elliott wave pattern. What seemed destined to happen was altered! BUT...it was only the SHORT TERM Elliott wave pattern that changed. Although a LONG TERM Elliott Wave pattern (when correctly counted and interpreted) does indeed provide us with a guide that tells us the market will go from A to B, it doesn't tell us EXACTLY how we will get there. That's why technical analysis remains a vital aid to those of us who use Elliott wave analysis to time and forecast the market. |
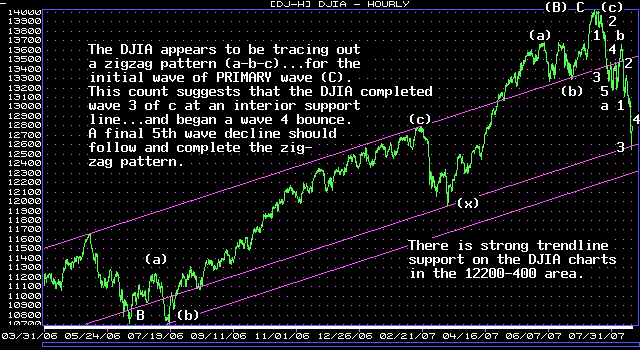
| August 16, 2007 update...The DJIA rallied over 300 points this afternoon to close just below the initial support line that I pointed out Tuesday on the chart below. Ideally, the DJIA completed a 3rd wave at 1:00 pm today...and began a 4th wave bounce. Once completed, a 5th wave decline should unfold into next week...at which point a multi week countertrend rally should commence. |
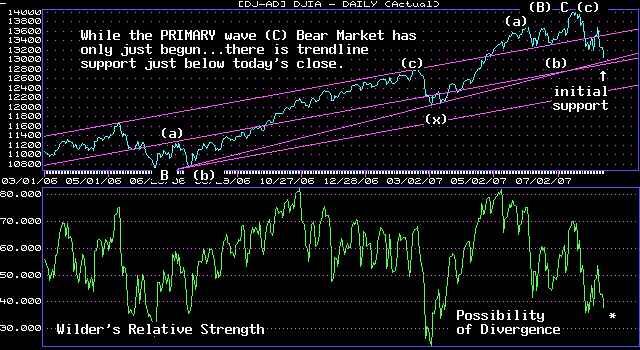
| August 14, 2007 update...The DJIA declined toward the 13000 level today...and is now sitting just above initial trendline support (on a closing basis). While the PRIMARY wave (C) Bear Market is only in its early stages...and will continue for months to come...I think that areas of possible consolidation are worth pointing out to traders. Longer term investors should wait for more important (and much lower) support levels to take positions. |
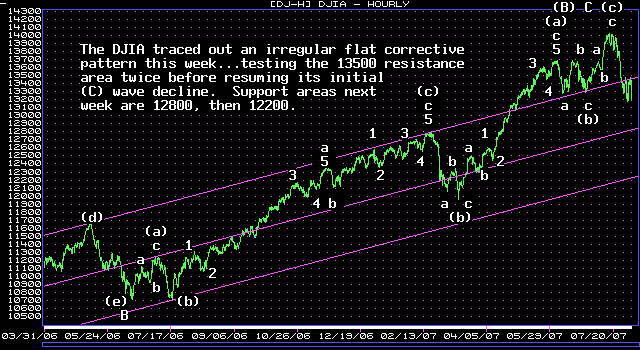
| August 9, 2007 update...The DJIA managed to close one day above its 13500 resistance area...and then snapped back dramatically below it today. The market's 2nd wave or "b" wave corrective pattern looks complete to me. If so, a 3rd wave or "c" wave decline toward 12200-12800 should now be underway. | 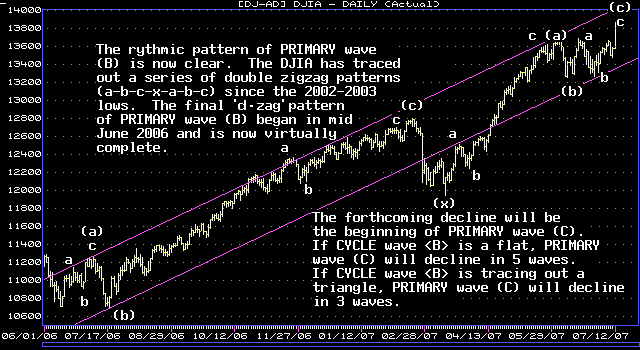
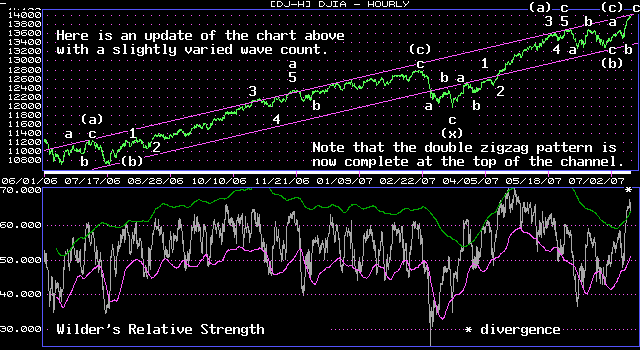
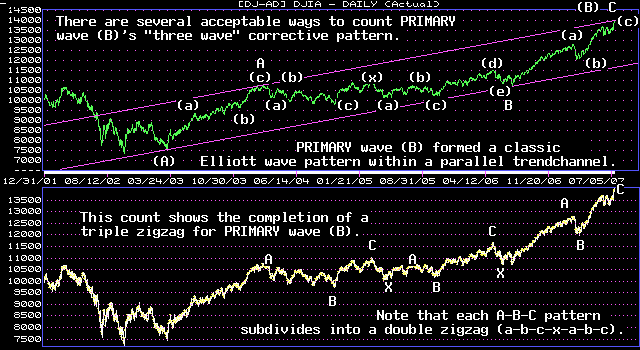
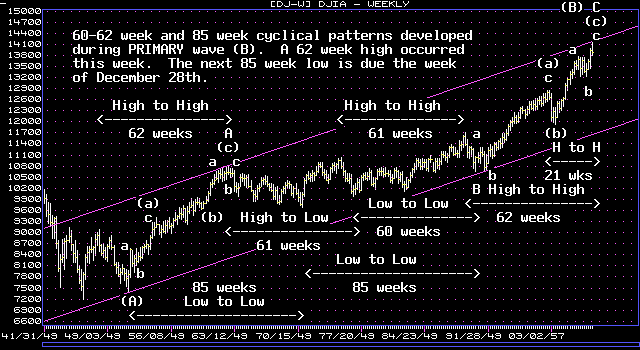
| July 20, 2007...All signs now suggest that the Bull Market rally from the 2002-2003 lows is OVER!!! The above chart was posted on July 12th suggesting PRIMARY wave (B) was virtually complete. This past Monday, we indicated that a final intraday high for the DJIA was likely on Tuesday...July 17th. In fact, the DJIA did peak at 14021.95 that day (which was 144 Fibonacci days from the February 20th top at 12795.93). PRIMARY wave (C) should now be underway. At a minimum, the DJIA is likely to retrace all of the gains of the past three years. |


Long Term Perspective (the following chart was created on January 7, 1998):

Other Long Term Charts:


|
Important: Information provided is for educational purposes only and is not, directly or indirectly, to be construed as investment advice. Also, no guarantees are made with respect to the accuracy of the information, opinions, predictions, etc. offered here in.
|


