Learn Elliott Wave Online
Learn Elliott Wave on DVD
|
Elliott Wave Bookstore
(Click here for complete listing
of Elliott Wave books)
Free Charts
IMPORTANT: Chart buy/sell signals are helpful in determining market support and resistance levels...and probable turning points. However, they are only useful if the analyst has a handle on the larger trend. Experience and judgment play a vital role in that determination ...as does Elliott wave analysis.
If a chart does not not appear when you click on the link, you may need to (1) enable javascript, and/or (2) disable pop up blocking for this site, or (3) right click on your mouse and open the link in a new tab or window. Charts will generally appear when you use Internet Exploer or Firefox. Do not use Google Chrome to view charts.
Contact us at info@wavechart.com if you have a question or comment. |
| |
| Elliott Wave
Message Board
and FREE charts of the Dow Jones Industrial Average
with Up to the Minute Buy/Sell Signals |
|
Here are the charts that we used to forecast a top during the week of October 1, 2012
(* from our 9/28/12 and 10/5/12 subscriber updates)
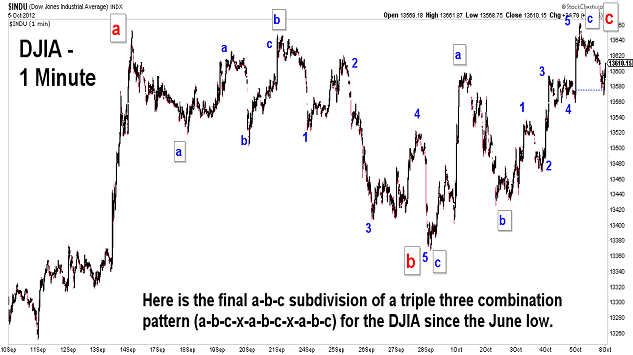
| October 5, 2012 update...Last week's suggested call for an alignment of price, time and pattern in the DJIA was virually perfect. The slight miss was the DJIA closing at 13610 rather than 13616, and wave "c" being a normal wave rather than a "failure." But, for me that's close enough. All we need now is for the market to decline from here. If the count is right, the initial target is the 2011 lows, possibly even the 2010 lows. We'll see. |
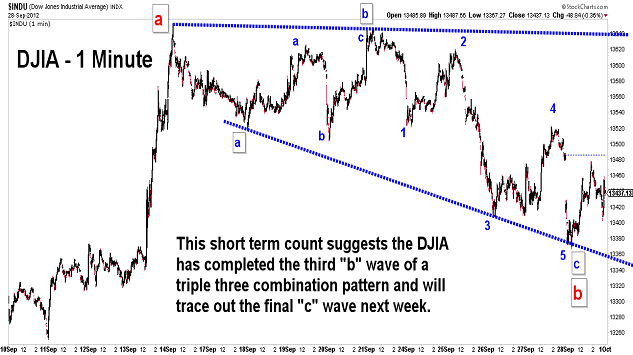
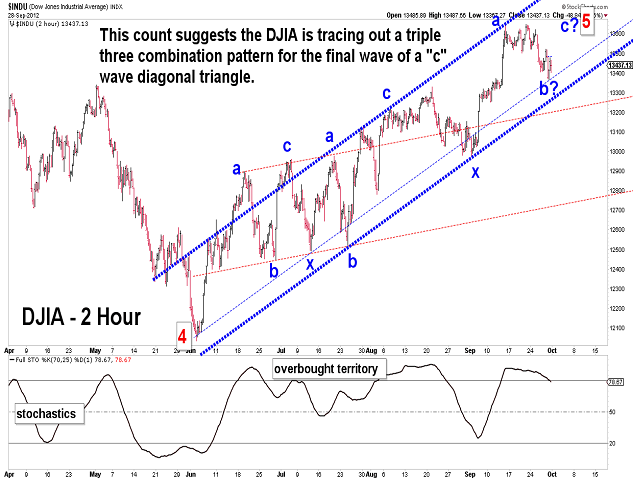
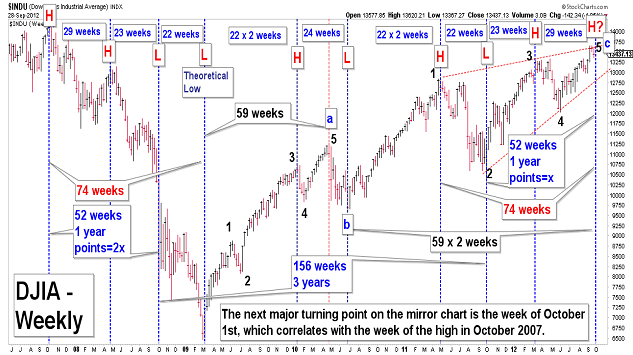
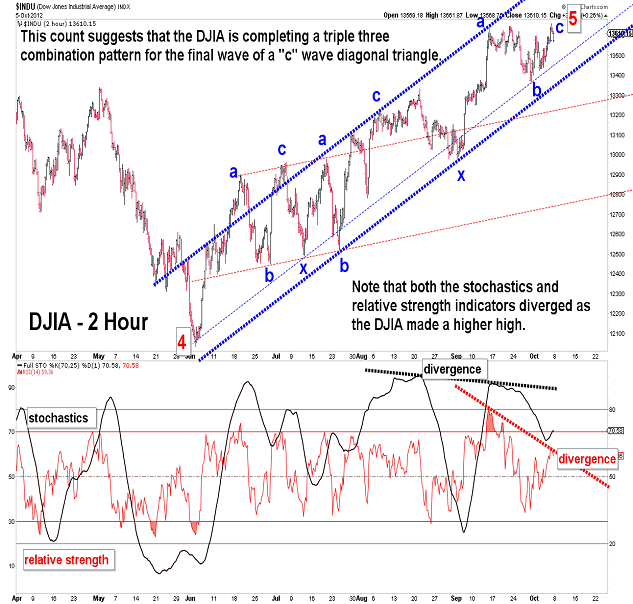
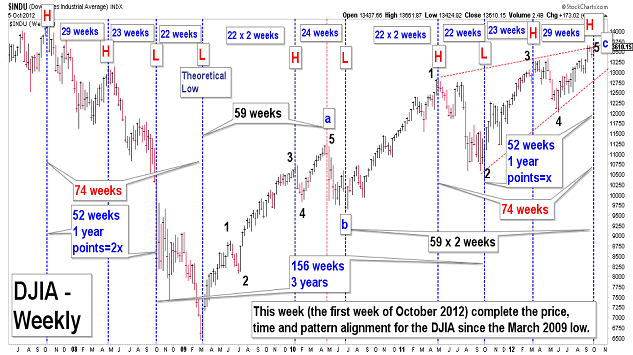
| September 28, 2012 update...Bottom line, next week has the potential to be mathematically ideal for a major market reversal in terms of pattern, price and time...the big three elements of Elliott wave analysis. (1) Pattern - since the June low, the DJIA appears to have traced out a triple three combination pattern. It just needs one more "c" wave rally. (2) Price - if the "c" wave ends in a "failure" around 13616, the rally of the past 52 weeks (1 year from the October 2011 low) will be excactly 50 percent of the 52 week (1 year) decline from the October 2007 high until the October 2008 low. (3) Time - as you can see in the weekly chart above, next week correlates timewise with multiple weekly patterns over the past five years, including the week of the October 2007 high. Most of the time it seems that these events are only apparent in hindsight. We'll see if this one works out in real time! |
Important: Information provided is for educational purposes only and is not, directly or indirectly, to be construed as investment advice. Also, no guarantees are made with respect to the accuracy of the information, opinions, predictions, etc. offered here in.
|
Copyright © 1997 - 2008. The Elliott Wave Chart Blog. All rights reserved. Email
|