Elliott Wave Charts and
Market Timing Analysis of the U.S. Stock Market
2008 Updates
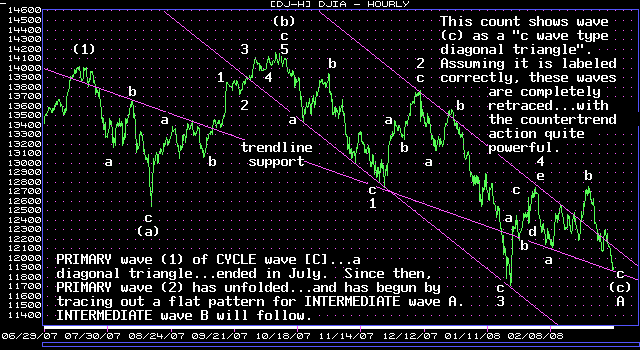
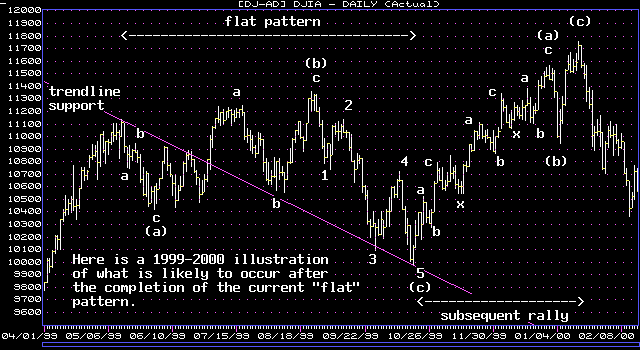
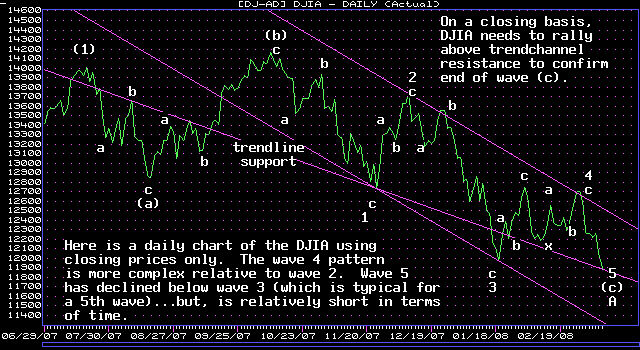
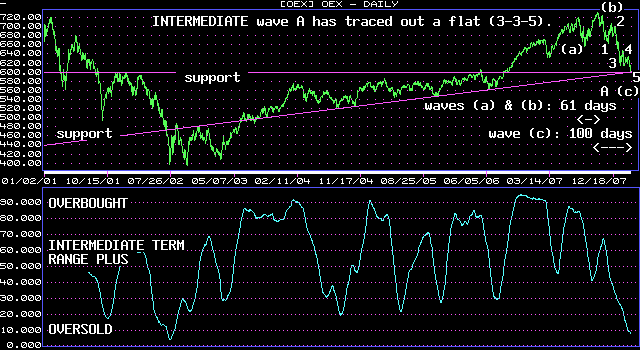
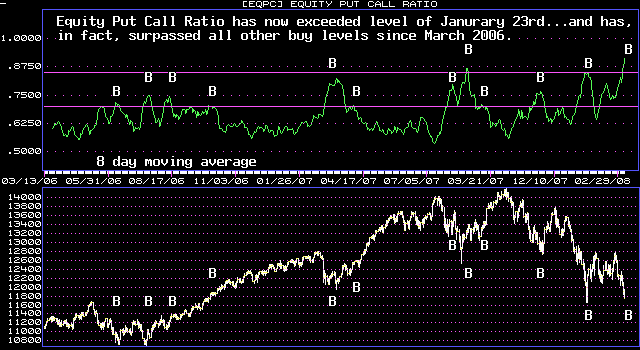
| March 6, 7 & 10, 2008 update...All of the indices and indicators that I analyze in connection with price, time and pattern (as well as the pain in my gut) suggest that wave (c) is ending. A rally above Wednesday's high should confirm it (so would a higher weekly close next Friday). Thursday, wave (c) reached its 100th trading day...a Fibonacci 161.8 percent of the combined length of waves (a) and (b) (61 trading days). There is also an 85 week Cycle low pattern that resolves this week from the low that occurred the week of July 21, 2006. Finally, the pattern of wave 5 now has the "right a-b-c look" for a "wave c type diagonal triangle". The February 8, 2008 discussion of a 5th wave "thrust" is no longer valid (see the February 8th update below where I suggested that the shortness of time factor for a thrust could be a "fly in the ointment"...it was.) As a general rule, a 5th wave decline extends below the end of the 3rd wave. That has already happened on a closing basis. It has nearly done so on an intraday basis. But, if it does not occur...the current 5th wave will be a "failure"...and that will add to the overall bullishness of the (c) wave diagonal triangle pattern that is ending. |
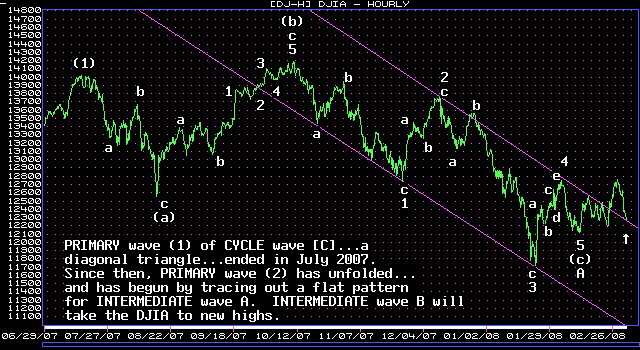
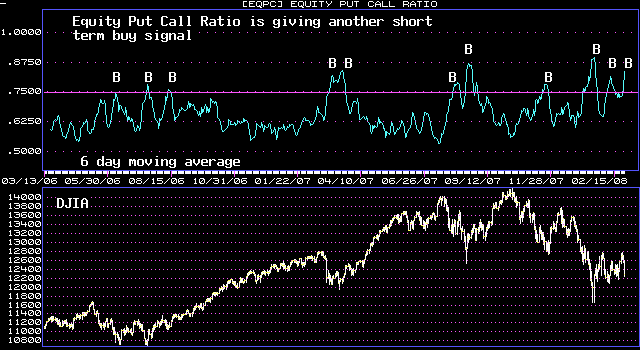
| February 29, 2008 update...The current decline was the pullback mentioned in the last update. We are testing the previous trendchannel resistance line...which should now be support. If my analysis is correct, the rally to new highs should begin from this area. Learning Elliot Wave Theory is something every economics and online business management degree student should study. It will help them understand the complexities of the stock market and will assist them in their own personal investment decisions. |
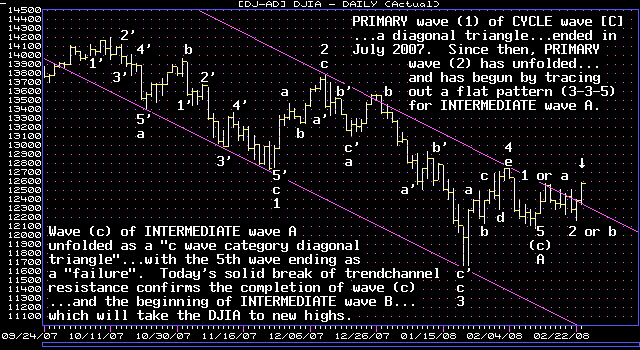
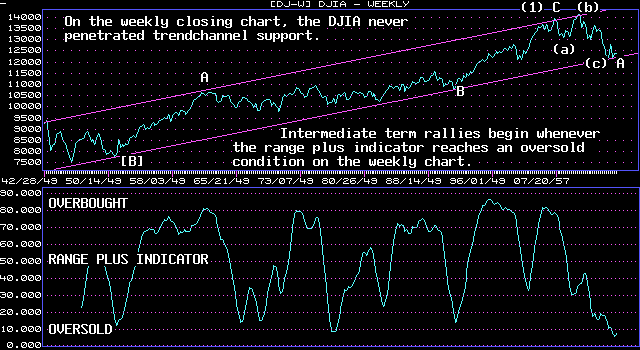
| February 25, 2008 update...Today's solid break of trendchannel resistance confirms that: (1) January 22nd was the LOW for the year, and (2) the DJIA has begun a rally to NEW HIGHS. The current short term rally is likely to be followed by at least one pullback...before INTERMEDIATE wave B EXPLODES to new highs. As the corrective pattern develops, I think the disbelieving majority will be shocked at the speed of the market as it rallies to new highs! |
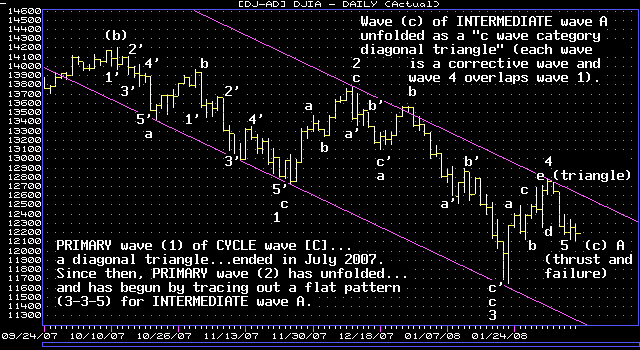
| February 8, 2008 update...The DJIA traced out waves 4 and 5 of (c) essentially as we forecast two weeks ago. The only fly in the ointment at the moment is the time factor for wave 5. Waves 1 and 3 lasted 7 and 6 weeks, repectively. Wave 5 has (so far) lasted only 1 week...and, if it is (nearly) over...ended as a "failure" (a rare occurence...but one that I suggested was likely in the previous update). Shortness in time is not necessarily problematic, however, given the fact that wave 4 was a triangle and, according to Elliott wave rules, is followed by a short and swift "thrust". Until the market rallies through trendchannel resistance, one must be aware that there could be some further 5th wave complexity. All signs now point (at least to me) that the market has made its low for the year (see 85 week CYCLE low reference below)...and the next intermediate term move in the market will be a rally to new highs in the coming weeks and months. |
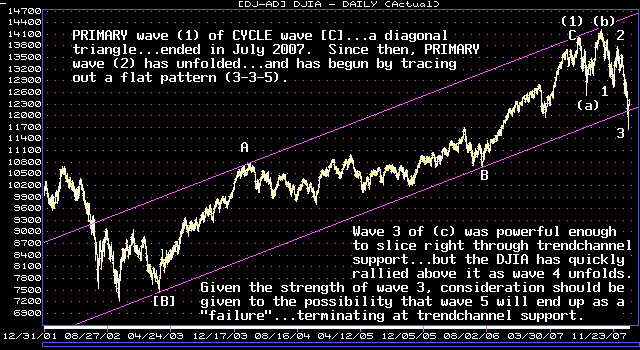
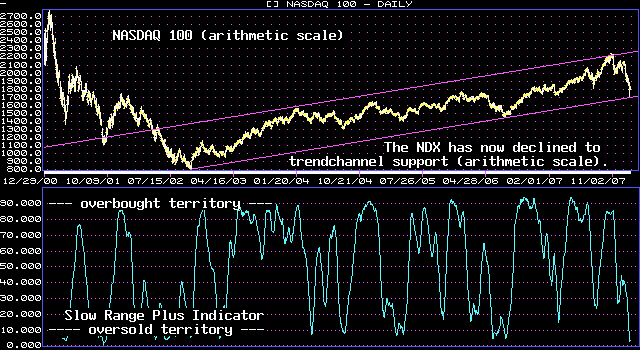

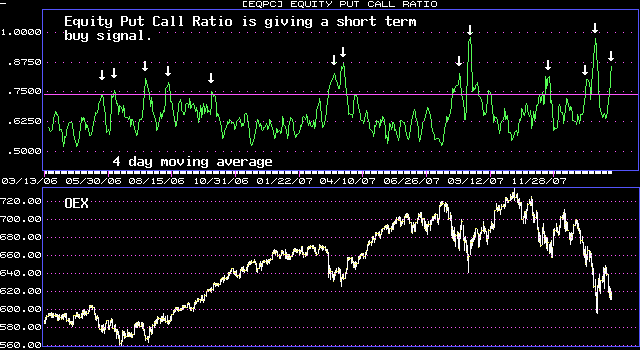
| January 24, 2008 update...Last week I speculated that the 85 week Cycle low might be early...it was, in fact, by 1 week. On Tuesday and Wednesday of this week the market experienced "crash" type emotion which was enough to cause the DJIA to overshoot (see last week's update) its trendchannel support line...both on an intraday and closing basis (but not so on the weekly closing chart). The market, however, reversed quickly and the 4th wave rally (of a "c" wave diagonal triangle) is now underway. The DJIA should, at the very least, retrace its "crash" wave...which began at 12930. It could perhaps reach as high as the 13000-13100 area. Anything much higher than that would require an alternate wave count. Once the current rally ends, the DJIA should decline once again... tracing out a final 5th wave. Given the strength of wave 3 I would not be surprised to see wave 5 end in a "failure" near the recently broken trendchannel support line. (That is just a guess...and not a prediction!) Once the 5th wave ends (if my analysis is correct)...wave "A" of PRIMARY wave 2 will be complete. A wave "B" corrective wave will follow...which will, I believe, include a rally to new all time highs (see OEX chart above). |
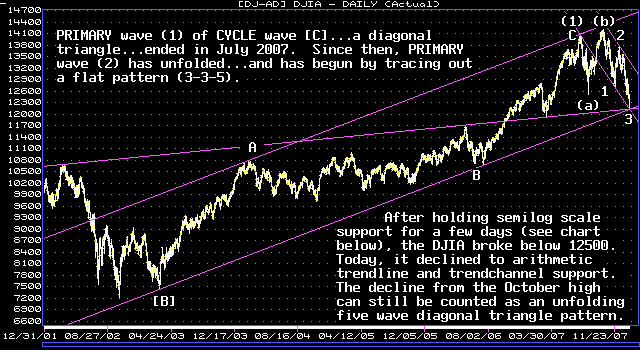

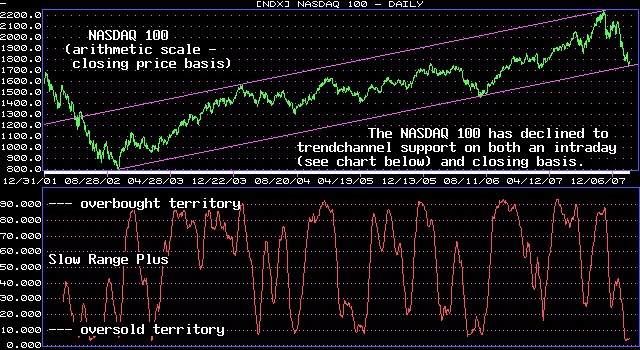
| January 17, 2008 update...The DJIA did not hold semilog scale support at last week's lows...and today declined to long term arithmetic trendline and trendchannel support. (The NASDAQ 100 did decline to semilog scale support today...see chart above.) The wave count we suggested in the last update is still viable and, in my opinion, the one that currently makes the most sense. (Note: there are alternate counts that come into play if the next rally takes the DJIA beyond 13780.) Remember that we have been in a corrective market since last July (we were the first...and possibly the only...Elliott wave site to declare the end of the bull market last July when it actually occured...see below). Accordingly, all declines are likely to overshoot initial support areas. But, with the DJIA now at trendline support...and most technical indicators giving strong buy signals...a 4th wave rally should begin from near current levels. Since the last 63 week Cycle high was one week late, it is possible that the 85 week Cycle low due this month will be early. We'll see!! |

| January 8, 2008 update...The DJIA failed to hold its November low today and declined to the area of semilog scale support. Our forecast of a DJIA "b" wave rally back to its October 2007 highs has now been postponed until later this year...after the DJIA has completed a 5 wave "diagonal triangle" (c) wave decline. If my analysis is correct, wave 4 is next and should lift the DJIA about 1000 points or so. A final 5th wave decline will follow to complete wave (c)...possibly by March. We'll see!! |
Important: Information provided is for educational purposes only and is not, directly or indirectly, to be construed as investment advice. Also, no guarantees are made with respect to the accuracy of the information, opinions, predictions, etc. offered here in.
|