|
Charts
IMPORTANT: Chart buy/sell signals are helpful in determining market support and resistance levels...and probable turning points. However, they are only useful if the analyst has a handle on the larger trend. Experience and judgment play a vital role in that determination ...as does Elliott wave analysis.
If a chart does not not appear when you click on the link, you may need to (1) enable javascript, and/or (2) disable pop up blocking for this site, or (3) right click on your mouse and open the link in a new tab or window. Charts will generally appear when you use Internet Exploer or Firefox. Do not use Google Chrome to view charts.
Contact us at info@wavechart.com if you have a question or comment. |
|

Elliott Wave Chart Blog January 2010 Archive
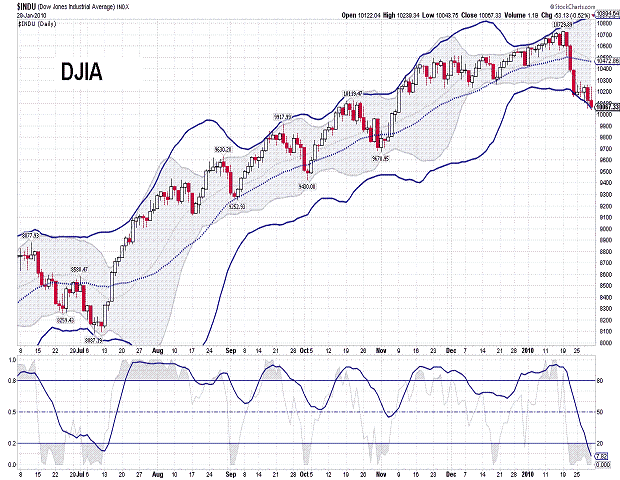
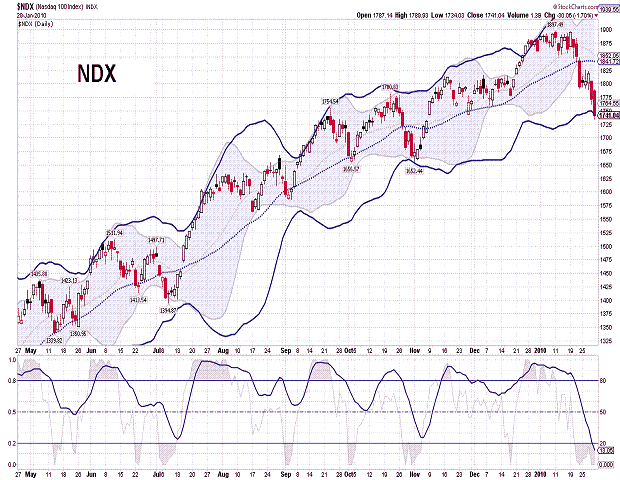
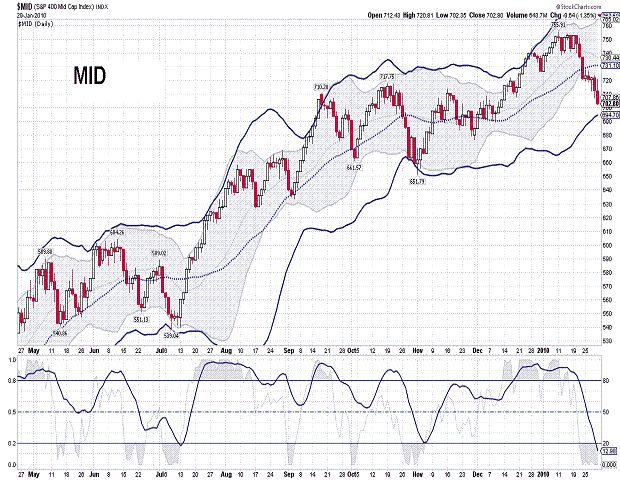
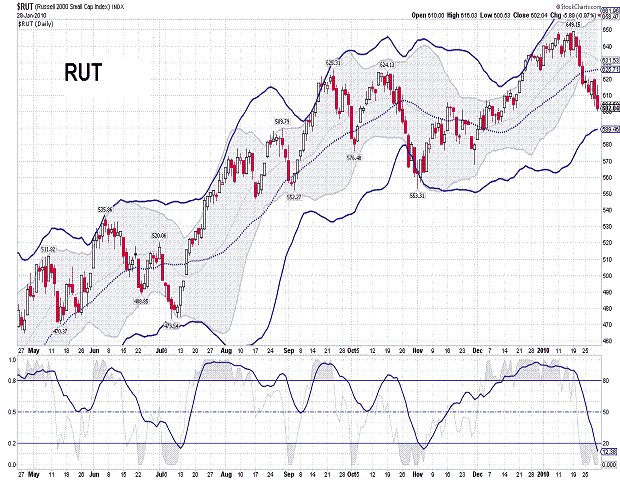
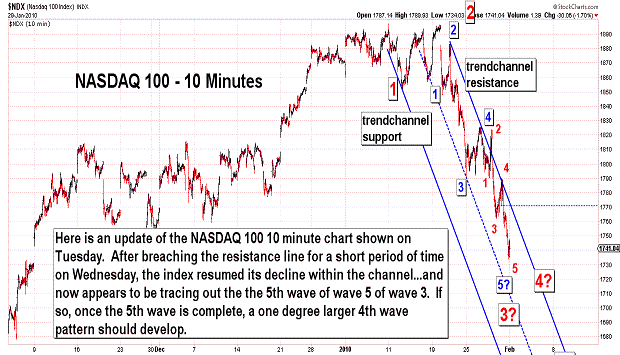
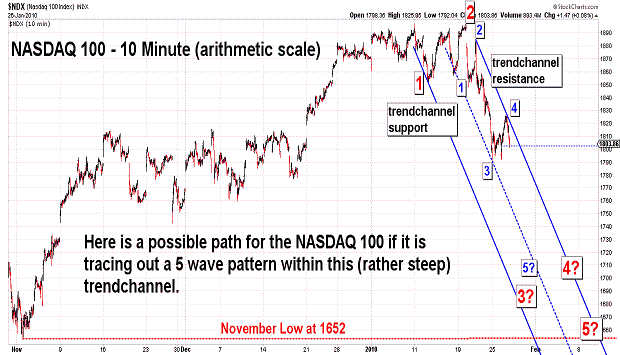
| January 29, 2010 update...The DJIA lost another 1 percent this week...the NASDAQ 100 lost even more - 3 percent. For the month of January, the DJIA declined about 3 1/2 percent...and this is a negative omen for the rest of the year. In an email I received today it was pointed out that "...Yale Hirsch of the The Stock Traders Almanac suggests that since 1950, every down January in the S&P500 preceded a new or extended bear market, or in some cases, a flat market. They go on to further suggest that down January's are followed by substantial declines averaging -13%." My own analysis suggest that this year's decline will be substantially more than 13 percent. Shorter term, the various market indices are giving slightly different indications where the next bounce or temporary low is likely to occur. The four daily charts above - DJIA, NDX, MID, RUT - show the indices at different points relative to their lower bollinger bands...the DJIA is currently sliding down its band...the NDX touched its band today...and the MID and RUT are still above but declining toward their bands. So, there is room for further declines early next week...but, the case for a short term bounce or consolidation is gaining strength. I think the clearest case can be seen in the 10 minute NDX chart which shows the index (potentially) in a 5th of a 5th wave (of 3) from the January 19th high. This suggests that a 4th wave consolidation is likely once the index turns higher. We'll see. |
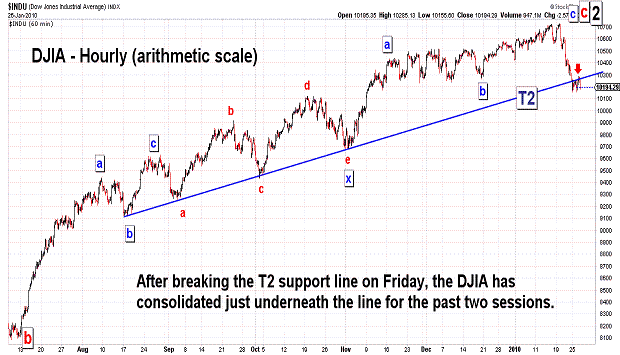
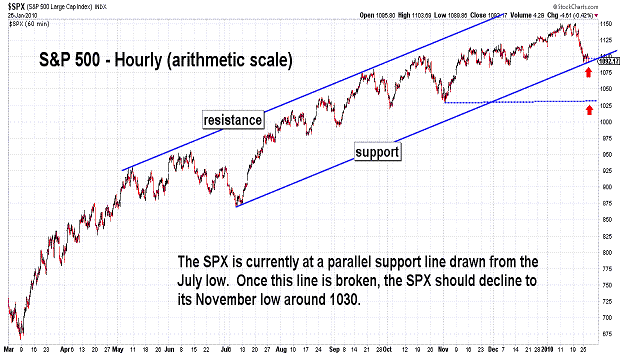
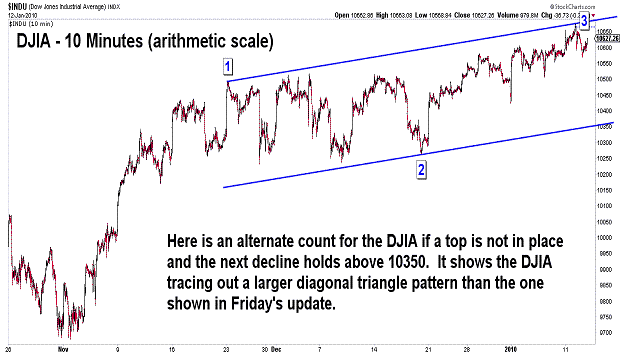
| January 26, 2010 update...On Friday, I said that the T2 trendline (see first chart above) was a likely "pivot point during any consolidation that occurs at the conclusion of the current decline." During the first two trading sessions this week, it was! If the current consolidation continues through tomorrow, the T2 trendline is likely to continue to provide resistance. However, any significant decline below today's low should suggest that the next phase of the intermediate term decline is underway...which should take the DJIA toward its next target...the November low around 9700. |
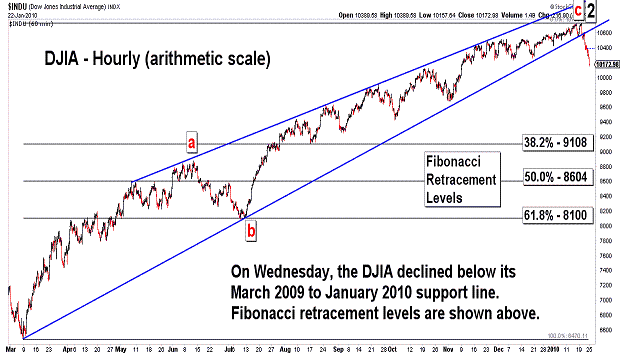
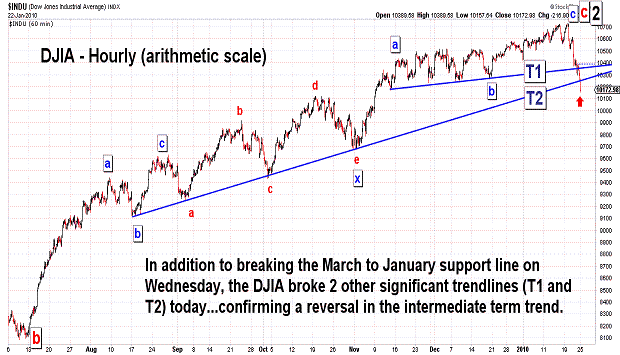
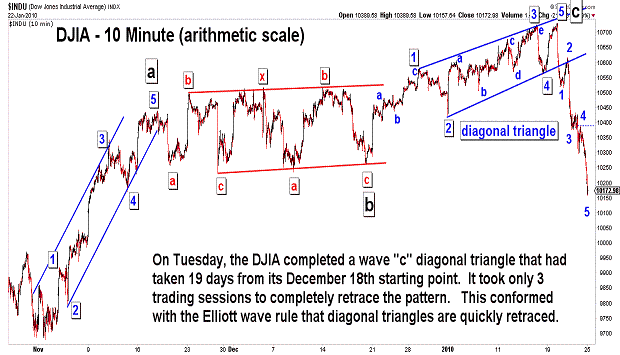
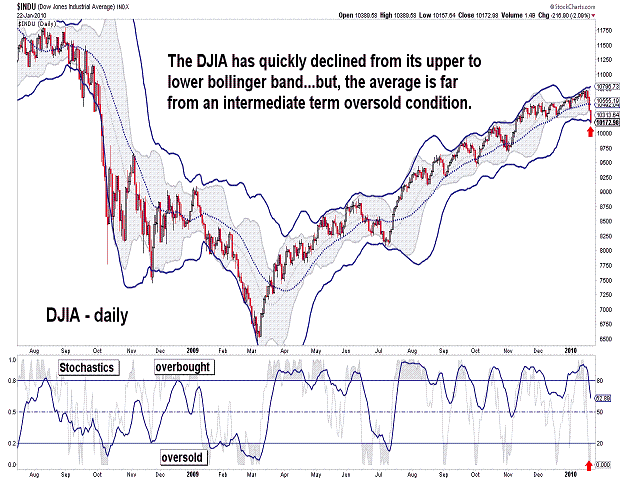
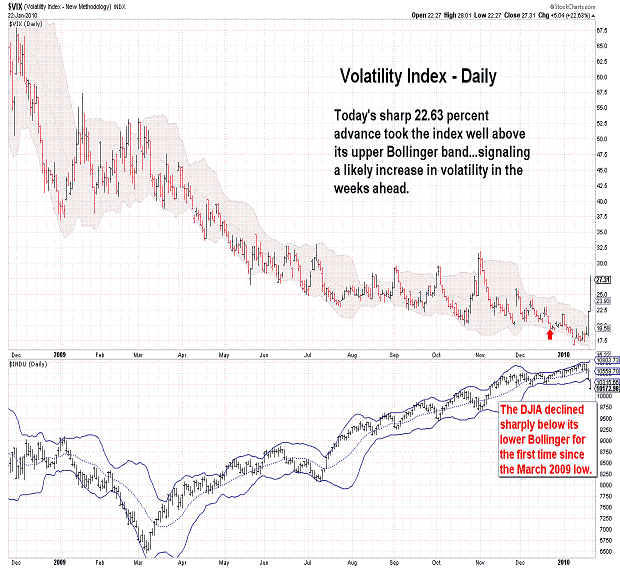
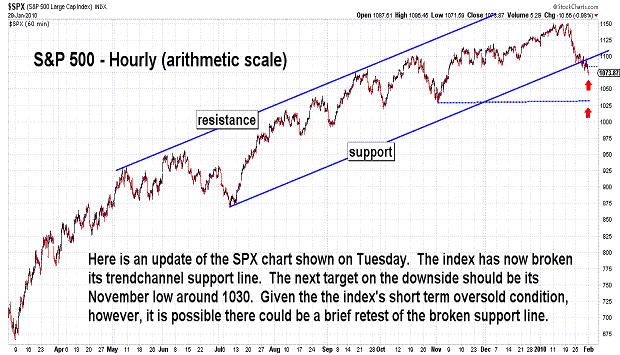
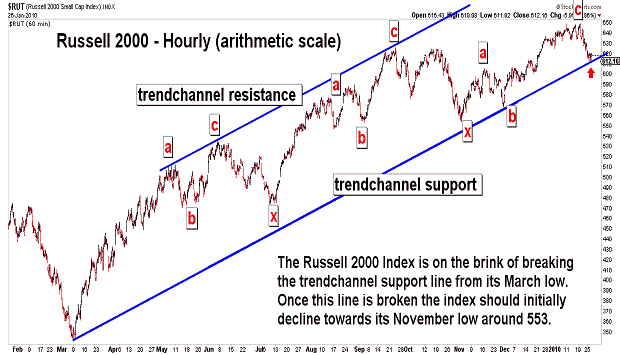
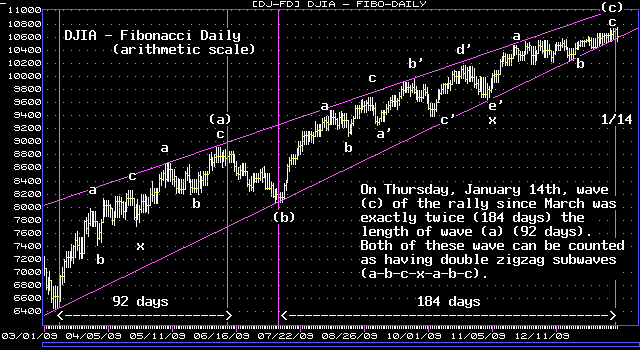
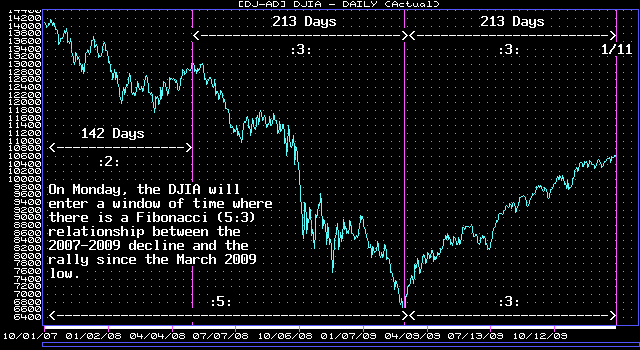
| January 22, 2010 update...On Tuesday, I suggested that an intermediate term decline would be confirmed before this update. It was! This week's 436.67 point decline was the largest weekly point loss since the (low) week of March 6, 2009 (435.99 points). Three significant trendlines were broken during the week (see the first two charts above)...one on Wednesday and two today. Most importantly, the decline from Monday's high looks impulsive, i.e., 5 waves...suggesting that the main trend of the market is now downward. The intermediate term (countertrend) rally from the March low (wave 2) lasted 10 months...so, it is reasonable to expect that the current intermediate term decline (wave 3) will last at least as long or longer. Timewise, wave 2 lasted almost a perfect Fibonacci 62 percent of the time of wave 1 (October 2007 to March 2009 decline)...and waves "a" and "c" of wave 2 were related to each other by an exact 1:2 ratio (see first chart from January 16th's update - DJIA theoretical high occurred on January 14th). Given the Fibonacci relationships that have occurred between the waves since the October 2007 high, it is likely that additional Fibonacci time relationships will develop with and within wave 3 as well. We'll see! Shorter term, watch the T2 trendline (see second chart above) as a pivot point during any consolidation that occurs at the conclusion of the current decline. |
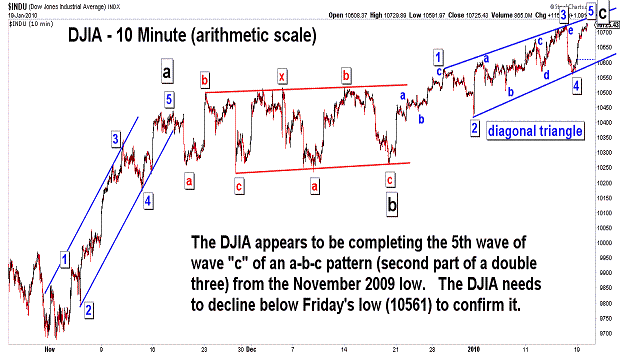
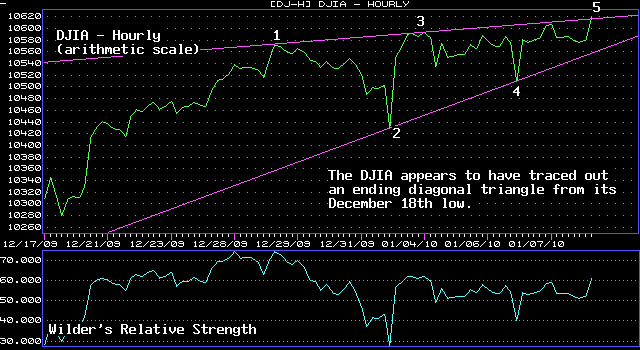
| January 19, 2010 update...Today's update will be brief because of yesterday's holiday. In the last update, I said that "...the DJIA and other market indices (would) have to continue to decline below (Friday's) low (10561)" to confirm that a top was in place. That certainly did not occur today. Instead, Thursday's top was negated by today's strong rally to a new intraday high. (Note: Today's theoretical high did not exceed last Thursday's theoretical high...so the Fibonacci day time cycle remains in place.) From an Elliott wave perspective, however, today's new high helped to clarify the wave pattern from the December 18th low of 10263. The pattern now has a definitive Elliott wave look...as an ending diagonal triangle pattern. The 5th wave of the pattern began Friday afternoon and continued into today's close. If this count is correct, a sharp decline should follow the completion of wave 5 and take the DJIA below 10561. As I previously suggested: "...(if) and when that happens, more significant trendlines going back as far as the March low will also be broken. This will confirm, in my opinion, that the March 2009 to January 2010 countertrend rally is over...and that an intermediate term decline is underway." It is highly likely IMO that this will occur before the next update. |
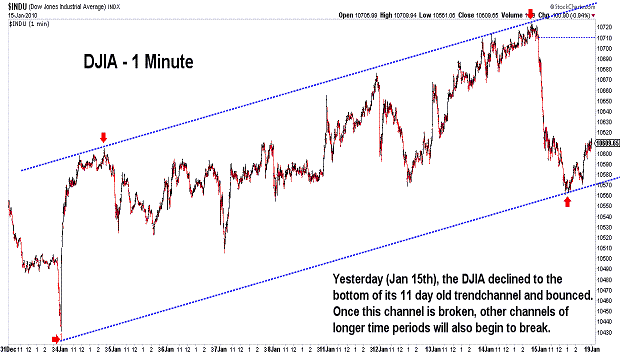

| January 16, 2010 update...In this past Tuesday's update, I pointed out that "Elliott wave patterns sometimes increase in complexity during (option expiration) periods." What looked like a possible top last Monday (in conjuction with a time cycle on the daily chart - see last Friday's update) was erased and replaced with a slightly higher top on Thursday (in conjuction with a time cycle on the Fibonacci daily chart - see chart above). Yesterday's decline was the sharpest of the new year and broke some short term trendlines. Despite a late session bounce, it produced a key reversal pattern on the weekly chart. So, if a top is now finally in place, the DJIA and other market indices will have to continue to decline below yesterday's low (10561). If and when that happens, more significant trendlines going back as far as the March low will also be broken. This will confirm, in my opinion, that the March 2009 to January 2010 countertrend rally is over...and that an intermediate term decline is underway. How low we eventually go will be addressed in future updates. |
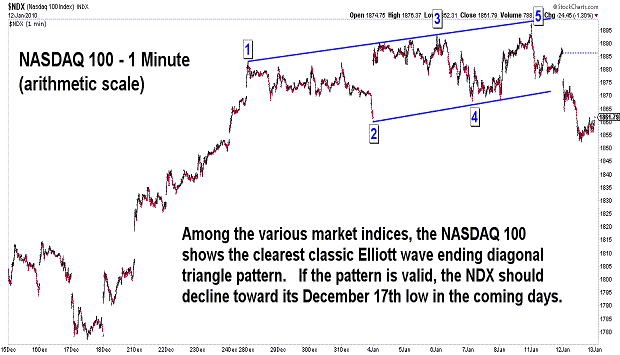
| January 12, 2010 update...The DJIA reversed course today in line with a Fibonacci time cycle that called for a closing high yesterday. (See chart in Friday's update). In terms of the DJIA's short term pattern, however, it is not yet clear whether the FINAL high of the March to January rally is in place. The decline in the DJIA today was weak relative to most of the other market indices. One of the indices that did decline substantially today and does show a clear Elliott wave pattern is the NASDAQ 100...which shows the completion of a diagonal triangle pattern yesterday...and a decline below the triangle's support line today. If the pattern is valid, the NDX will retrace its rally from December 17th in the coming days. Should that decline occur, the rest of the market will certainly follow...and that should confirm that the rally from March is over...and an intermediate term decline is finally underway. Anything short of that development...and numerous other possible topping patterns come into play (see DJIA 10 minute chart for an example). One thing to keep in mind this week is option expiration. Elliott wave patterns sometimes increase in complexity during these periods. Let's see what happens over the next three days. |
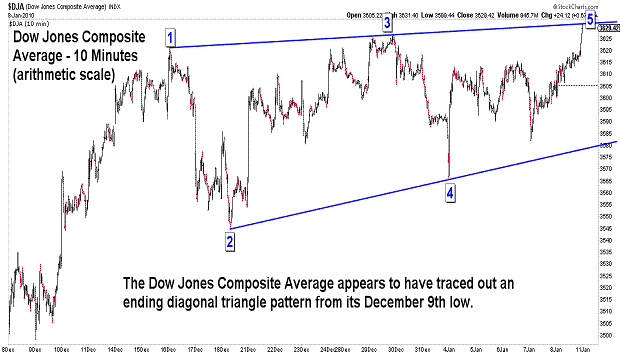
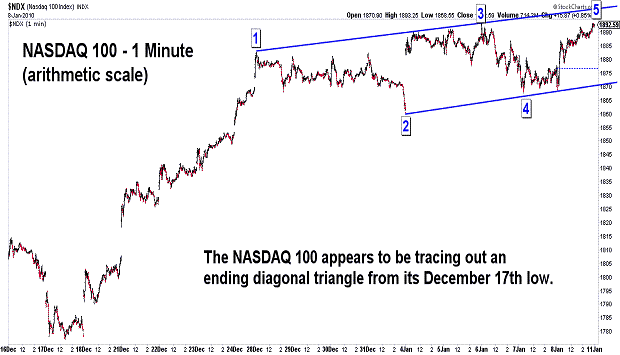
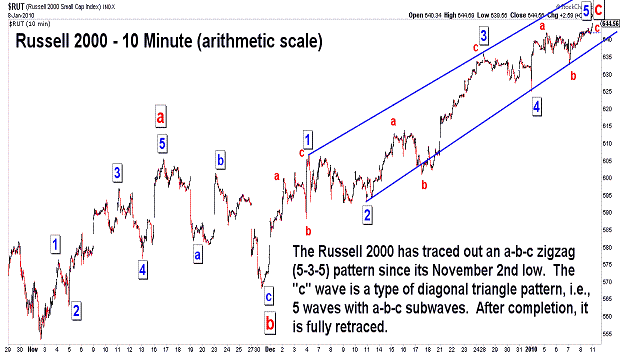
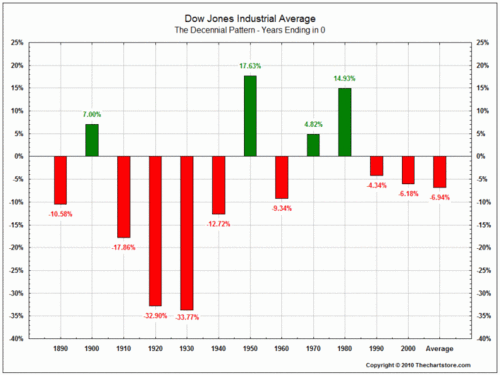
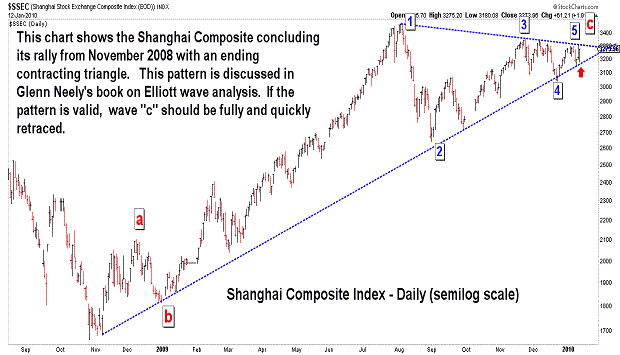
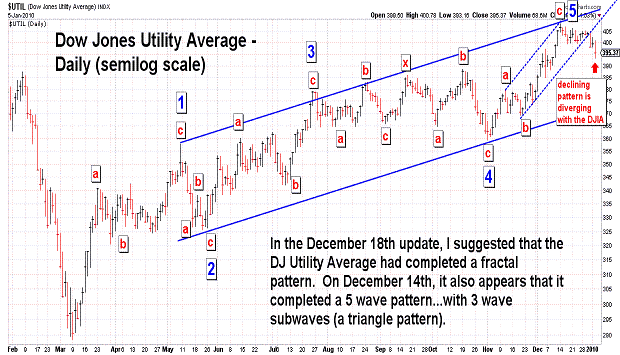
| January 8, 2010 update...In Tuesday's update, I suggested that "a more complex topping process (was) possible over the next few days", but I continued to emphasize that an intermediate term top was imminent. Well, the "complex topping process" has, in fact, occurred...in the form, I believe, of a diagonal triangle pattern (see charts above of DJIA, DJA, NDX and RUT). If my labeling of the waves is correct, once the pattern is complete, a quick retracement should occur. When (and if) this does happen, important support trendlines will be broken (see chart examples in recent updates)...and this will confirm that an intermediate term decline is finally underway. If you are interested in what other Elliott wave stock market forecasters have to say right now, there seems to be a consensus that a major decline is coming. The only difference is one of degree. Prechter's Elliott Wave International organization is predicting a decline well below the 2009 low. Glenn Neely in his NeoWave service forecasts a test of the November 2008 low. He is currently suggesting that the DJIA may be tracing out a multiyear triangle pattern...something I suggested as a possibility back in 2008. Time will tell who is correct. Politics aside, much (I think) now depends on the action of the Federal government. If they continue to squeeze out the private sector in favor of more government spending, increased regulation, etc. we may, in fact, be in for a bigger and longer bear market than I expected several years ago. For the worst case scenario, see the long term chart in the November 20th update. If that chart is accurately labeled, we are following the 1937-1938 pattern (on a larger scale)...which would be, to say the least, a frightening prospect. One final note: years ending in "0" are historically negative (see last chart). |
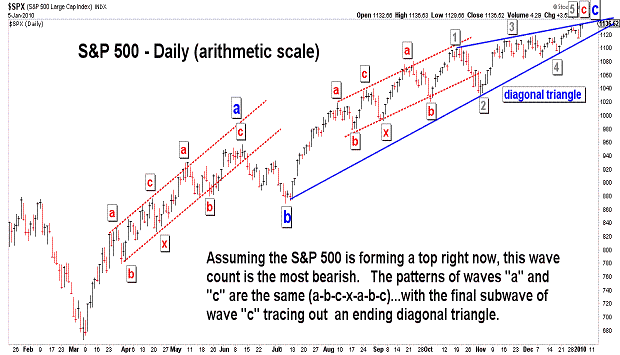
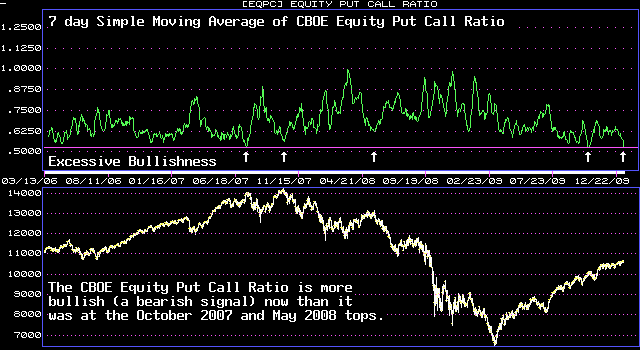
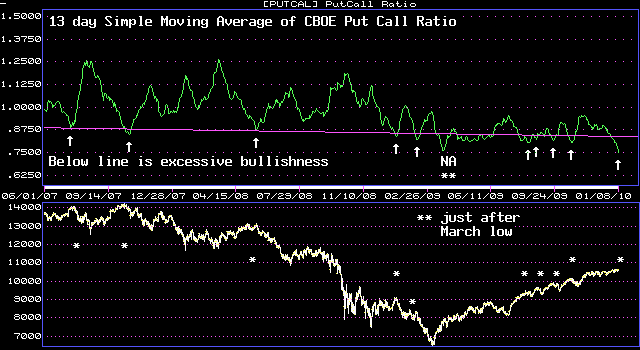
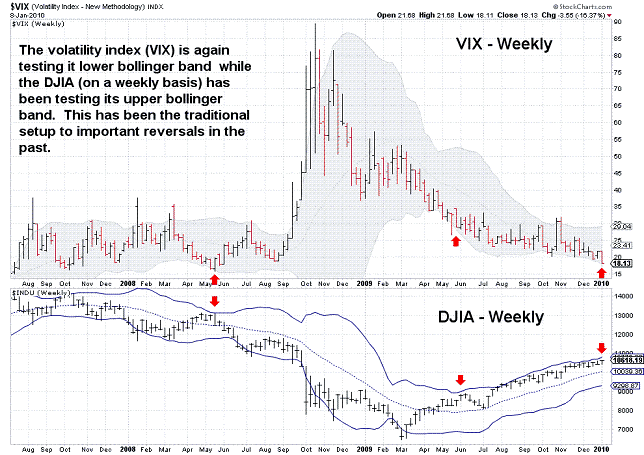
| January 5, 2010 update...Happy 2010! If I am right about the stock market, however, it will not be a happy year for investors who own stocks. As each trading day passes, the technical condition of the market grows weaker. The market's own momentum has allowed it to struggle higher...but, it has only gained 4 1/2 percent since its October high. Last week's low is now, I believe, the critical support level for the market. On the DJIA, it was 10428. Last week's low occurred right on an important support line for a variety of indices. While a more complex topping process is possible over the next few days, the next significant decline which takes us below last week's low will, in my opinion, suggest that a top is in place...and an intermediate term decline is underway. As I said in the last update "...market technicals, cycles and sentiment are again aligned to suggest that a reversal is imminent." I think the charts above support that proposition. Of course, the market itself always has the last word! |
Important: Information and chart access provided herein is educational in nature and shall not, directly or indirectly, be construed as investment advice. No guarantees are made with respect to the accuracy of the information, opinions, predictions, etc. offered herein.
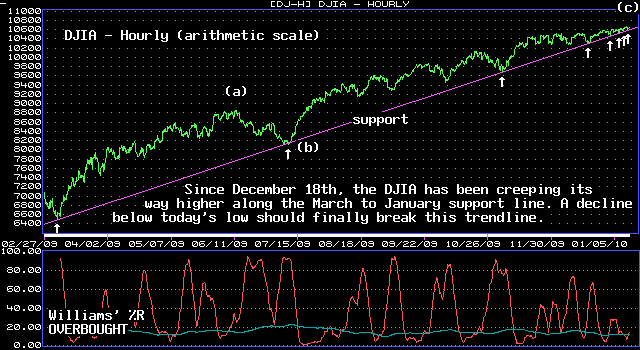
Copyright © 1997 - 2012. The Elliott Wave Chart Blog. All rights reserved. Email
|