|
Charts
IMPORTANT: Chart buy/sell signals are helpful in determining market support and resistance levels...and probable turning points. However, they are only useful if the analyst has a handle on the larger trend. Experience and judgment play a vital role in that determination ...as does Elliott wave analysis.
If a chart does not not appear when you click on the link, you may need to (1) enable javascript, and/or (2) disable pop up blocking for this site, or (3) right click on your mouse and open the link in a new tab or window. Charts will generally appear when you use Internet Exploer or Firefox. Do not use Google Chrome to view charts.
Contact us at info@wavechart.com if you have a question or comment. |
|

Elliott Wave Chart Blog January 2011 Archive
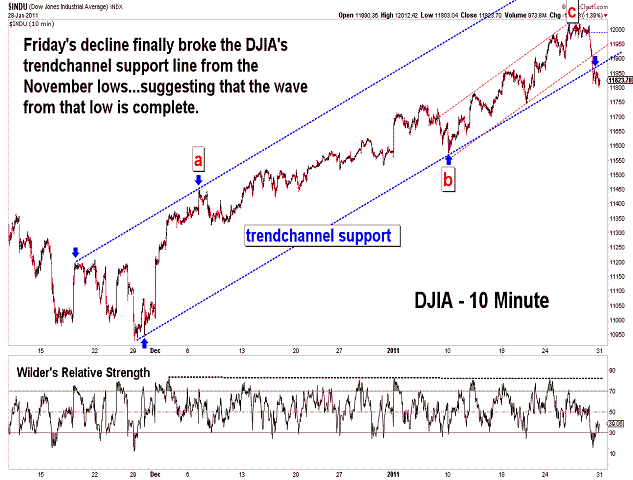
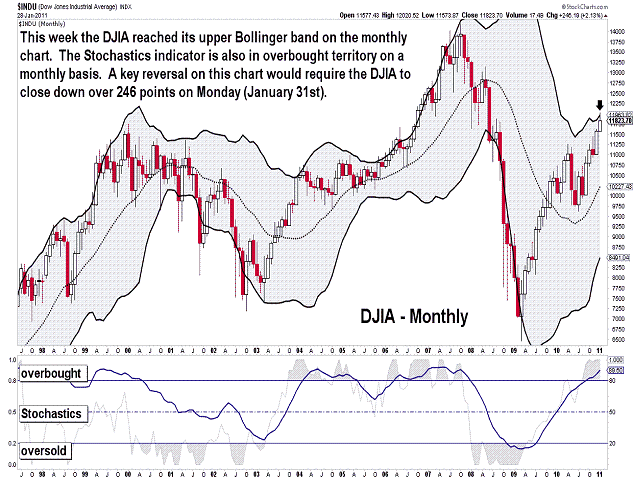
| January 29, 2011 update...The DJIA gave its first indication of an important top with its key reversal week. An even better short term indication would be a key reversal month, but that would require a decline below 11577 on Monday. While a 247 point decline is certainly possible, it is not likely. In any event, my current wave count labels the entire advance from the August 2010 low (9936) as an "e" wave. If the labeling is correct, the entire advance from that low should be rapidly retraced, i.e., in much less time than it took the 5 months to unfold. As crazy as it seems, my count suggests a selloff to the 8400-8500 area in the coming weeks. Anything other than that would mean some other count is in effect. The next important trendline support level is near the November low of 10929. That's the current level of the "b" wave horizontal triangle's support line. |
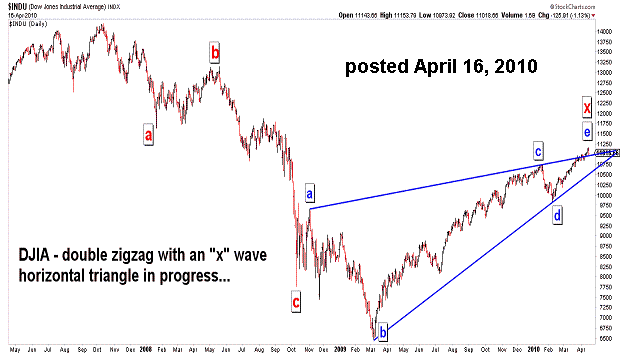
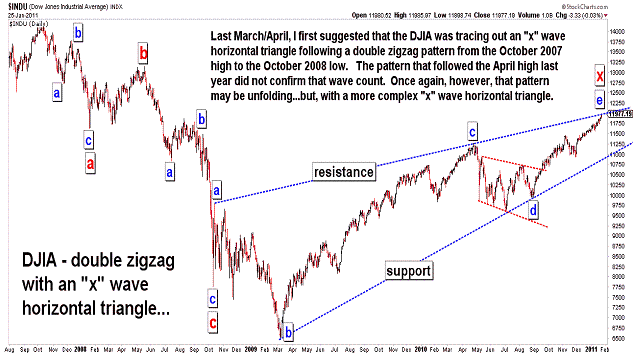
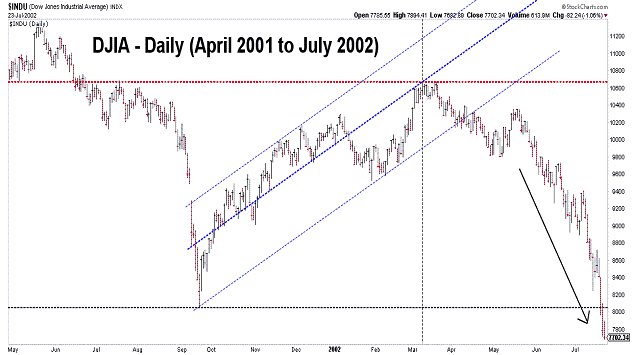
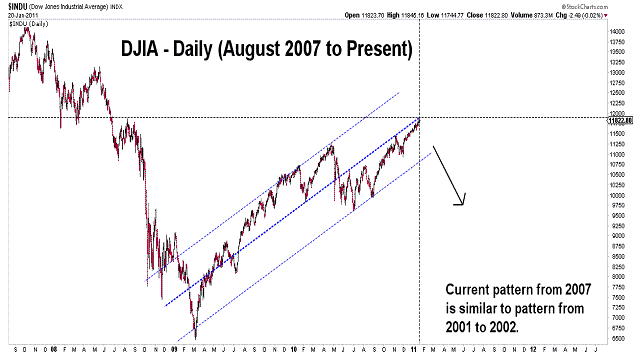
| January 25, 2011 update...With the exception of the DJIA, OEX and XMI, this week's bounce in the broad stock indices has not lead to new highs. Price divergences among the market indices is yet another sign that a top is forming. See recent updates for other signs. Last March and April, I first suggested that the larger degree wave count in the DJIA from the October 2007 high appeared to be a "double zigzag with an "x" wave horizontal triangle". The action following last April's high, however, did not confirm the validity of that wave count and I gave up on it. But now, with the rally of the DJIA back to the "x" wave triangle's resistance line, that wave count is once again a possibility. The "x" wave triangle is just more complex that I assumed it was last year. If this count is valid, the current rally, i.e., wave "e", must end soon...and a powerful decline must follow its conclusion. The first indication will be a lower close for the week in the DJIA, i.e., below 11871 on Friday. We'll see if it happens this week! |
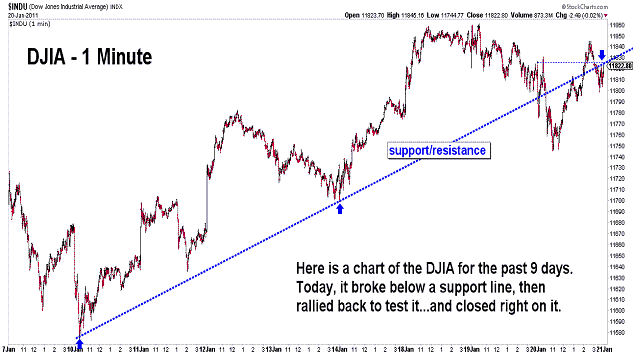
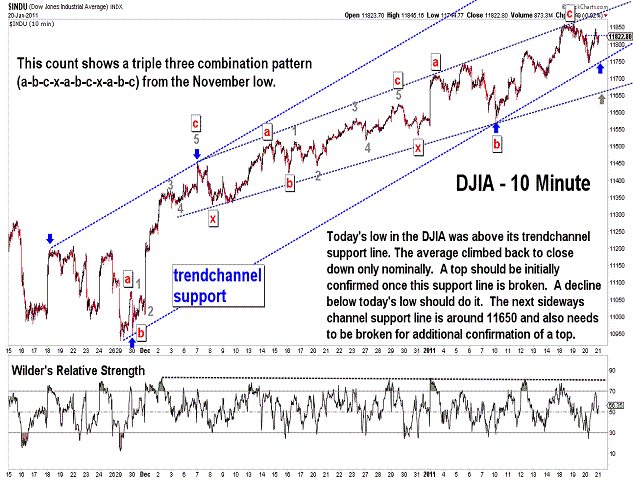
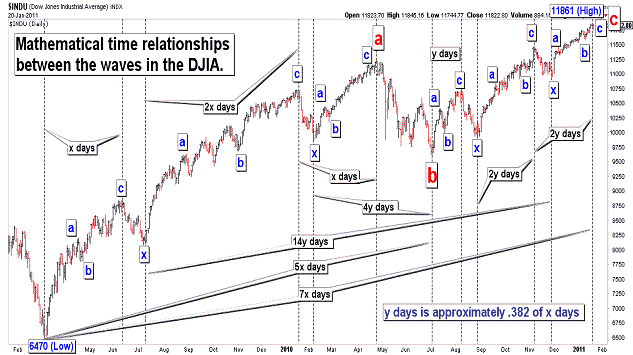
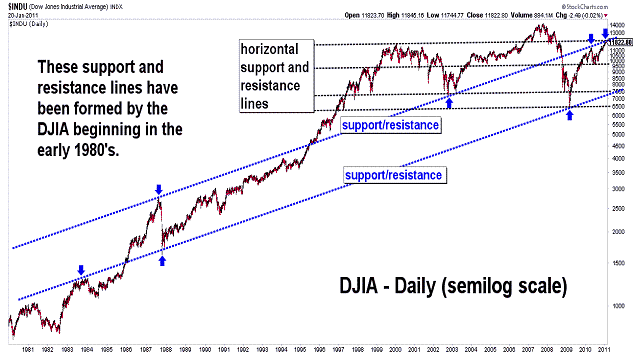
| January 20, 2011 update...I posted nine (9) charts tonight. I think that is the most I have ever created for a single update. It is much easier to show what I see, rather than try to explain it. And what I see (and have seen for quite some time now) is the formation of a major top for the market. The technicals, cycles, market sentiment, patterns, trendlines, bands, etc., etc...all suggest the same thing...the end of the rally from March 2009 and the beginning of a major decline. Sure, the topping process could drag on for a while longer...but, the risk/reward of staying in for higher prices is just not worth it IMO. I am not sure what the triggering event will be that topples the market...but, down the road it will interesting to hear the bulls explain how they failed to heed the warning signs. |
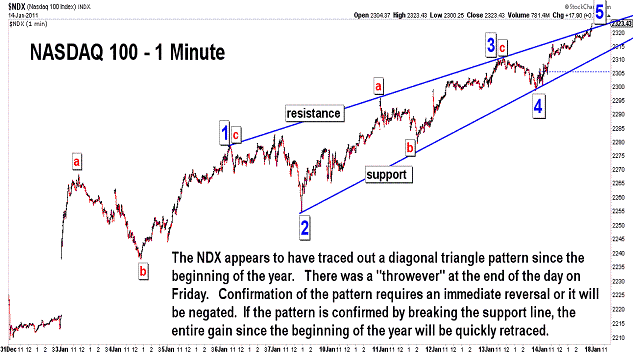
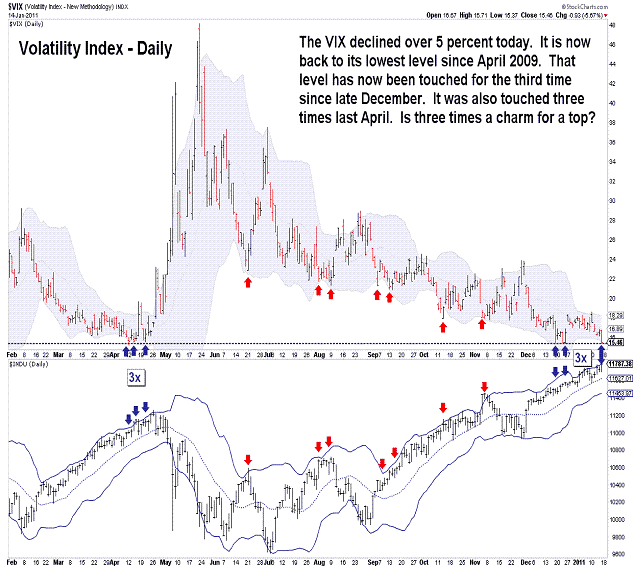
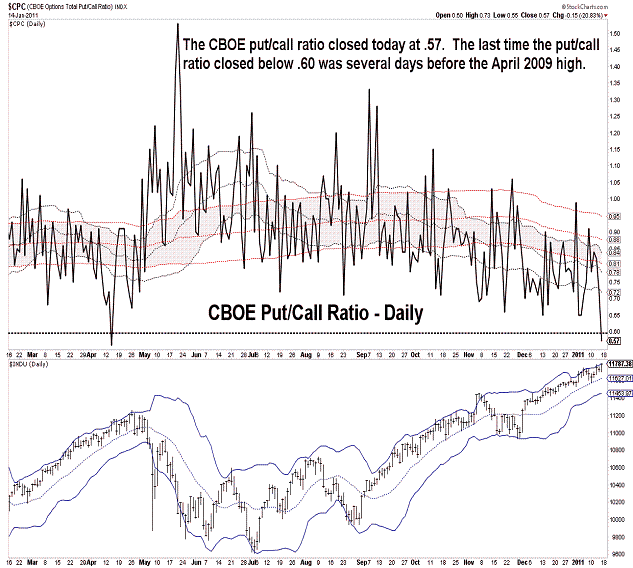
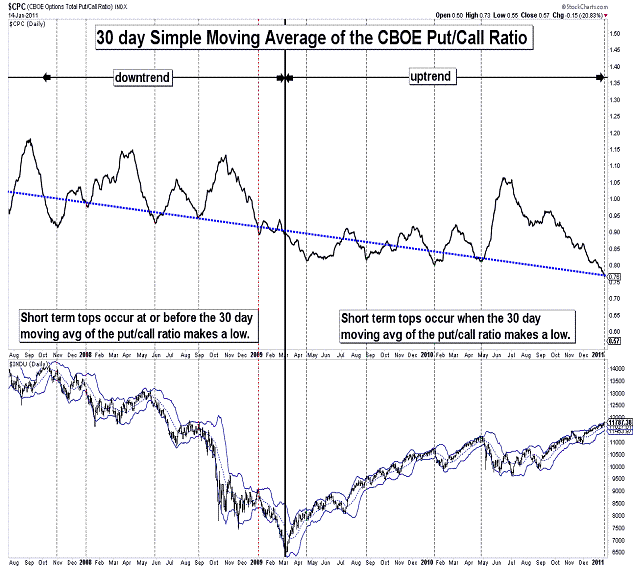
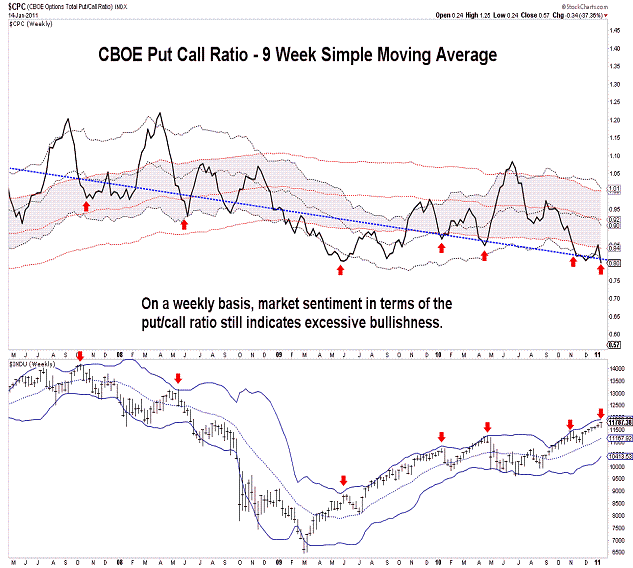
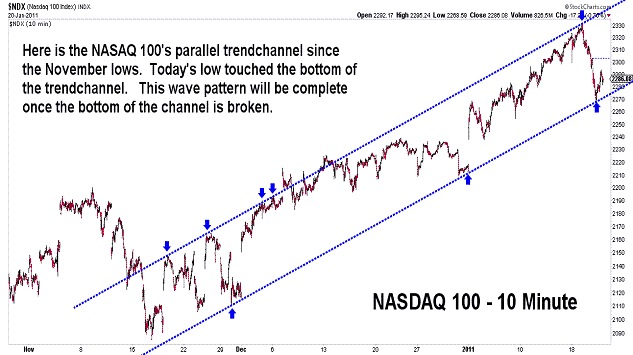
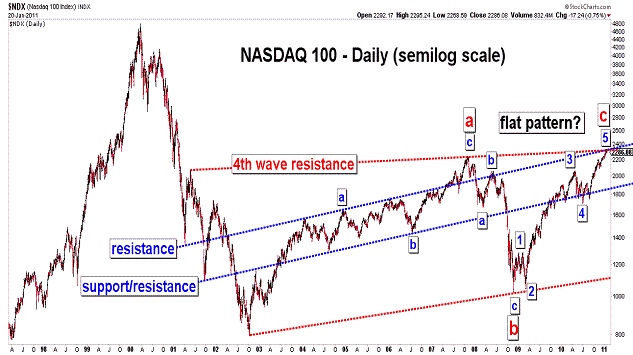
| January 15, 2011 update...At the close on Friday, the indices and indicators are stretched to the extreme. Something has to give...do we collapse from here...or do we "melt up" and then collapse. The CBOE closed on Friday at .57...a level not seen since last April. At that time, an important top was reached within days...the flash crash occurred shortly thereafter. Not only are the put call ratios at extremes, the VIX is testing an extreme low for the third time since late December...it did the same thing last April at that top. The pattern in the NASDAQ 100 looks like an ending diagonal triangle. If it is complete (or nearly so), a reversal will send the index down more than 100 points, possibly within a matter of days. I don't know what else to say. If patterns, trendlines and indicators no longer matter, then this market will continue to rise on its own momentum and bullish fantasy. But, the higher we go, the farther we fall. And next time the market starts to decline, it will continue for more than just a few months (like it did during the middle of last year). |
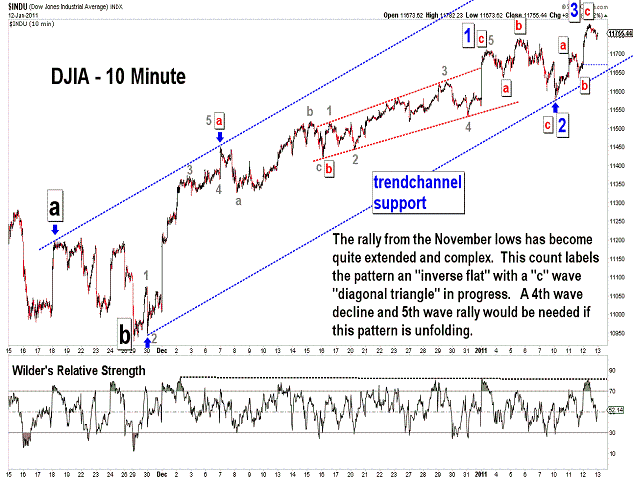

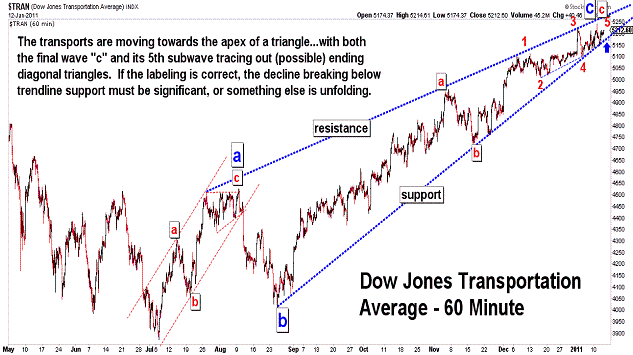
| January 12, 2011 update...My fear last Friday was that the mathematical price and time relationships in the DJIA were so perfect that they would fail...and today they did. That's why I said: "it seems that cycles always fail when their existence becomes this obvious." Other than that, nothing has really changed!!!! Despite the bad technicals, overly bullish sentiment, etc., the market continues to levitate. Going back to 2008, there is a line of horizontal resistance in the 11740 to 11782 area on a closing basis...and that is right where we are (11755). As I suggested in the first chart above, it is possible that the DJIA is currently tracing out an ending diagonal triangle pattern. If so, it still needs a 4th and 5th wave. There is another time cycle of consequence next Wednesday. We'll see if the DJIA can complete an ending pattern by then. |
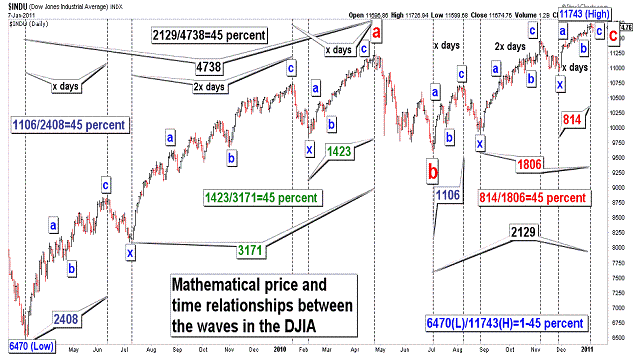
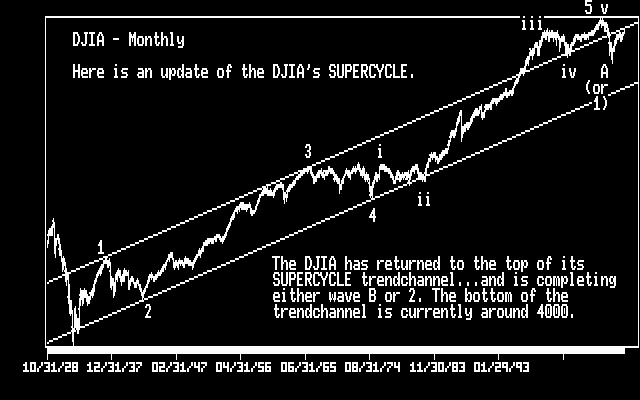
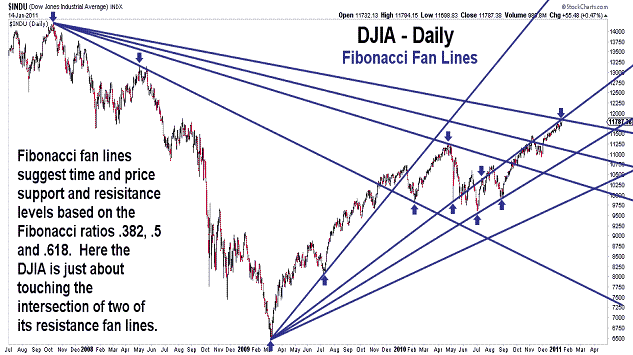
| January 7, 2011 update...In Tuesday's update, I indicated that there was important "Fibonacci resistance in the 11730-50 area...which also happens to be the area of an important high that occurred in January 2000". On Wednesday, the DJIA made an intraday high at 11742.68. While the DJIA closed the week only 68 points below that level, a top may now be in place. The charts I posted tonight show both mathematical resistance (see first chart above) and long term term trendchannel resistance (see second chart above) around this week's high. A more complex topping process is still possible in the coming days. But, a decline below 11530 IMO would probably confirm that an important top has been made. In terms of time, Wednesday's high on a closing basis was 25 days from the closing low on November 30th. If this holds, it would provide some nice symmetry with a previous rally wave, i.e., the rally from the July low to the August high...which was also 25 days. Interestingly, the other rally wave (from the August low to the November high on a closing basis) was 50 days...exactly twice the number of days of the other two. I almost hesitate to point this out because it seems that cycles always fail when their existence becomes this obvious. We'll see. |
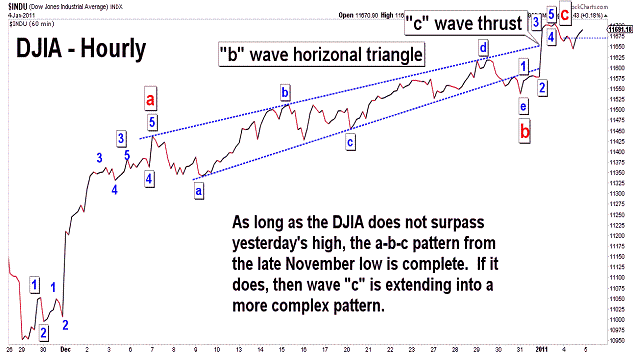
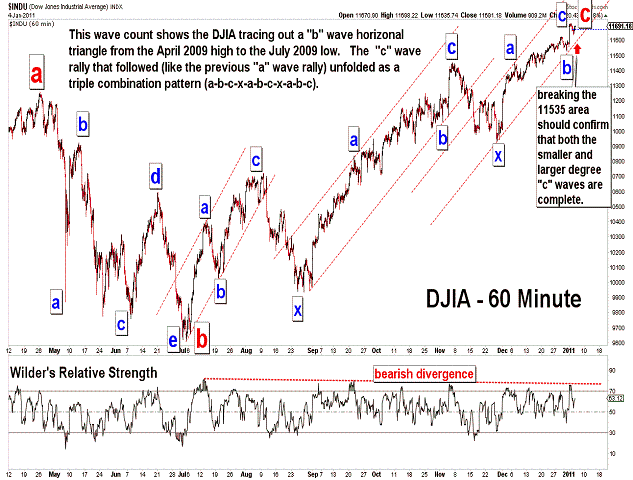
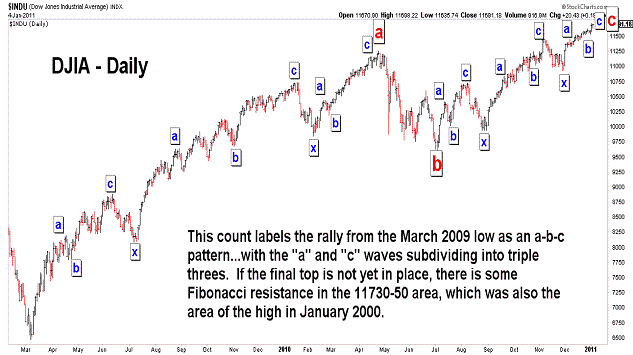
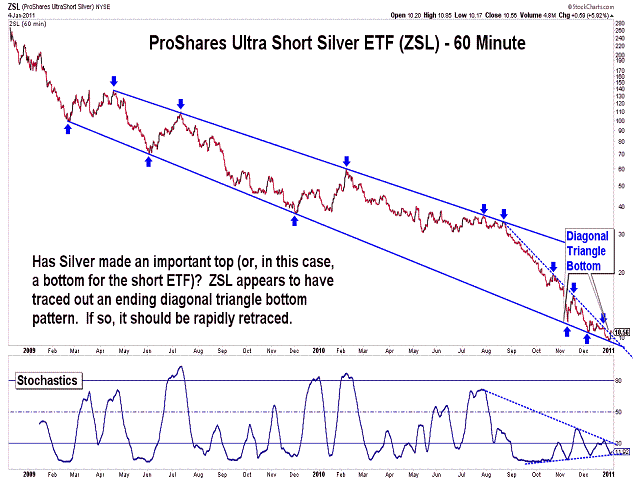
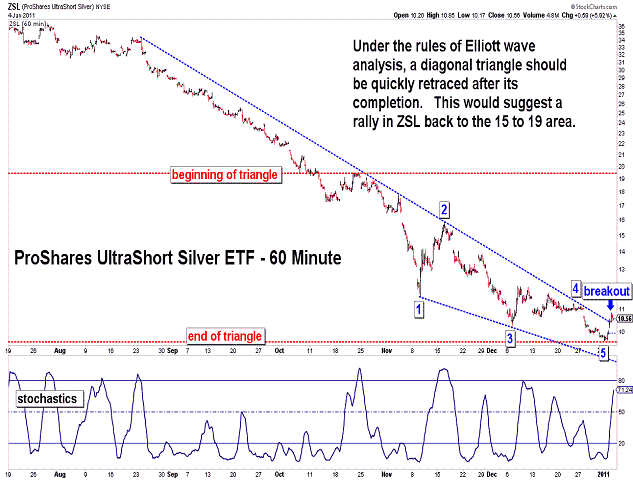
| January 4, 2011 update...Yesterday's high of 11711 is fairly close to some Fibonacci resistance in the 11730-50 area...which also happens to be the area of an important high that occurred in January 2000. When last Friday's low of 11530 is breached, we should get confirmation IMO that the a-b-c pattern from the March 2009 low is finally complete. The first three charts above show my short term, intermediate term and long term wave counts for that rally that began on March 6, 2009. I also posted two interesting charts of ZSL - ProFunds Ultrashort Silver ETF. If I analyzed the pattern correctly, it appears that Silver has completed an ending diagonal triangle pattern...and is ready for a major slide downward. Silver has been generally moving in the same direction as the stock market...so, we'll see if a decline in the metal carries over to stocks as well. |
Important: Information and chart access provided herein is limited to current subscribers only and shall not be forwarded or retransmitted without written authorization. It is educational in nature and shall not, directly or indirectly, be construed as investment advice. No guarantees are made with respect to the accuracy of the information, opinions, predictions,etc. offered here in. The username/password provided to a subscriber is unique and it is the sole responsibility of the subscriber to protect the confidentiality of said username/password and to further protect it from any unauthorized use.
Copyright © 1997 - 2013. The Elliott Wave Chart Blog. All rights reserved. Email
|