|
Charts
IMPORTANT: Chart buy/sell signals are helpful in determining market support and resistance levels...and probable turning points. However, they are only useful if the analyst has a handle on the larger trend. Experience and judgment play a vital role in that determination ...as does Elliott wave analysis.
If a chart does not not appear when you click on the link, you may need to (1) enable javascript, and/or (2) disable pop up blocking for this site, or (3) right click on your mouse and open the link in a new tab or window. Charts will generally appear when you use Internet Exploer or Firefox. Do not use Google Chrome to view charts.
Contact us at info@wavechart.com if you have a question or comment. |
|

Elliott Wave Chart Blog February 2010 Archive
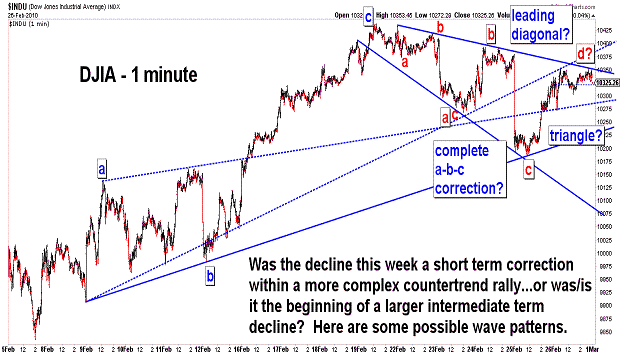
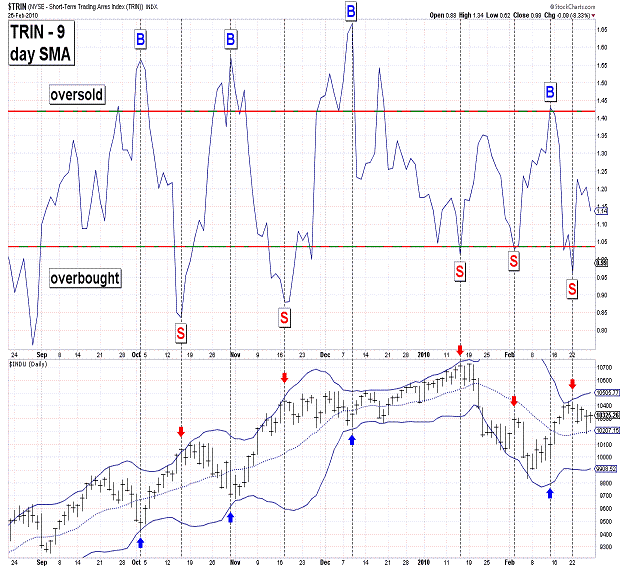
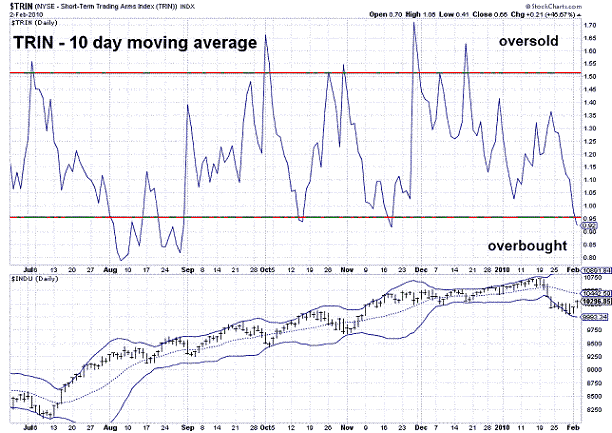
| February 26, 2010 update...The stock market declined this week...but, not very much. On Tuesday, I suggested that "...(i)f the market...holds in (the 10150-10250) area, move corrective action will likely follow." Yesterday, the DJIA declined to 10185...held...and today rallied back to the declining resistance line from last week's high. That line is now critical to the market's action next week. If the DJIA breaks through it on the upside, the countertrend rally from the February 5th low will continue to subdivide and unfold in a more complex manner. If the line holds, and the DJIA retreats below 10185, I can see two immediate wave count possibilities. The first is a triangle pattern if the DJIA declines (in three waves) to the area of its declining support line (from last week's high)...holds...and reverses sharply to the upside (a thrust). The second is a leading diagonal pattern that leads to an accelerated decline. This would be the next "a" wave of an unfolding double or triple three combination pattern (double: a-b-c-x-a-b-c, or triple: a-b-c-x-a-b-c-x-a-b-c). There may be alternate ways to count this pattern as well, including a "c" wave or "3rd" wave...but, that depends on the internal wave structure of the next pattern to the downside. Note in the last chart that the TRIN gave a sell signal at the recent high...and has not yet suggested that a reversal is imminent by giving a buy signal. |
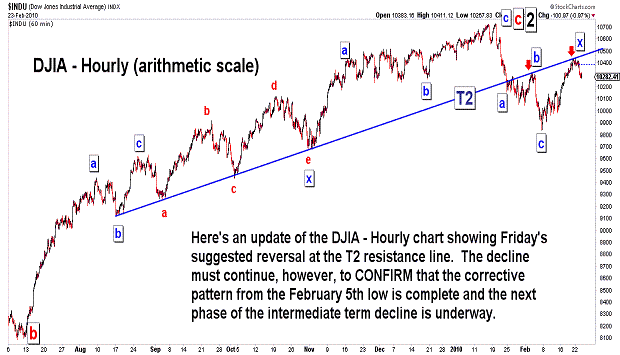
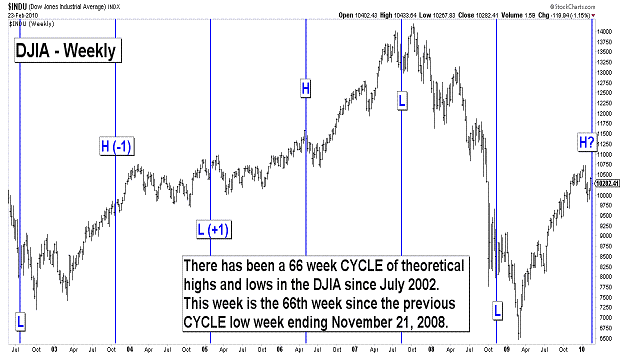
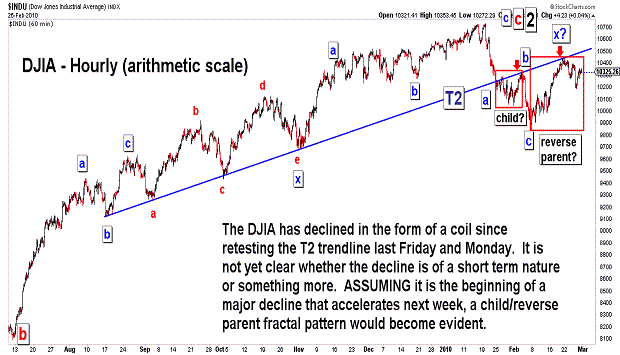
| February 23, 2010 update...On Friday I pointed out that the DJIA and other stock indices "had reached important resistance levels in terms of both trendlines and Bollinger bands." I suggested a reversal was likely...but, I was not sure if the reversal would be the beginning of the next phase of the intermediate term decline, or whether it would be just short term in nature. The decline did, in fact, begin yesterday...but it has not yet been large enough to clear up the intermediate term vs short term dilemma. If the 66 week CYCLE is still in effect (see chart above), there is a high probability that the current decline will be quite substantial. That CYCLE has worked since 2002...but, many other long term cycles have failed to work this year. So, I won't overemphasize its importance at this point. Sentiment is neutral right here...and not helpful. The action of the market itself should provide the best guidance. A quick decline below 10150-10250 would suggest to me that the next wave lower is underway. If the market instead holds in that area, move corrective action will likely follow. |
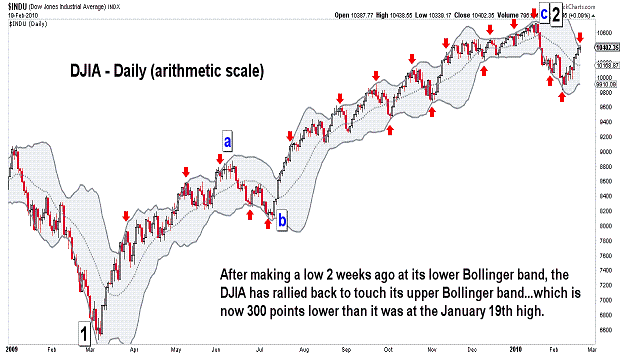
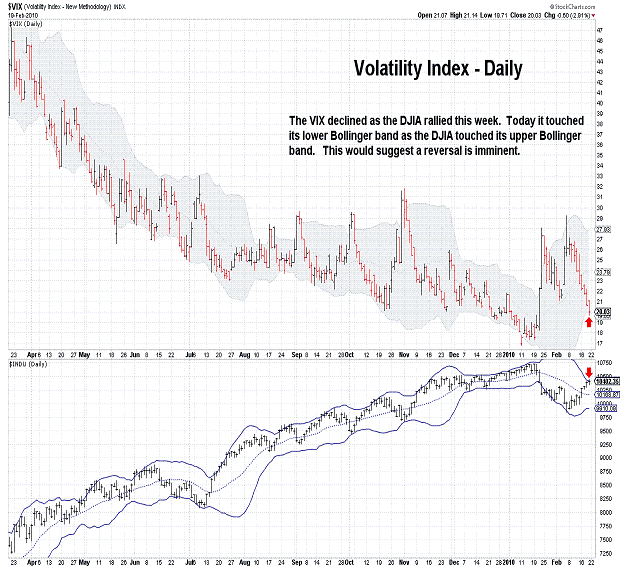
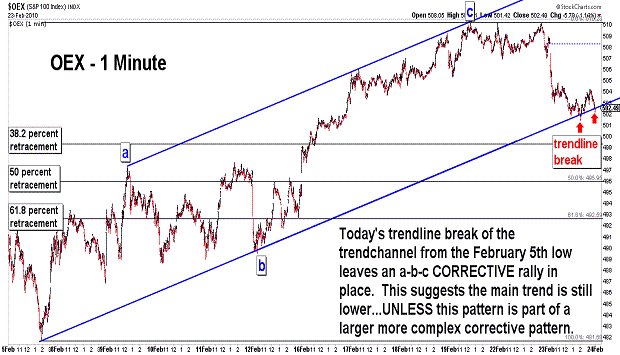
| February 19, 2010 update...In Tuesday's update, I indicated that a continuation of the rally would likely result in the DJIA testing the Fibonacci 61.8 percent retracement level of its decline from the January 19th high. It did...and today it closed about 14 points above that level. As you can see in the charts above, the DJIA (and other indices) today reached important resistance levels in terms of both trendlines and Bollinger bands. If I am right that the current rally was countertrend action to the decline that began at the January 19th high, then the market should reverse from here. If this countertrend action is, in fact, not complete...and requires further subdivisions and complexity, a short term decline back toward 10000 should follow, at the very least. We'll see. |
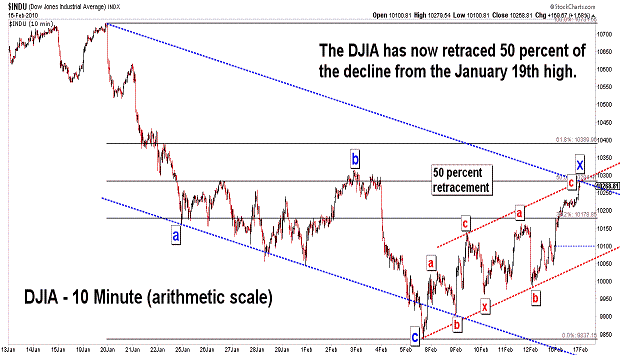
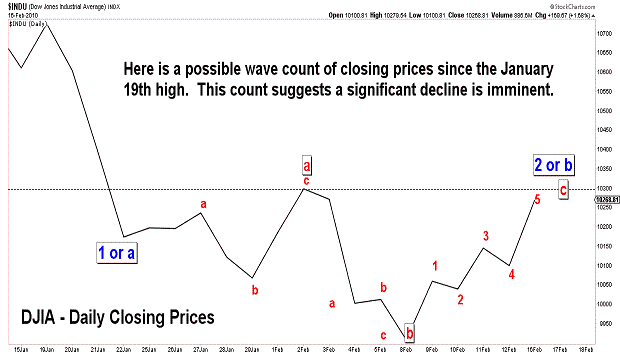
| February 16, 2010 update...Today's strong rally took the DJIA to the 50 percent retracement point of the decline from the January 19th high. On the intraday charts, the pattern from the February 5th low looks like a a double three combination pattern (a-b-c-x-a-b-c) (an "x" wave). On the daily closing chart, it looks like a five wave "c" wave pattern (the final part of a 3-3-5 flat pattern). In either case, if the rally is complete, a signficant decline is next. Should the rally continue, however, a test of the Fibonacci 61.8 percent retracement level at 10388 would become likely. |
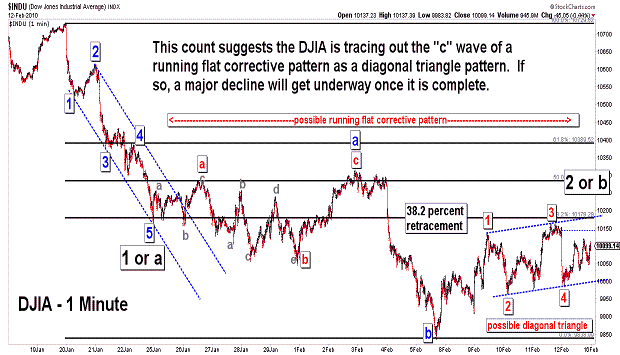
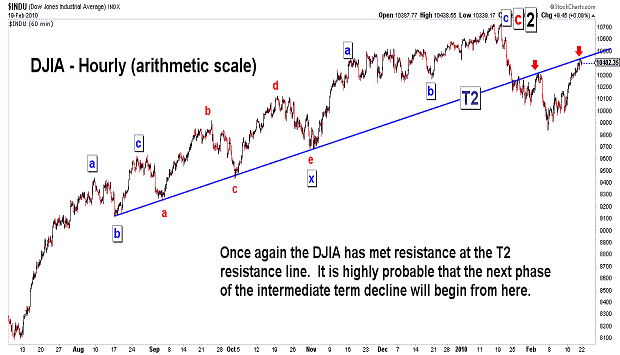
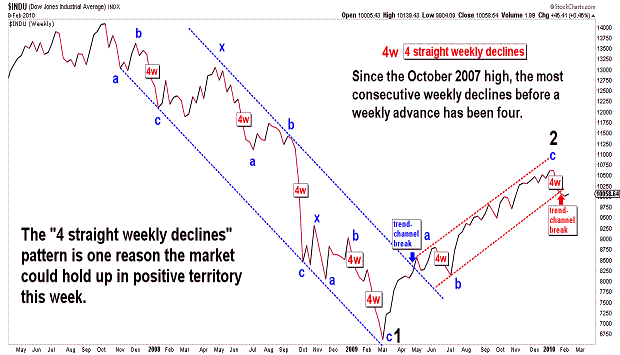
| February 12, 2010 update...On Tuesday, I posted a weekly chart of the DJIA showing a four week pattern of declines that has unfolded since the October 2007 high. The pattern suggested the likelyhood of a higher close for the DJIA this week...and that is exactly what occurred. The DJIA gained almost 1 percent for the week. As I currently see it, the DJIA has been tracing out a running flat corrective pattern since the end of January. If this wave count is correct, the final wave of the pattern (a possible diagonal triangle "c" wave) appears to be nearly complete. Once complete, the next phase of the current intermediate term decline should begin...and it should be much stronger (pricewise) and longer (timewise) than the initial decline from the January 19th top. It has been several months since I last posted the DJIA's long term chart. As you can see, the January high occurred right at the top of an important trendchannel dating back to 1932. If the DJIA now declines to the bottom of the trendchannel, all of the gains since 1995 will be erased! We'll see. |
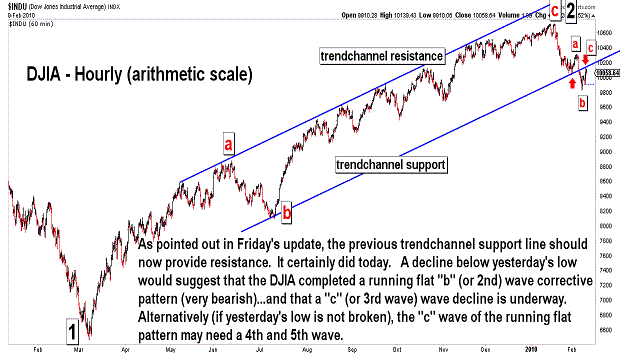
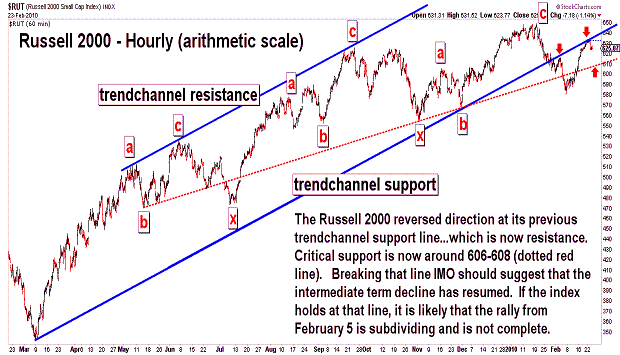
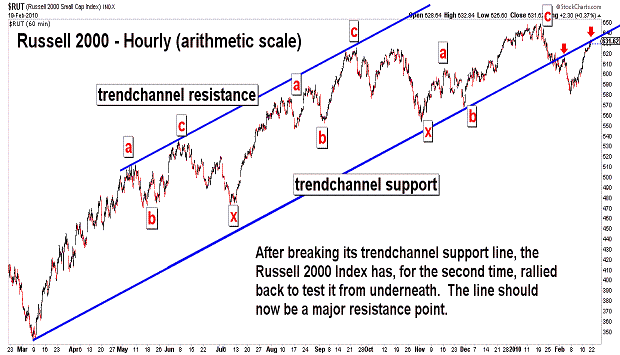
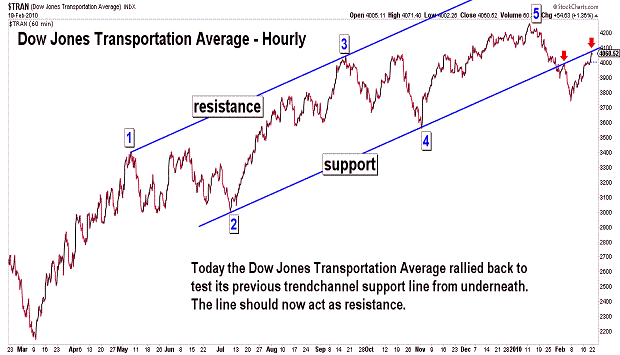
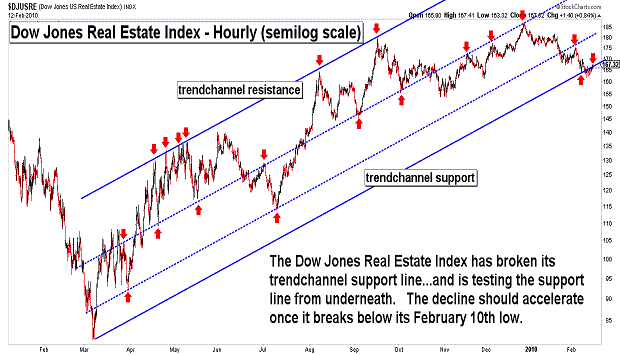
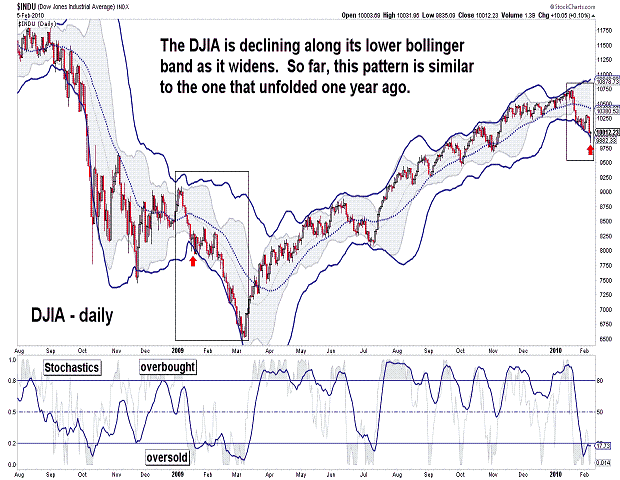
| February 9, 2010 update...On Friday, I suggested that the DJIA could be tracing out a "running flat" corrective pattern before the next phase of the current intermediate term decline begins. As part of the pattern, I said "...(i)deally, the DJIA will close lower on Monday and form an a-b-c pattern on a closing basis." It did. Today's rally was part of the "c" wave rally of the "running flat" pattern and took the DJIA back to test its previous trendchannel support line (see first chart above). Yesterday's low is now the key. If the DJIA breaks that level the "running flat" can be counted as complete...and a signficant decline will be underway. If that level is not broken, the "c" wave of the "running flat" is still unfolding...with a possible 4th and 5th wave yet to come. One reason to believe that this latter outcome is likely is the probability that this week as a whole will turn out to be a net positive for the DJIA (see second chart above). We'll see. |
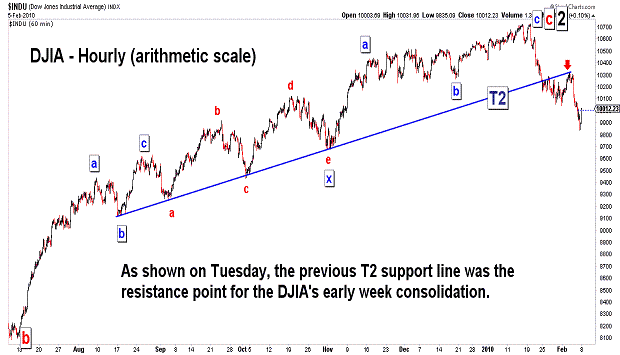
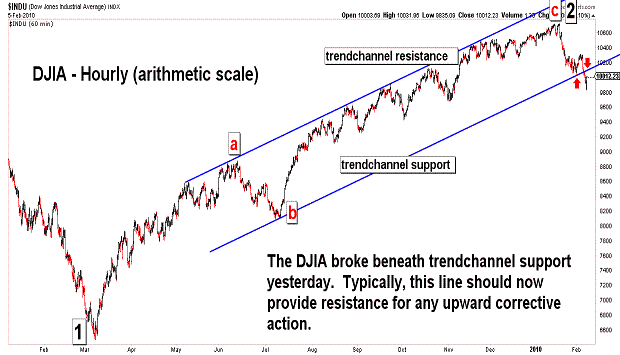
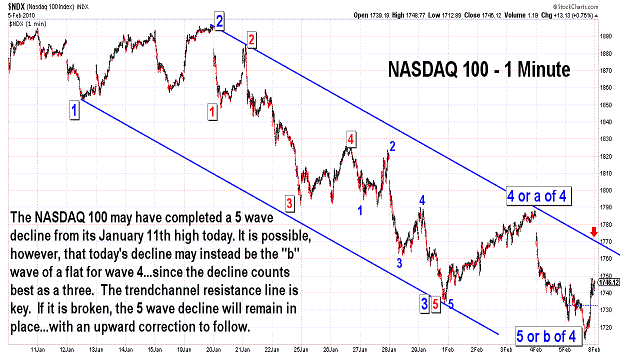
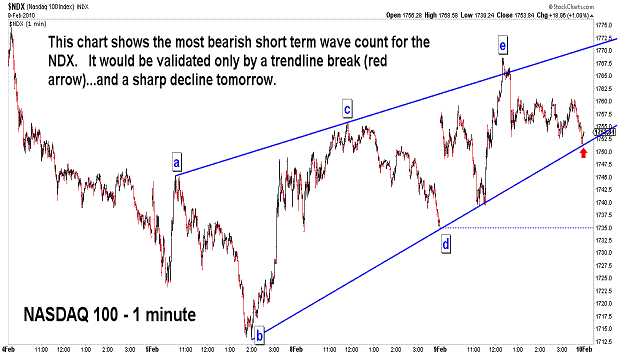
| February 5, 2010 update...For the week, the DJIA was down about 1/2 percent. Other stock indices were slightly higher or lower than that. Overall, it was a consolidation week with a downward bias, i.e., a higher Monday and Tuesday, then a lower Wednesday through mid afternoon today, with a final 2 hour pop. A case can be made that a 5 wave decline was completed today (see NDX chart)...with an upward corrective pattern to follow next week. However, it appears to me that the decline from Tuesday's high (Wednesday in the NDX) counts best as three waves, i.e., a "b" wave. This would suggest that a larger corrective pattern is underway from last week...and that a "c" wave rally has now begun which should, in the case of the DJIA, take it back for a retest of its previous trendchannel support line (see second DJIA chart above). (Ideally, the DJIA will close lower on Monday and form an a-b-c pattern on a closing basis...but this is not necessary.) Once the correction (a possible running flat pattern in the DJIA) is complete, the next phase of the current intermediate term decline should begin. |
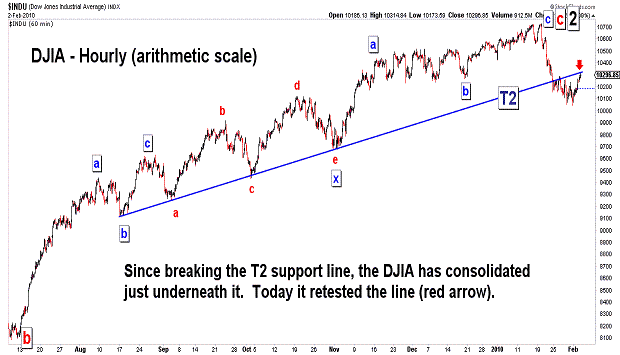
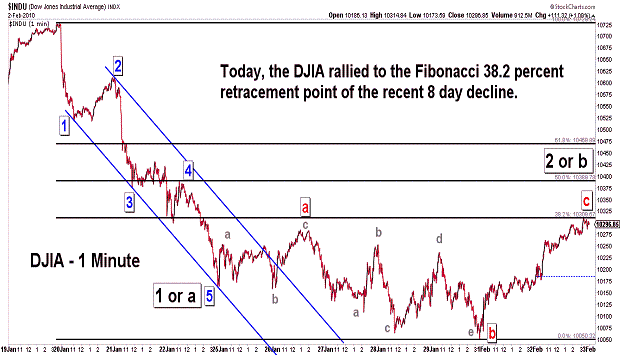
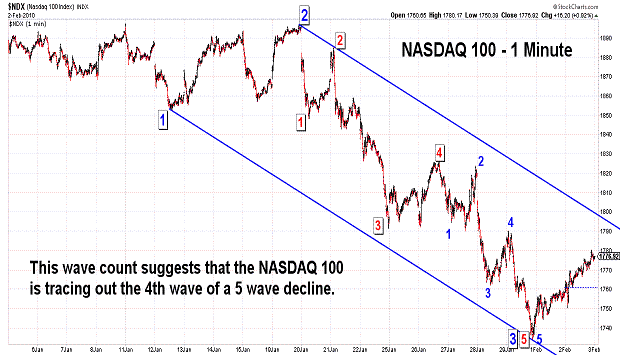
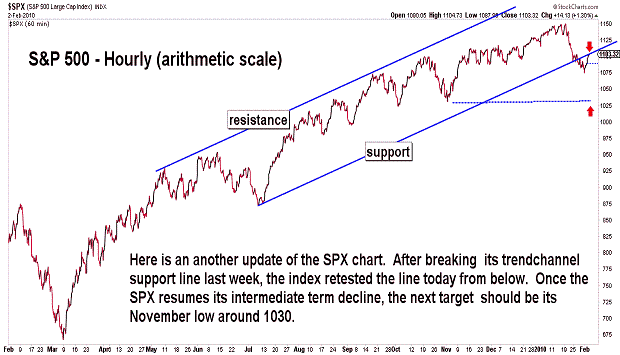
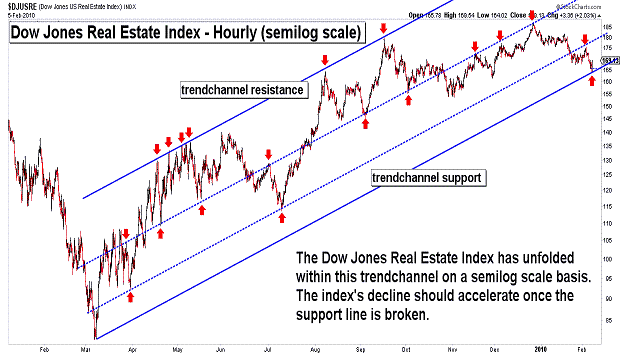
| February 2, 2010 update...On Friday, I suggested that there was a strengthing "case for a short term bounce or consolidation". I thought the "clearest case (could) be seen in the...NDX chart which show(ed) the index (potentially) in a 5th of a 5th wave (of 3) from the January 19th high." And so, a 4th wave (one possible count in the NDX) consolidation has unfolded so far this week. Today's rally in the DJIA took it to the Fibonacci 38.2 percent retracement point of the recent decline...which is one possible stopping point for the rally. While the indices are approaching a short term overbought condition, further consolidation is still possible. Given that some indices (see DJIA and SPX charts above) are retesting previously broken support lines...which should now provide resistance...it is likely that a continuation of the current consolidation pattern (if it does occur) would be more sideways in terms of price action than higher. We'll see. |
Important: Information and chart access provided herein is educational in nature and shall not, directly or indirectly, be construed as investment advice. No guarantees are made with respect to the accuracy of the information, opinions, predictions, etc. offered herein.
Copyright © 1997 - 2012. The Elliott Wave Chart Blog. All rights reserved. Email
|