|
Charts
IMPORTANT: Chart buy/sell signals are helpful in determining market support and resistance levels...and probable turning points. However, they are only useful if the analyst has a handle on the larger trend. Experience and judgment play a vital role in that determination ...as does Elliott wave analysis.
If a chart does not not appear when you click on the link, you may need to (1) enable javascript, and/or (2) disable pop up blocking for this site, or (3) right click on your mouse and open the link in a new tab or window. Charts will generally appear when you use Internet Exploer or Firefox. Do not use Google Chrome to view charts.
Contact us at info@wavechart.com if you have a question or comment. |
|

Elliott Wave Chart Blog February 2011 Archive
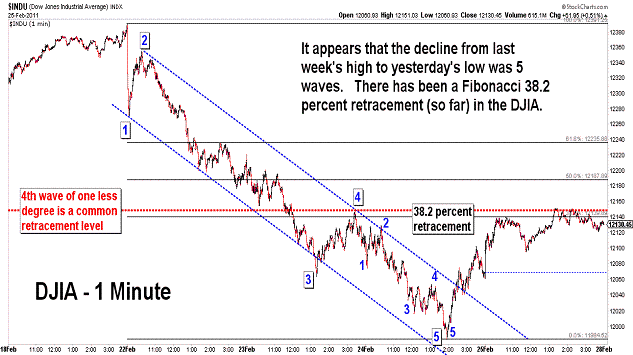
| February 25, 2011 update...The market declined about 2 percent for the week...and, if my "b" wave triangle wave count is correct, it should be the start of a decline that lasts through next year. It is still possible in the coming days that some of the indices may attempt to retest and even (slightly) exceed their recent highs before the entire market gets in sync on the downside. But, at this point, I think the DJIA has made its high for the year. The DJIA's rally today lagged most of the other indices...ending the week with a Fibonacci 38.2 retracement of its decline from intraday high to low. Assuming a top is in place, any rally next week will have to be part of a corrective wave pattern. The coming weeks and months could finally be pleasing for the bears. We'll see. |
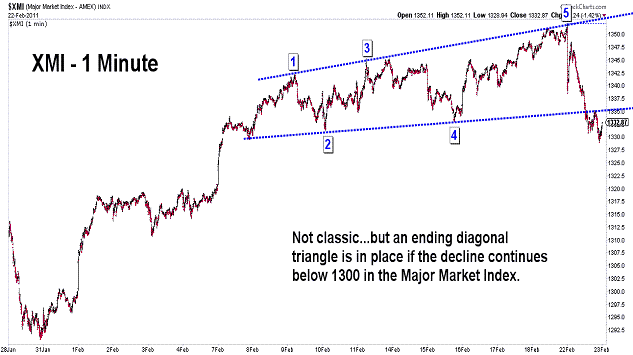
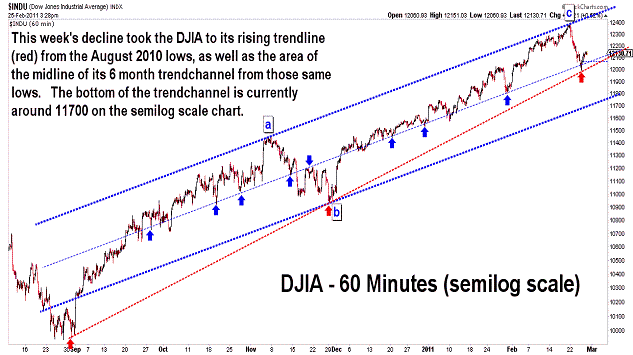
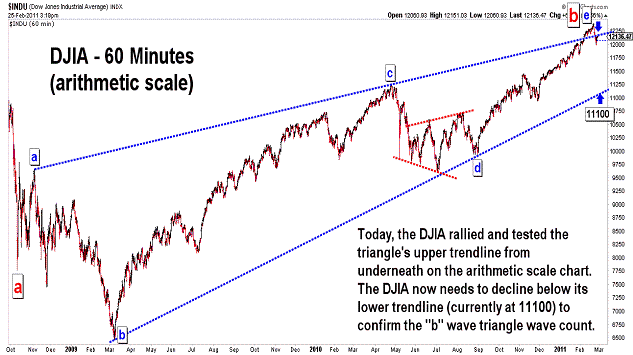
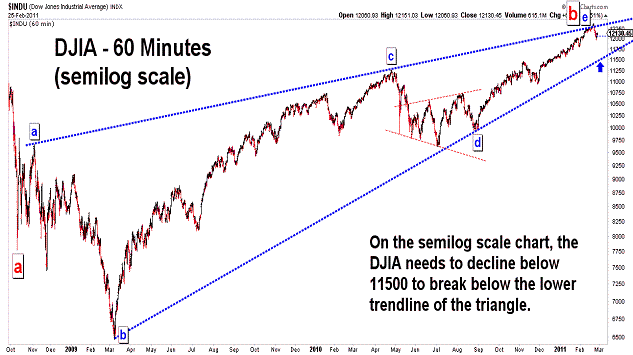
| February 22, 2011 update...It's another holiday shortened week, but the market is off to a good start if my horizontal triangle pattern wave count is correct. On Friday I said: "A reversal next week below the (upper) trendline...and a further decline below the triangle's lower trendline should follow IF the count is valid." Well, the DJIA certainly took the first step today by reversing below the upper trendline. The next step is a continuation of the decline in the coming weeks...that will take the average below 11500, i.e., the current level of the triangle's lower trendline. |
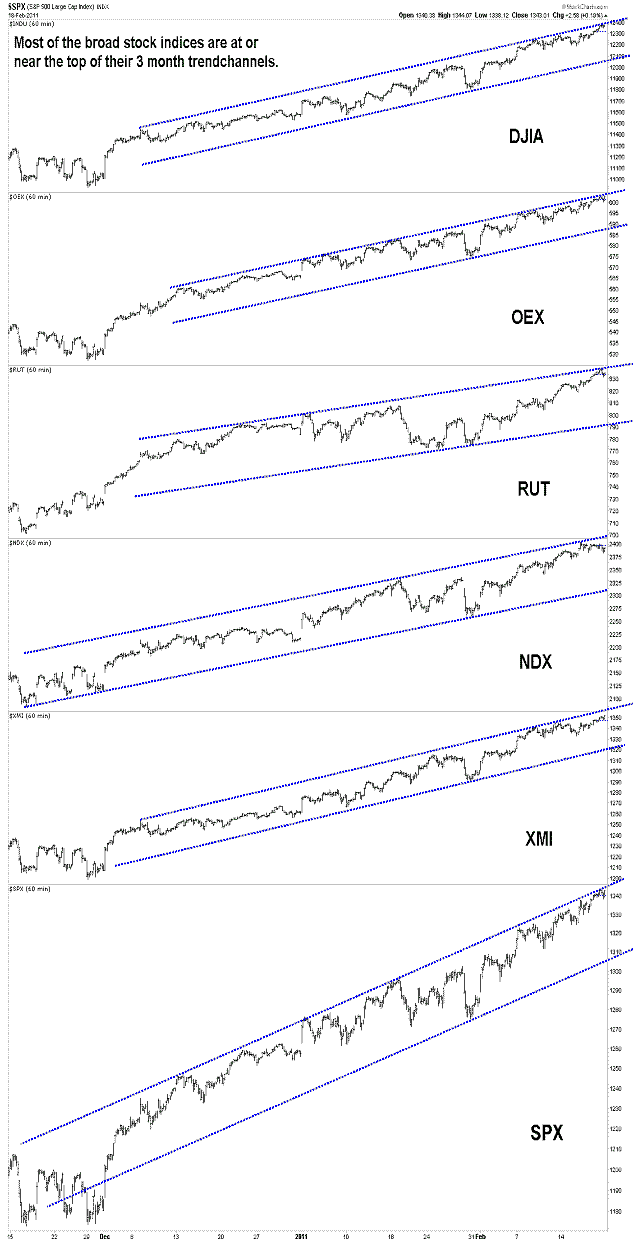
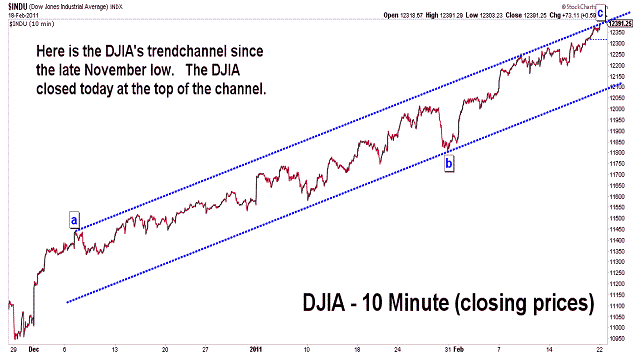
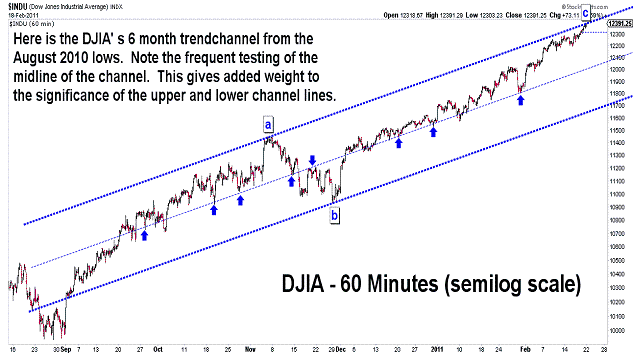
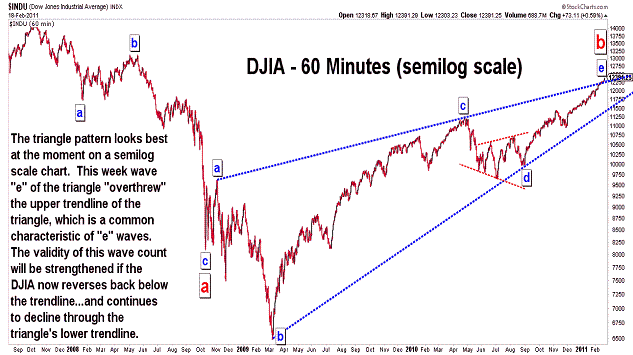
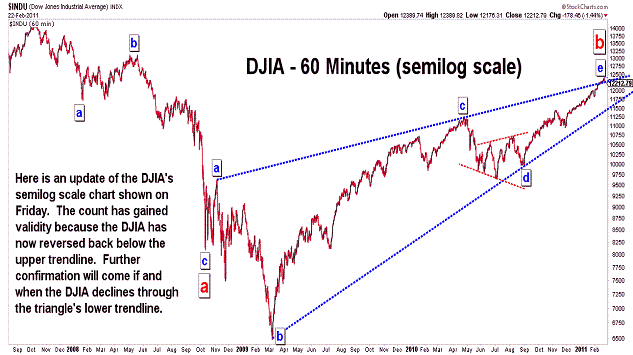
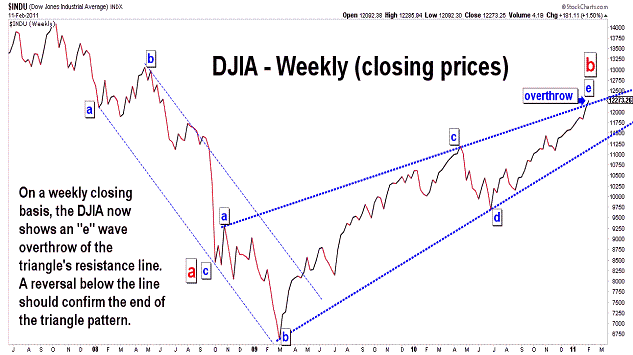
| February 18, 2011 update...With the market on the brink of testing its 34 week Fibonacci cycle and reversing the sequence of lows (see last update), the stock indices are at or near the tops of their 3 month and 6 month trendchannels. With this week's rally, wave "e" of the "b" wave triangle that I have been analyzing now shows a slight "overthrow" of the triangle's upper trendline on a semilog scale basis. A reversal next week below the trendline...and a further decline below the triangle's lower trendline should follow IF the count is valid. |
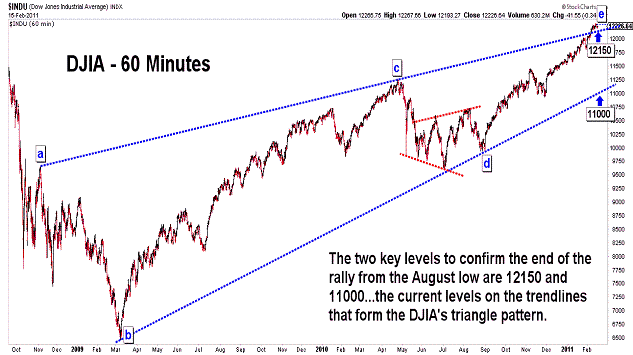
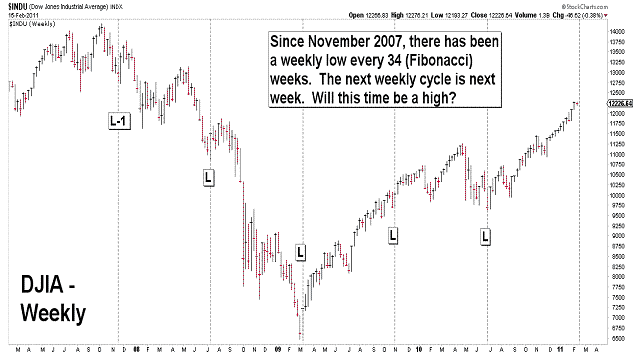
| February 15, 2011 update...The market is not doing very much this week...other than not (for a change) going up. The first indication of a possible top and reversal will occur when there is a decline below 12150...that is the current level of the upper trendline in the DJIA's triangle pattern. The lower trendline is much lower at 11000...and we should certainly know before then that a top is in place. On a weekly basis, there has been a reoccuring low every 34 weeks since November of 2007. The next 34 week period ends next week...but, the market is currently closer to a high than a low. Will this time turn out to be a cycle high? We'll see. |
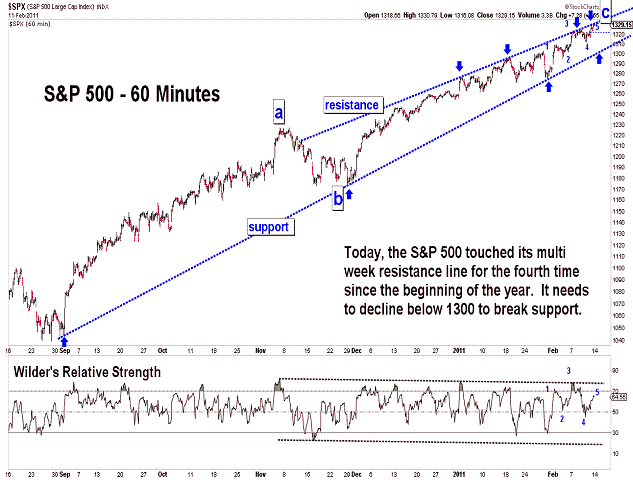
| February 11, 2011 update...There is not much to add to the last update. The indicators continue to diverge in the face of higher prices in the indices. But, there has not yet been the type of volatile decline that would suggest a top is in place. A five wave advance can now be counted from the January 28th low. Once it is complete, a decline should follow...at the very least to the support line of the "e" wave trendchannel (see S&P 500 chart). |
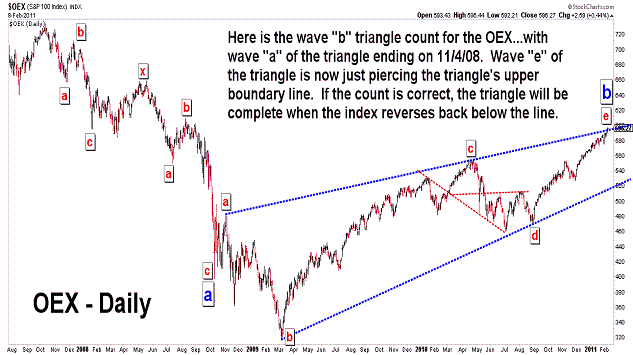
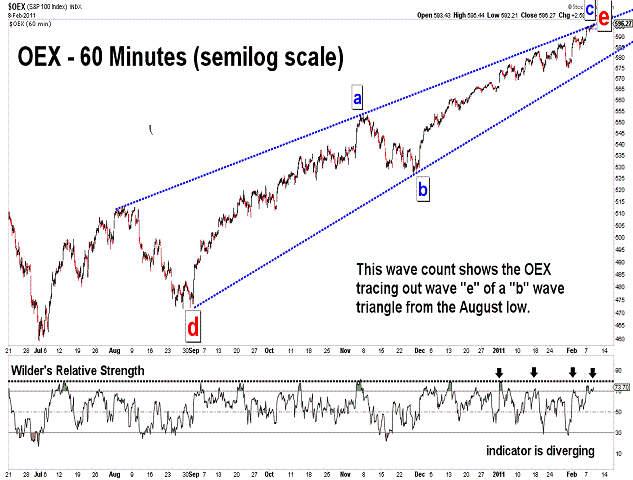
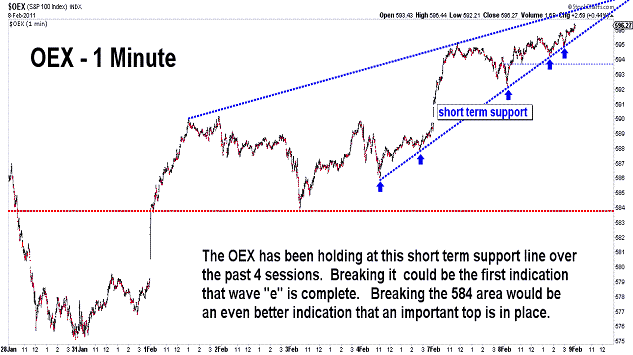
| February 8, 2011 update...The OEX index is used here to illustrate the triangle wave count that I see in a number of the major stock indices, including the DJIA. If the count is valid, the final wave of the triangle should end soon...from near current levels. The clearest indication will come when the market reverses and volatility measurements increase dramatically on the downside. Until then, minor upward subdivisions, like we have seen this week, can continue. Should the market gather more power and accelerate upward, this count will be negated. Should that happen, it would do so in the face of market indicators that in the past I have always seen lead to a major decline. I had been skeptical that the market was strong enough to propel it to its current lofty levels...but, it has...and now a test of my wave count is clearly in the making. |
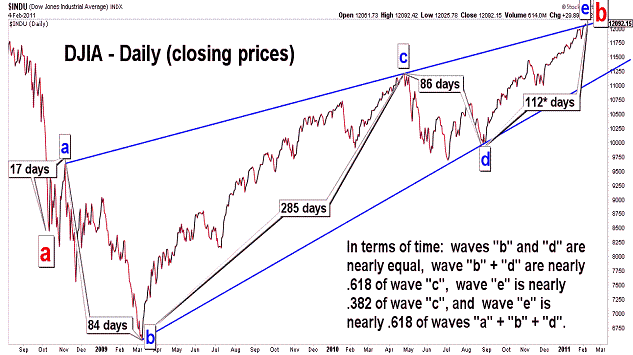
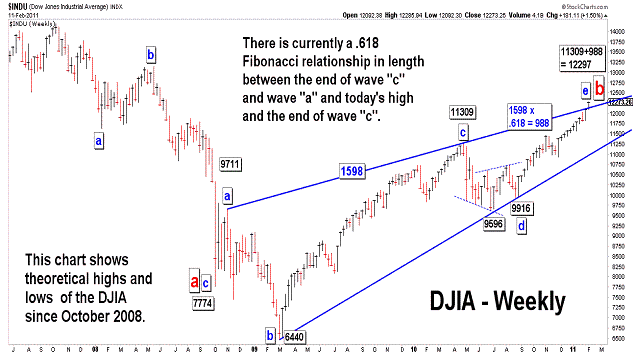
| February 5, 2011 update...With the notable exception of the small caps, i.e. Russell 2000, most indices snapped back from last week's decline and made new highs this week. The rally from the August lows has all of the characteristics of the "e" wave of triangle, as counted in the DJIA chart above. The "e" wave has been a relentless advance in the DJIA as it has sought...and now reached the triangle's upper border line. From a pattern perspective, a reversal should be near. Also, from a price perspective and time perspective, this coming week would be a perfect point for a reversal IF the triangle count is correct. Assuming the count is correct, a wave "c" decline will follow that should take the market lower for the next year or so...in similar fashion to the "a" wave that unfolded during 2007 and 2008. |
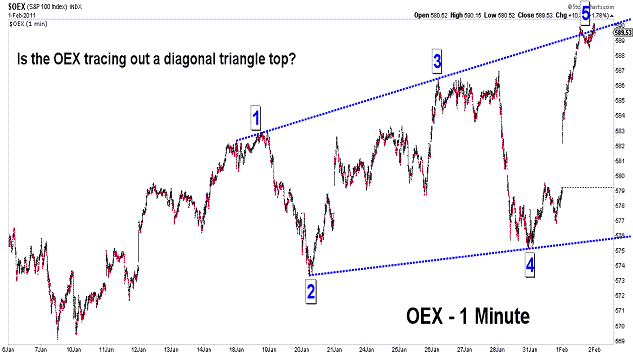
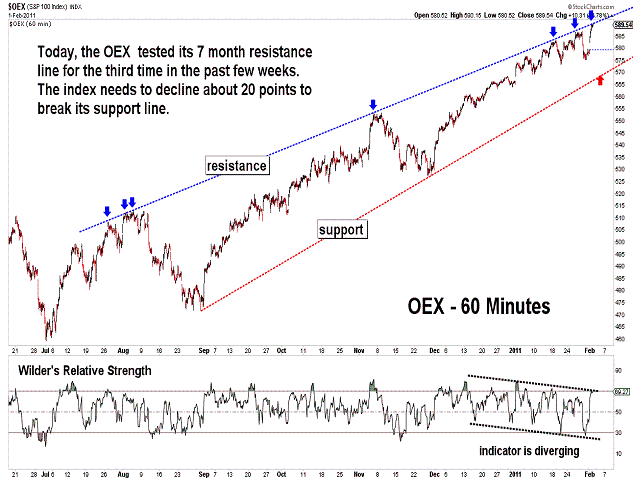
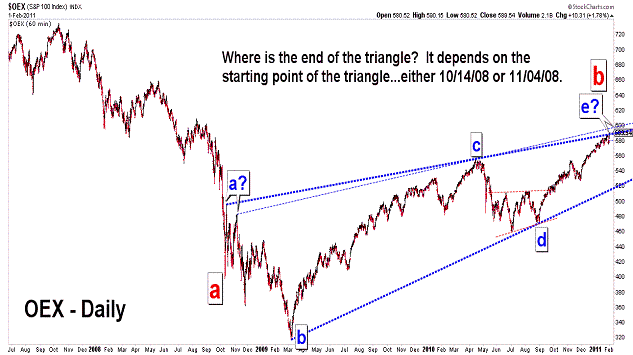
| February 1, 2011 update...Back to square one. Today's rally above last week's highs negated Friday's reversal. As you can see in the OEX charts above, a diagonal triangle top may be nearing completion. It requires a sharp reversal in the next day or two from near current levels...or it too will be negated. On an intermediate term basis, each rally in the OEX has terminated at its seven month resistance line. That is right where it stopped today. Now, the question remains, regarding my triangle count, whether wave "a" of the pattern ended on October 14, 2008 or November 4, 2008. The earlier date suggests the triangle is ending now...the later date allows for the market to move slightly higher before a final top. We'll see. |
Important: Information and chart access provided herein is limited to current subscribers only and shall not be forwarded or retransmitted without written authorization. It is educational in nature and shall not, directly or indirectly, be construed as investment advice. No guarantees are made with respect to the accuracy of the information, opinions, predictions,etc. offered here in. The username/password provided to a subscriber is unique and it is the sole responsibility of the subscriber to protect the confidentiality of said username/password and to further protect it from any unauthorized use.
Copyright © 1997 - 2013. The Elliott Wave Chart Blog. All rights reserved. Email
|