|
Charts
IMPORTANT: Chart buy/sell signals are helpful in determining market support and resistance levels...and probable turning points. However, they are only useful if the analyst has a handle on the larger trend. Experience and judgment play a vital role in that determination ...as does Elliott wave analysis.
If a chart does not not appear when you click on the link, you may need to (1) enable javascript, and/or (2) disable pop up blocking for this site, or (3) right click on your mouse and open the link in a new tab or window. Charts will generally appear when you use Internet Exploer or Firefox. Do not use Google Chrome to view charts.
Contact us at info@wavechart.com if you have a question or comment. |
|

Elliott Wave Chart Blog March 2010 Archive
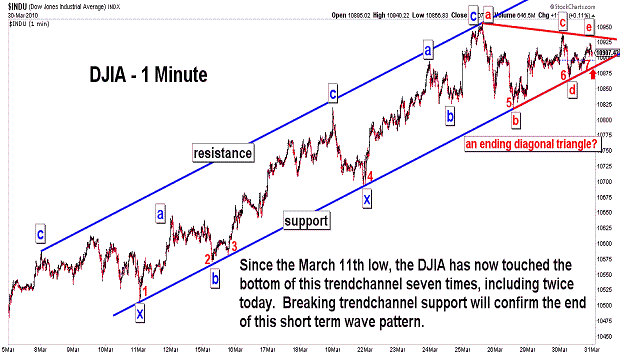
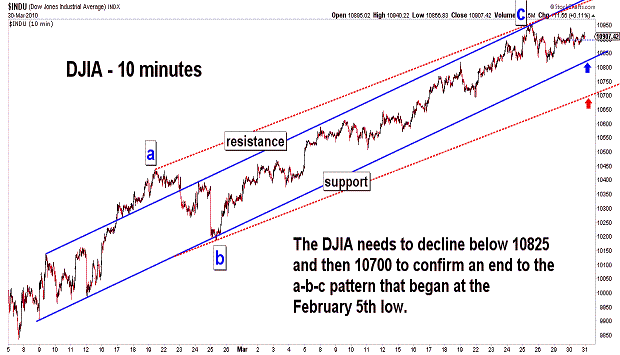
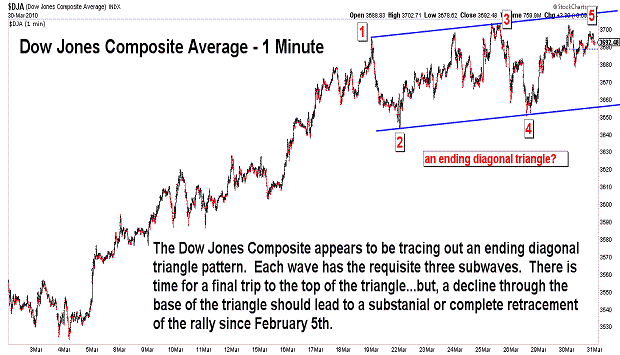
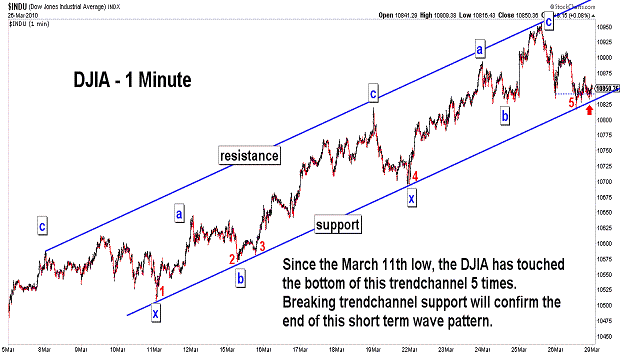
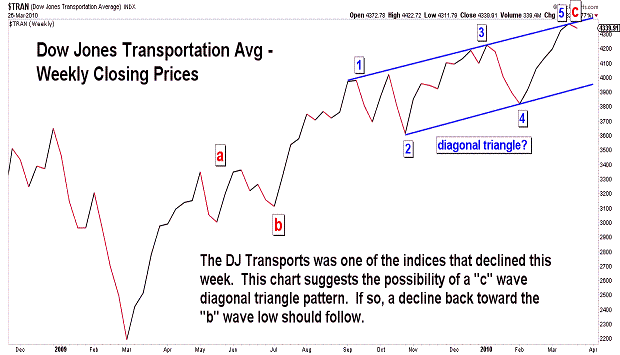
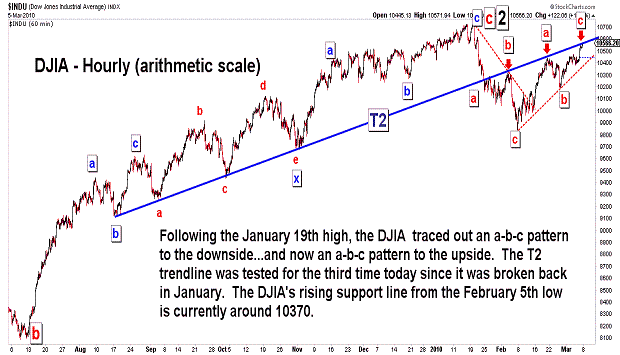
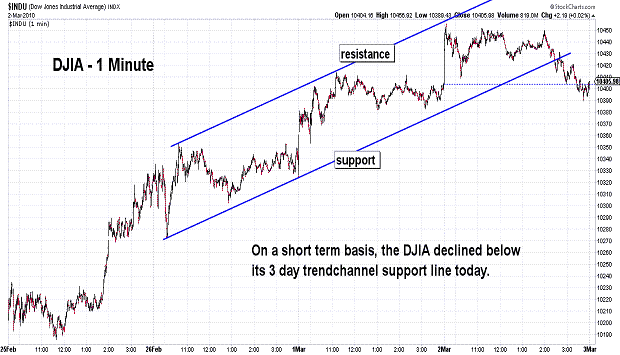
| March 30, 2010 update...There is little to add to Friday's comments. The stock market indices have moved in very narrow ranges so far this week. The DJIA has bounced several times at the bottom of its short term trendchannel (see first chart)...but, has failed to rally above last Thursday's intraday high at 10955. Several indices, like the Dow Jones Composite Average (see third chart), appear to be tracing out ending diagonal triangle pattens. If that interpretation is correct, there should be a resolution of it within the next day or two...which should lead to a signficant, if not complete, retracement of the rally since February 5th. The other possibility I see is a continuation of the topping process with a larger ending diagonal triangle pattern still unfolding. We'll see. |
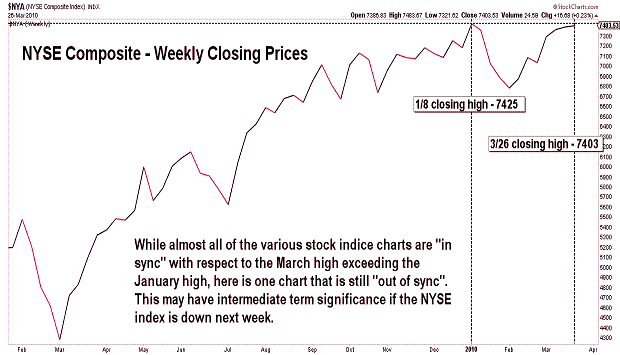
| March 26, 2010 update...On a very long term basis, this week's rally took the DJIA back to the top of a multi-decade trendchannel. IF the DJIA is tracing out a SUPERCYCLE degree Bear Market, an important top should now be forming. That top could develop in the form of a diagonal triangle pattern...in similar fashion to the "drawn out" tops that occurred last June and January. The market's action over the next few days should provide the best clue. Anything short of an immediate powerful impulse to the downside would suggest (to me) that the DJIA is likely tracing out a complex diagonal triangle top. One interesting sign of a topping pattern can be seen in the NYSE Composite Index. While most indices rallied to new intraday highs yesterday, the NYA failed to exceed its March 17th high. Also, the weekly NYA chart of closing prices has yet to exceed its January high (see fourth chart above). This is the only instance I can find of a failure to make a new high this month among the various broad stock indices. |
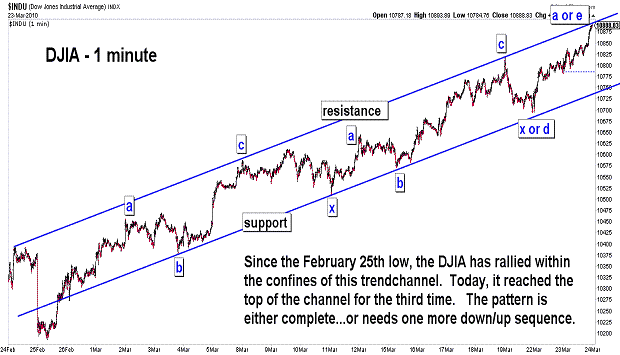
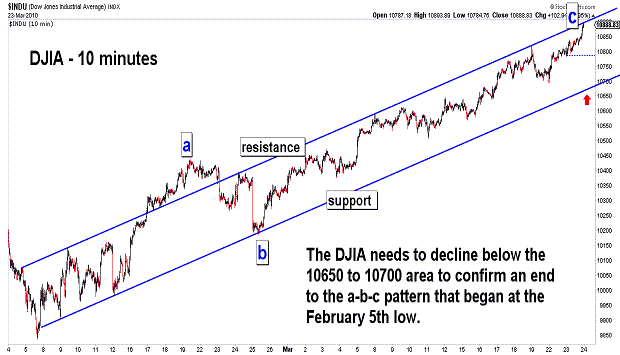
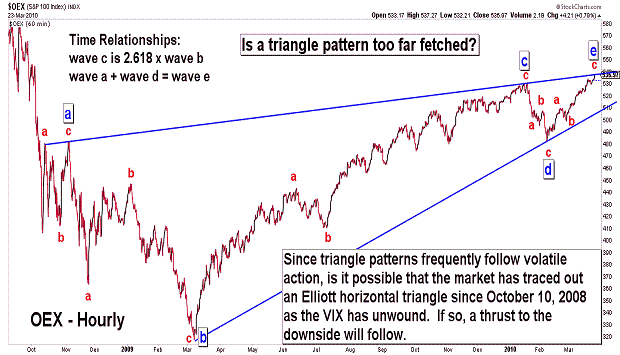
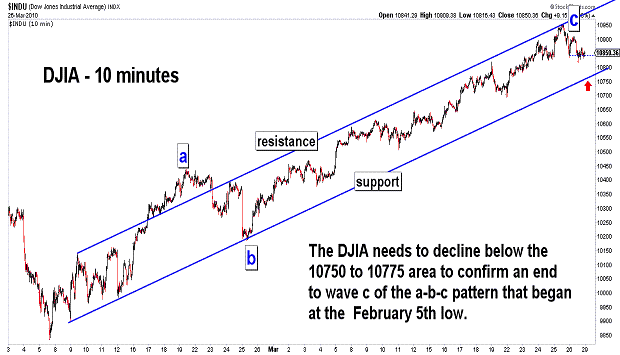
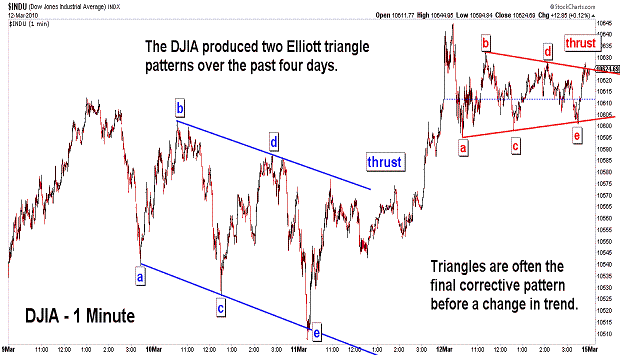
| March 22, 2010 update...As you can see in the first two charts above, the DJIA spent the first two days of this week climbing higher within its narrow rising trendchannel. At the close today, it reached the top of that trendchannel. A pullback (or pause at the least) is likely over the next day or two. I think a final top for the pattern would look best with the formation of a diagonal triangle. A trip back to the bottom of the trendchannel would be the most likely first step in getting the pattern started. I find the strength of the market this week surprising given the excessively bullish sentiment (see fourth chart) and very overbought technical condition. But, this type of action does occur near important turning points...when the market goes beyond one's rational expectations. Like a stretched rubber band, the market at some point does snap back. And belive it or not, there is one Elliott wave pattern that provides this very action, i.e., a thrust. The third chart illustrates what may be a far fetched view of the OEX's pattern since October 10, 2008...an Elliott horizontal triangle. Although a few of the waves are small relative to the others, each of them does subdivide into a requisite three wave corrective pattern. At the conclusion of the triangle pattern, there is a thrust equal to the width of the triangle in the opposite direction (down in this case). Anything other than this would invalidate the triangle analysis. We'll see. |
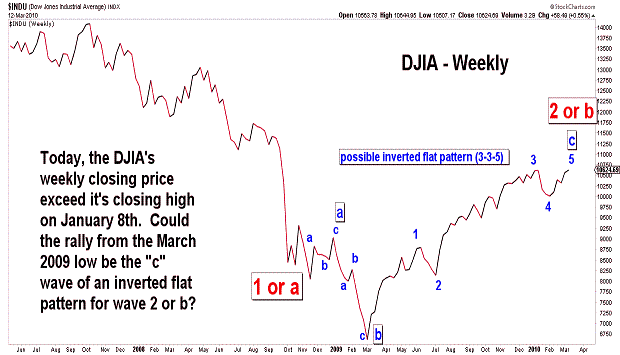
March 19, 2010 update...4 days UP in the DJIA this week...1 day DOWN. Today's key reversal day finally ended the DJIA' s eight day winning streak...but, it hardly made a dent in the chart's overbought condition. Wednesday's rally to a new recovery intraday high (as well as closing high) did allow the charts to once again "synch up" as I discussed last Friday. That situation, however, left many Elliott wave analysts, including myself, with an apparent wave count dilemma. The DJIA (and some other indices) now seem to have charts with 5 wave advancing patterns from the March 2009 low. This would seem to be at odds with the view that the rally from last year's lows was corrective in nature. Let me explain why it is not! Clearly, each of the rally subwaves since March 2009 has produced an Elliott wave corrective pattern, i.e., my count suggests that they were double three combination patterns (a-b-c-x-a-b-c). The easiest way to correct the apparent problem is to label the rally from March 2009 as the "c" wave of an "inverted flat" that began October 10, 2008. I think that this is not only a valid count, but a likely count as well. Whether or not it is, in fact, the correct count will depend on the market's action in the coming months. All the Elliott wave and technical factors that I look at are extremely bearish...and that is certainly consistent with the ramifications of an "inverted flat" wave count (extremely bearish).
The stock averages actually gained less this week than it seemed. In fact, one index - the Russell 2000 - lost ground. So, was today THE top or, possibly, the beginning of a top? Too early to say, but the signs of an important top continue to accumulate. |
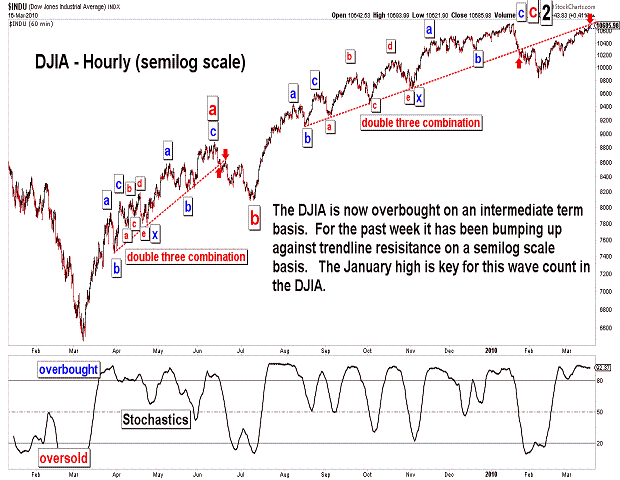
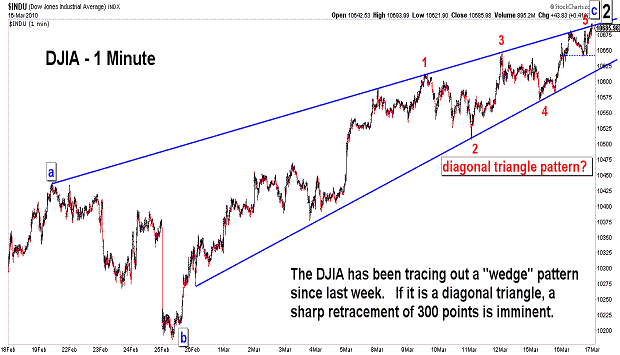
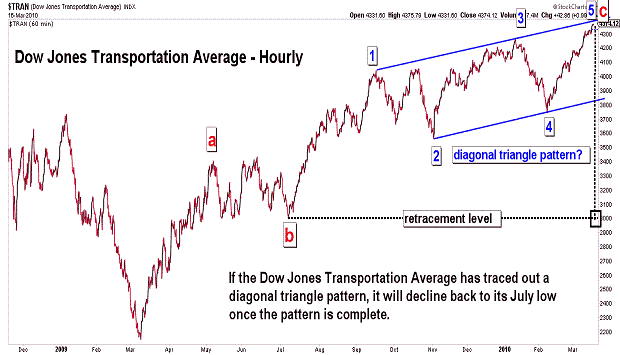
| March 16, 2010 update...The DJIA has grinded out about 60 points this week...and is now only 44 points away from its January 19th intraday high. I remain bearish because all of the rally patterns since last year's low have been corrective in nature. The rally from the February 5th low is no exception (see DJIA charts above). Even if the rally does exceed the January 19th high, this fact will not change. It might change the longer term count somewhat...but, the July 2009 low remains my target for the intermediate term. The most bearish wave counts out there suggest that this could happen rather quickly. Others allow for a more gradual decline. The strength of the next decline will provide the best clue. Let's see what happens when the DJIA breaks critical support around today's low, i.e., 10621. |
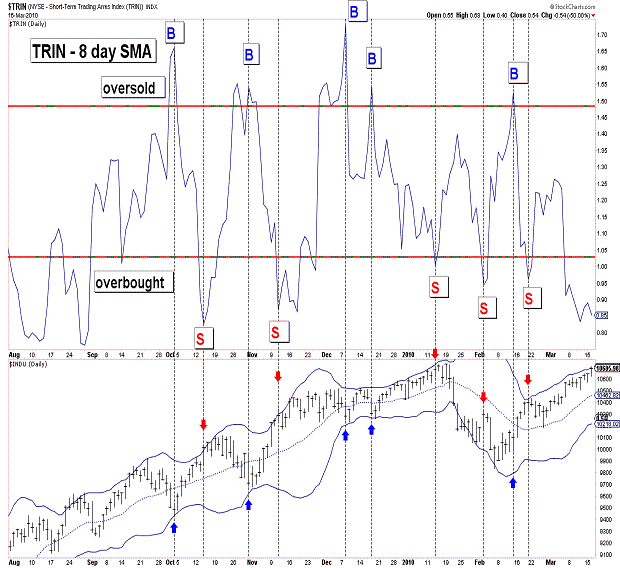
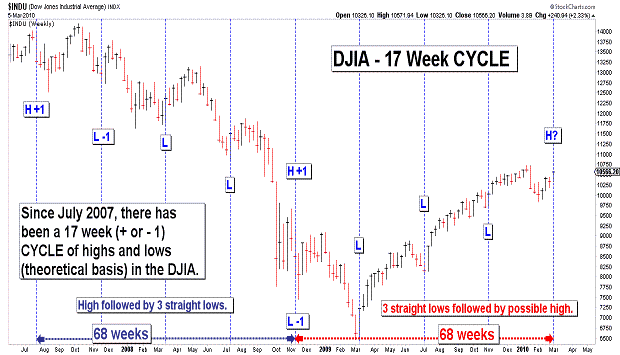
| March 12, 2010 update...The DJIA rallied only about 1/2 percent this week...but, it did close the week 6 points above its January 8th weekly closing high of 10618. The weekly closing chart is now out of sync with charts of shorter time durations. In most cases, these charts will eventually "sync up" with the weekly chart...which means that the DJIA will exceed its January 19th high of 10729. There are, of course, exceptions (see May 18, 2001 - this divergence lead to a 29 percent decline). As pointed out in the last two updates, the market has been trading at an extremely overextended level on a technical basis...and it is even more so today. Sentiment has finally joined other indicators pointing to an important top (see fourth chart above). The market can certainly hold up for a short time...possibly tracing out a diagonal triangle topping pattern. Major turns often occur near the spring equinox...so, a reversal is possible anytime (see March 2007, 2008 and 2009). The best indication of the reversal will be a sharp increase in the volatility index (VIX). Obviously, this would be caused by a sharp market decline. |
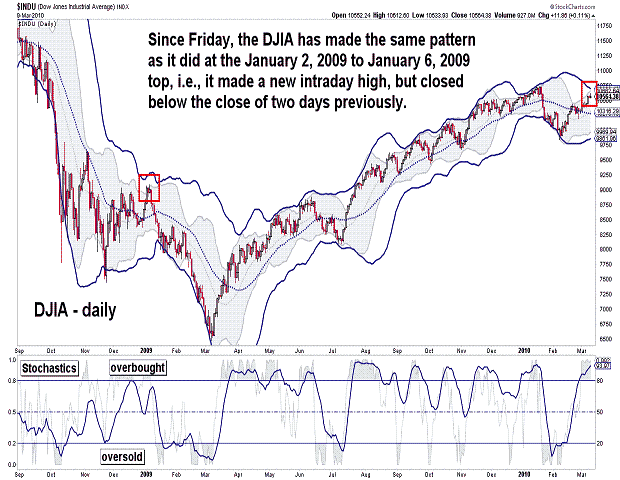
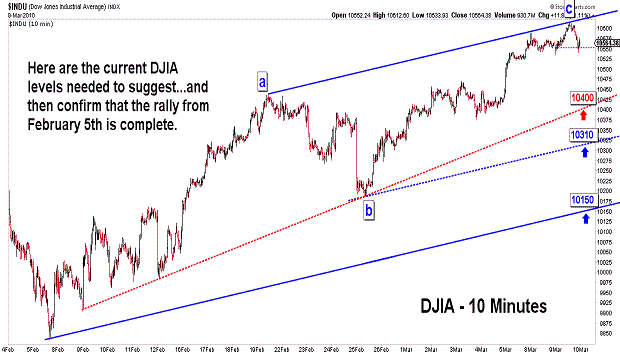
| March 9, 2010 update...Depite today's higher close, there were more technical signs of a top for the rally since February 5th. Today was an outside day for the DJIA, i.e., today's high was higher than yesterday's high and today's low was lower than yesterday's low. In general, on such days, it is a positive sign if the market closes in the upper half of its range...and negative if it closes in the lower half. Today, the DJIA closed in the lower half of its range. Not only did the DJIA close below the midpoint of its daily range, it closed below its Friday close. This same pattern occurred at the top in early January 2009 (see second chart above). One other similarity between early January 2009 and now was the occurence of the 42 day CYCLE turn date (see first chart). Same pattern...same CYCLE...I find that very interesting! On Friday, I said that "the fly in the ointment...is sentiment, i.e., the CBOE put call ratio is in neutral territory." The (equity) put call action this week is finally moving towards an excessively bullish level, i.e., a top (see fourth chart). All of the other Elliott wave and techncial reasons for a top mentioned on Friday still apply. We'll see if the market gets the message! |
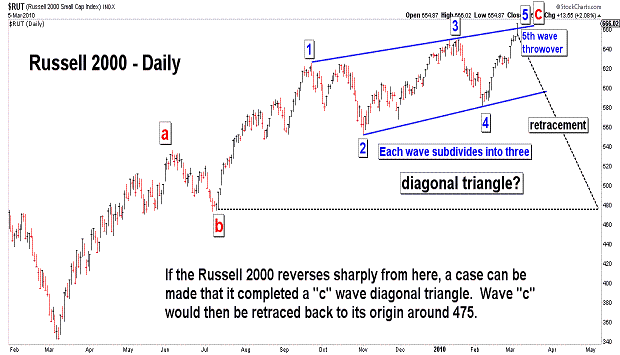
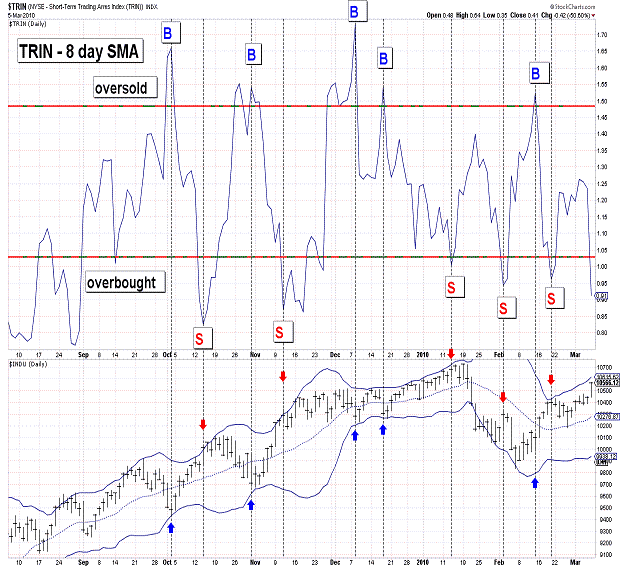
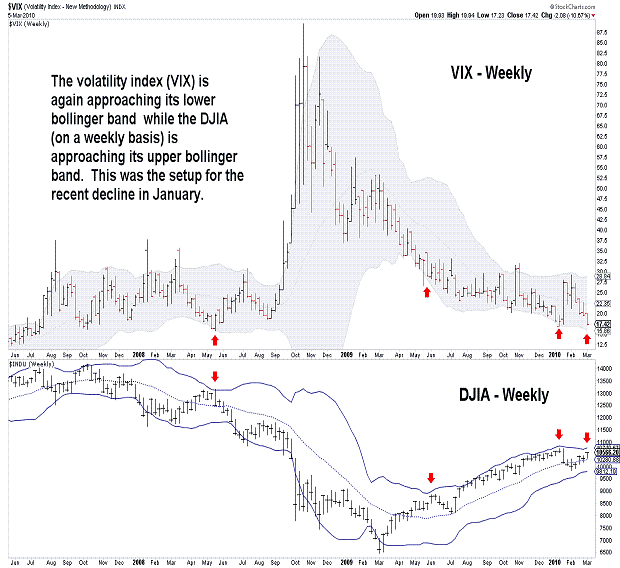
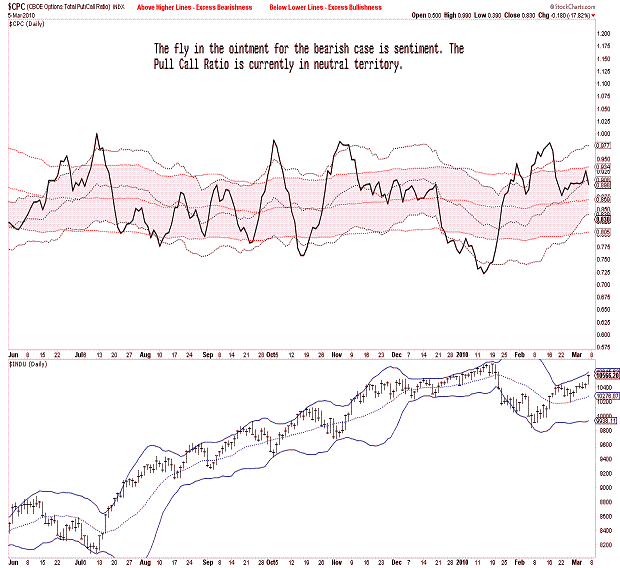
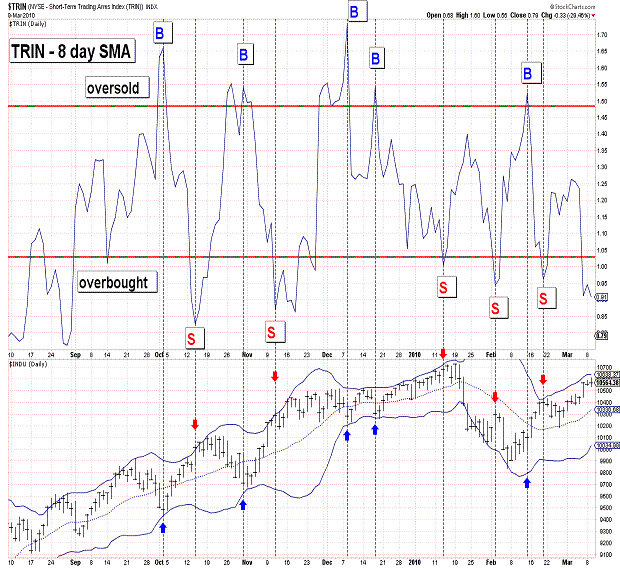
| March 5, 2010 update...Today's rally brought the market to a critical juncture. Either it turns down early next week...or it continues higher breaking major resistance barriers and casting doubt on the completion of wave 2 in January. Most of the technical indicators that I rely on support a major decline from here. See the first 5 charts above: stock market indices have reached their upper bollinger bands; they are overbought on a short term and intermediate term basis; TRIN is short term overbought; trendline resistance has been reached on a number of charts; VIX is approaching its lower bollinger band (a sell signal after a reversal); the 17 week CYCLE is suggesting a trend change is at hand. The fly in the ointment right now is sentiment, i.e., the CBOE put call ratio is in neutral territory (see last chart). As I mentioned in Tuesday's update, "it is...possible to see a diagonal triangle top forming in the RUT." Well, that top is now formed...IF the indice immediately reverses lower. As I also said on Tuesday, "the rules of Elliott wave analysis indicate a quick retracement back to the July 2009 lows" once the pattern is complete. If, on the other hand, the rally continues...the pattern is negated and something else is going on. Next week should be interesting! |
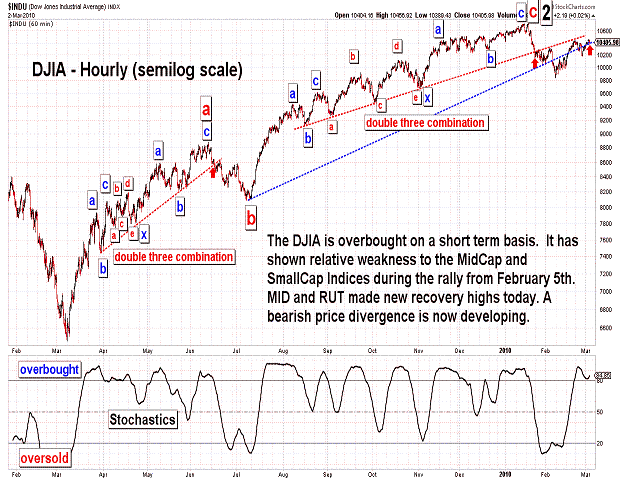
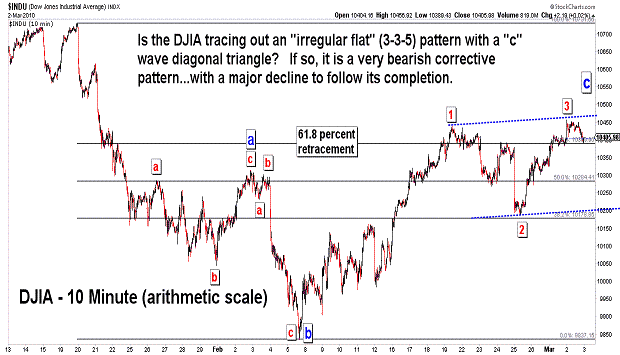
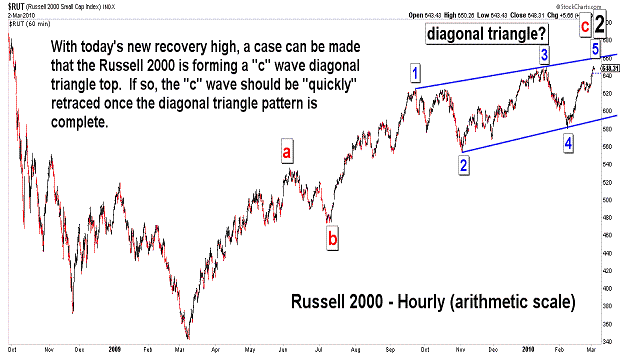
| March 2, 2010 update...Two stock market indices that I follow, the Russell 2000 and S&P 400 Midcap, made new recovery highs today...while most other stock indices were still well below their January highs. Technically, we now have a price divergence in place between market indices...which is a common occurence at major market turning points. Patternwise, it is now possible to see a diagonal triangle top forming in the RUT and MID indices (see fourth chart). It does not yet look complete...but once it is, the rules of Elliott wave analysis indicate a quick retracement back to the July 2009 lows should occur. As for the DJIA's pattern (see second chart), one possibility is an "irregular flat" corrective pattern...with a "c" wave diagonal triangle in progress. If so, a 4th wave decline is next. That would be followed by a final 5th wave rally to complete the a-b-c (3-3-5) correction from January 22nd. We'll see. |
Important: Information and chart access provided herein is educational in nature and shall not, directly or indirectly, be construed as investment advice. No guarantees are made with respect to the accuracy of the information, opinions, predictions, etc. offered herein.
Copyright © 1997 - 2012. The Elliott Wave Chart Blog. All rights reserved. Email
|