|
Charts
IMPORTANT: Chart buy/sell signals are helpful in determining market support and resistance levels...and probable turning points. However, they are only useful if the analyst has a handle on the larger trend. Experience and judgment play a vital role in that determination ...as does Elliott wave analysis.
If a chart does not not appear when you click on the link, you may need to (1) enable javascript, and/or (2) disable pop up blocking for this site, or (3) right click on your mouse and open the link in a new tab or window. Charts will generally appear when you use Internet Exploer or Firefox. Do not use Google Chrome to view charts.
Contact us at info@wavechart.com if you have a question or comment. |
|

Elliott Wave Chart Blog April 2010 Archive
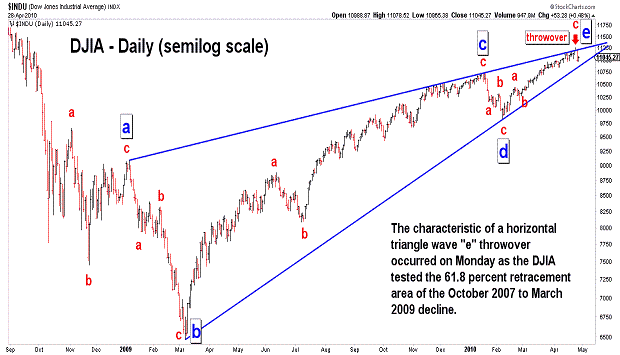
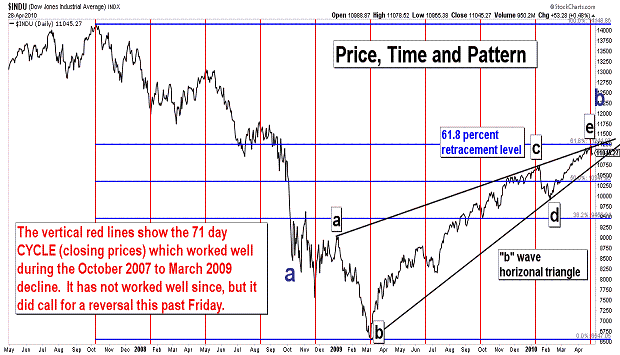
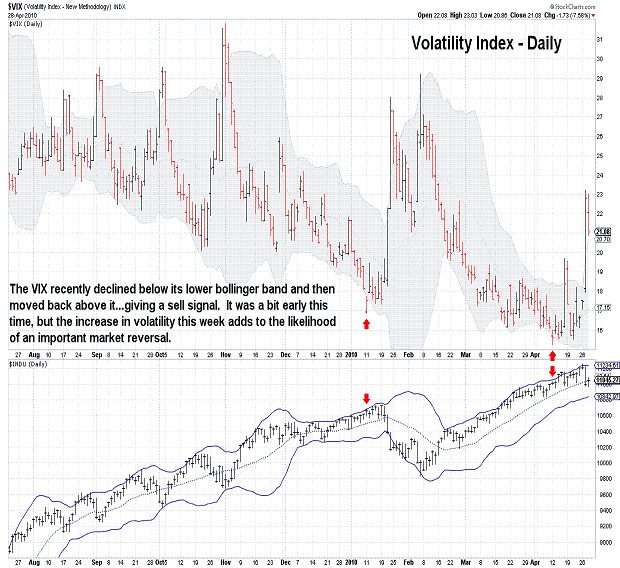
| April 28, 2010 update...I am home following surgery on Monday morning. I was knocked out while the market was making a top that day...and I really do hope that it was THE top. The rally since the beginning of February has been painful to those of us who are long term bears...and the painkillers I am now taking do not provide any relief from that. I said last Friday that the "b" wave horizonal triangle pattern "...would look even better with a final throwover above the upper boundary line and then a quick reversal below it." Well, I got my wish. You can see Monday's tiny throwover and yesterday's nice reversal lower on the frist chart above. Now there has to be persistent follow through on the downside in the coming weeks. Another rally above Monday's high will diminish the likelihood of my wave count. Let's see what happens. I'll also keep you posted on any developments regarding my health and the near term schedule of updates. |
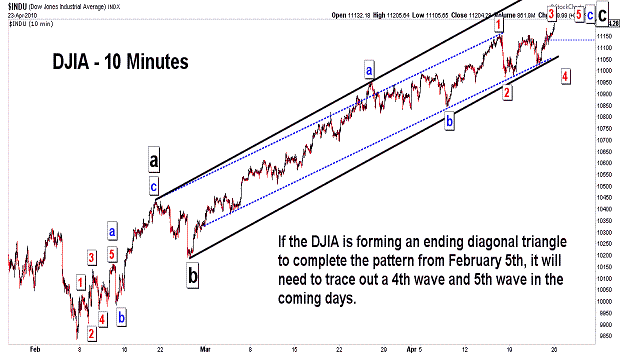

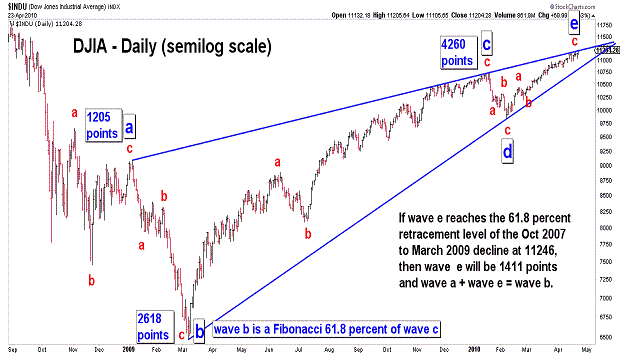
| April 23, 2010 update...While the DJIA did not top out Wednesday or Thursday as suggested by some Fibonacci time relationships, it still appears to be in the latter stages of a topping pattern. The Fibonacci 61.8 percent retracement point of the October 2007 to March 2009 decline is now only 42 points away from today's close. So, a top in that area seems like a good possibility. I would consider today's close of 11204 to already be close enough to be deemed a valid test of that retracement level...but, we may get even closer next week. In fact, the DJIA's pattern would look best (to me), if we get a wave 4 pullback...and a final wave 5 rally to complete an ending diagonal triangle. There is no requirement that the rally pattern from the February 5th low end with a diagonal triangle...but, each of the previous rally patterns since March 2009 has ended that way. So, why not one more time? As I have discussed in recent updates, my preferred long term wave count is that of a horizontal triangle pattern since October 2008. I think it now looks best on a semilog scale chart...and it would look even better with a final throwover above the upper boundary line and then a quick reversal below it. That is what I will be watching for next week. A final note: I will be having surgery Monday morning...a parotidectomy. I should be home by Tuesday...and, if well enough, I will post the next update on Wednesday. If I am unable to do so, I'll try to post a message. |
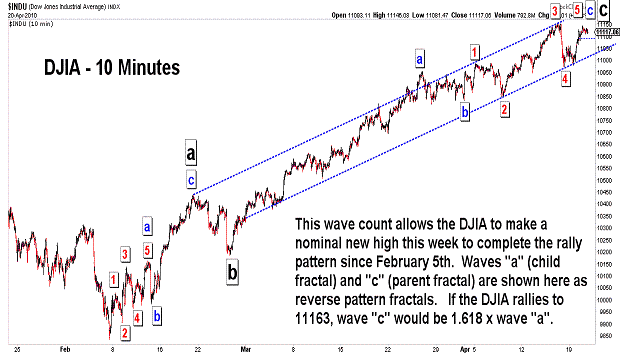
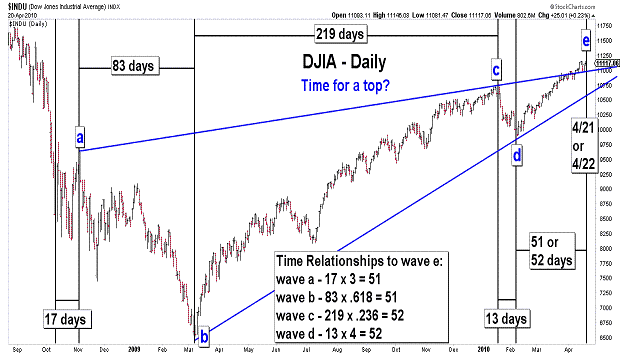
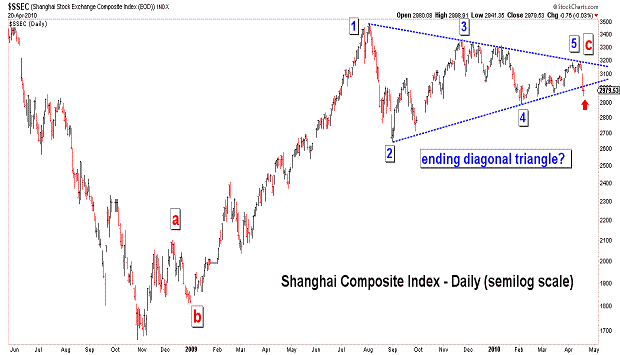
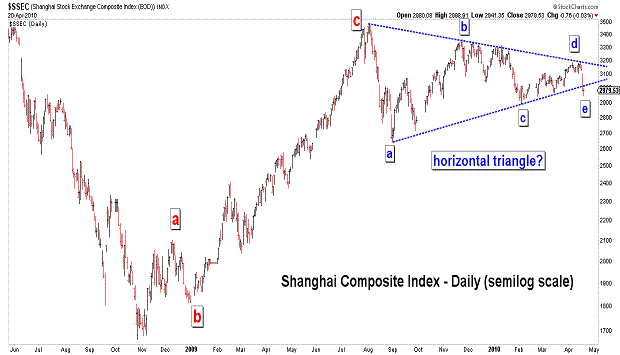
| April 20, 2010 update...The DJIA failed to follow through with more selling yesterday and today after Friday's sharp decline. I indicated on Friday that the DJIA would have to decline below 10850 to confirm that a top was in place...and it did not. So, with the DJIA only 37 points away from last Thursday's intraday high, it is likely that a new high will be achieved. If my wave analysis is correct that the DJIA has traced out a horizontal triangle since October 2008, Fibonacci time relationships suggest that the high will occur tomorrow or Thursday. In addition, price and pattern relationships would be ideal if the DJIA tops out around 11163...but, that is not absolutely required. The previously discussed 11246 level is also a possibility. Finally, keep your eye on the Shanghai Composite in the coming days for a clue about our markets. The Shanghai index has traced out a triangle pattern and is on the verge of a sharp move. Which way depends on whether the triangle is an ending "diagonal triangle" (bearish case) or "horizontal triangle" (bullish case). It should become quickly evident in the coming days. |
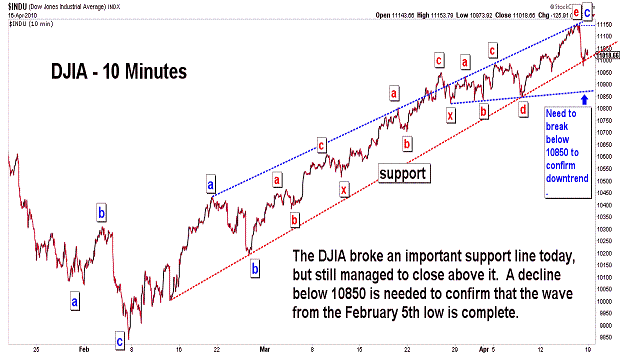
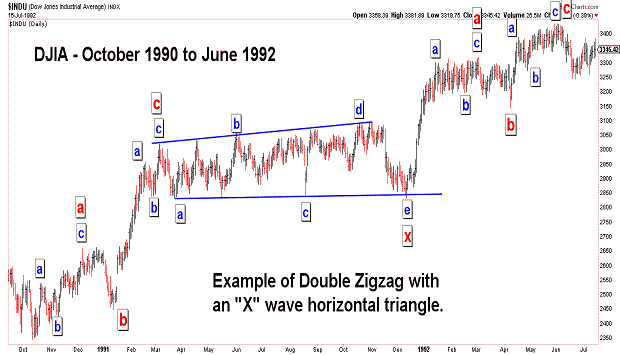
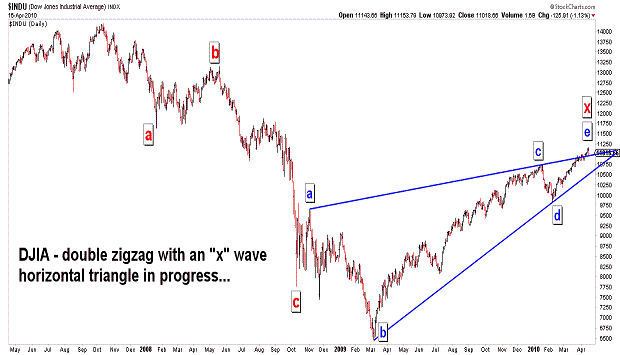
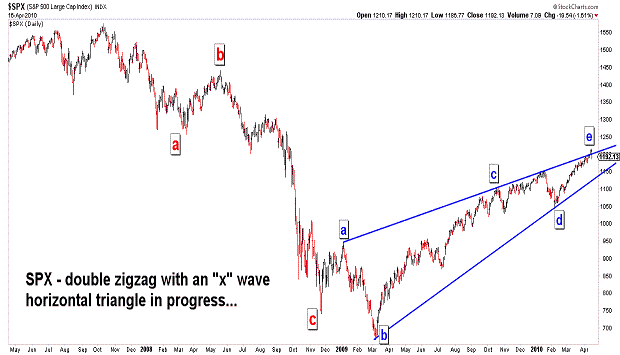
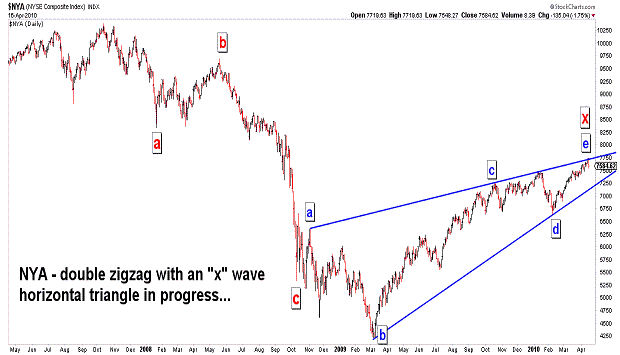
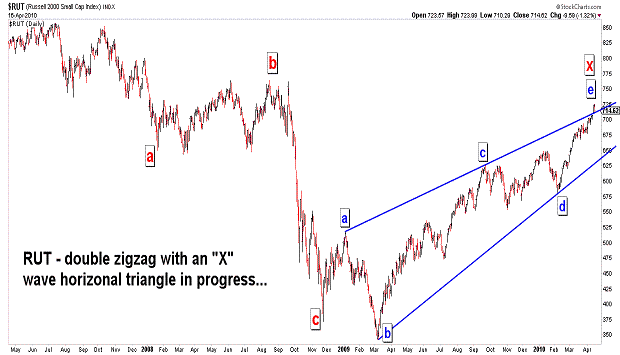
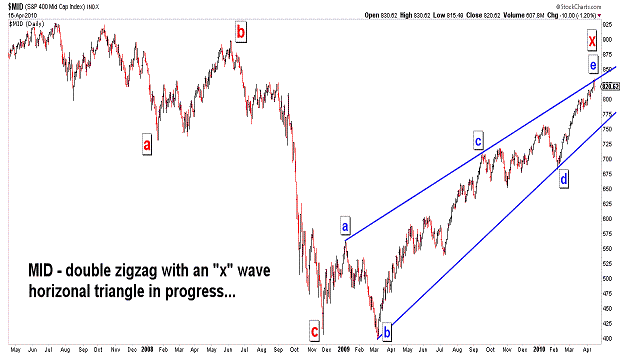
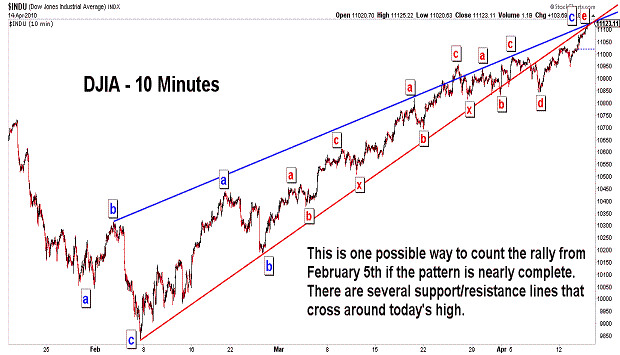
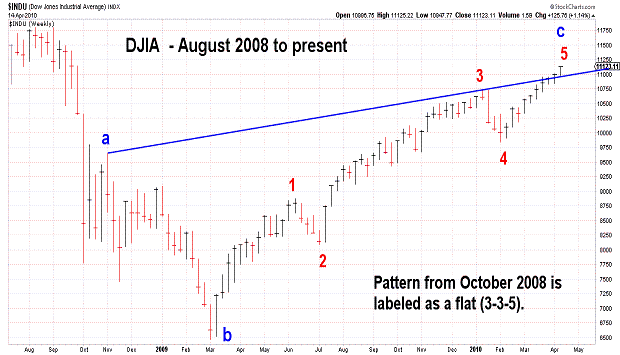
| April 16, 2010 update...The DJIA took back its gains of the past two days and closed just below Tuesday's closing level. Today's decline was the largest since February 4th...49 trading sessions ago and one day before the February 5th low. The DJIA and NDX closed the week slightly higher. But, several indices...i.e., NYA, OEX, SPX, XII...ended the week on the downside forming key reversal patterns on their weekly charts. While a final top for the rally since February 5th has not yet been confirmed, today's strong decline was a good first sign. On Wednesday, I said: "...a reversal must begin tomorrow, or the triangle analysis will be invalidated." The reversal did begin yesterday about 3:00 pm and accelerated today. My recent analysis that the rally was concluding with an ending diagonal triangle will remain valid as long as yesterday's high remains in place. Speaking of triangles, I can now see complete (or nearly so) "x" wave horizontal triangles on most of the broad stock indice charts. Some may disagree with this long term wave count (Prechter told me yesterday that he thinks this count breaks Elliott rules), but I think it does work and does conform to all of Elliott's rules. I will admit, however, that the formation is very steep and contrasts with the more typical horizontal triangle sideways pattern (see example above from 1990-1992). Assuming it is valid, and the triangle is the "x" wave of a "double zigzag" pattern as I have suggested on the charts above...the next decline should be similar in size and character to the decline that preceeded the triangle's formation. Remember September/Octber 2008? If we do, in fact, get that kind of action, I will know what to expect for the next year. |
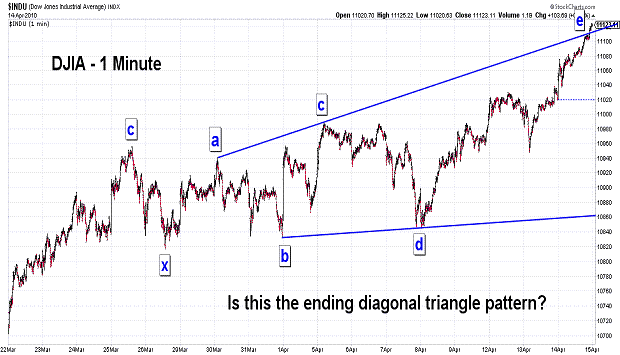
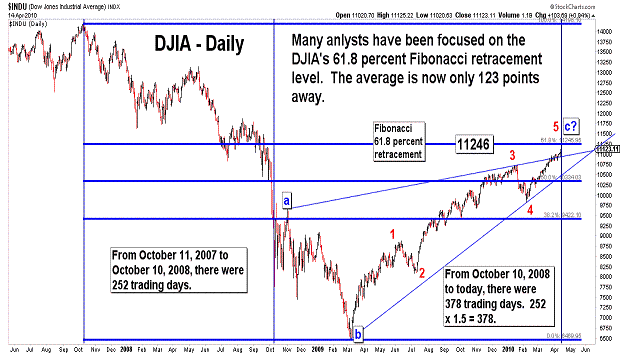
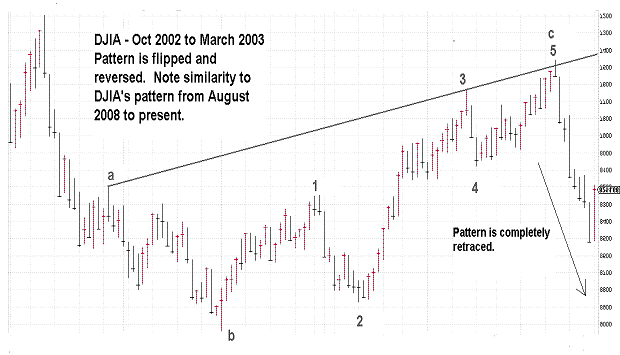
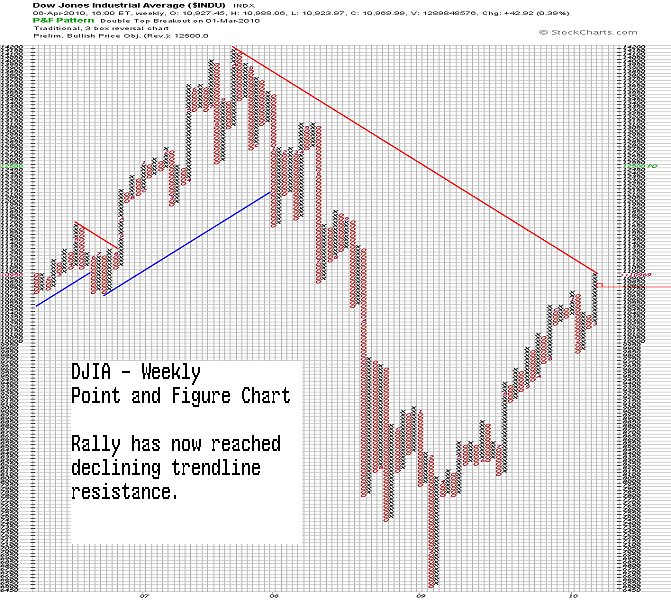
| April 14, 2010 update...Today's strong rally threw a monkey wrench into my recent view of an ending diagonal triangle top for the DJIA. An ending triangle pattern, however, can still be counted into today's high, if the first wave of the triangle begins on March 30th, rather than March 25th. The upper boundary line of the triangle is thus much steeper than I originally thought it would be. But, the fact of the matter is this: a reversal must begin tomorrow, or the triangle analysis will be invalidated. Technical analysis has been useless for weeks now as the market's momentum has carried it steadily higher. Maybe the 61.8 percent retracement level of 11246 that has been a known Fibonacci target for months now will draw the market to it. Usually, however, when there is such an overwhelming focus on a particular number, it is either exceeded or not reached at all. We'll see. For some time now I had been trying to remember when I had last seen a pattern that was similar to the DJIA's pattern since 2008. I finally found it...it's the fourth chart above. It keeps the long term bearish view alive. |
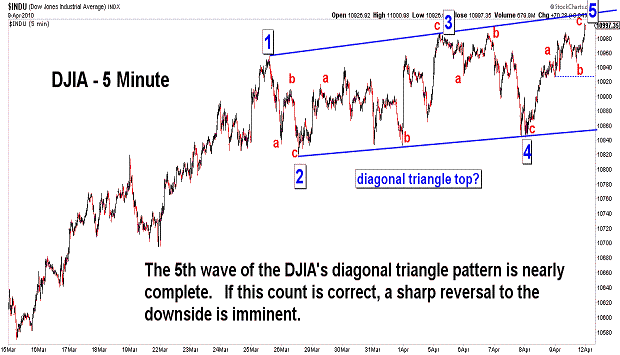
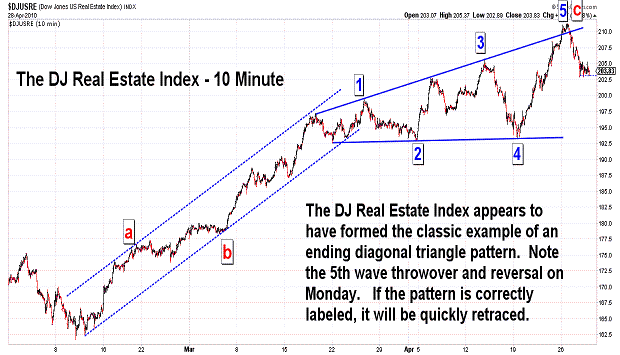
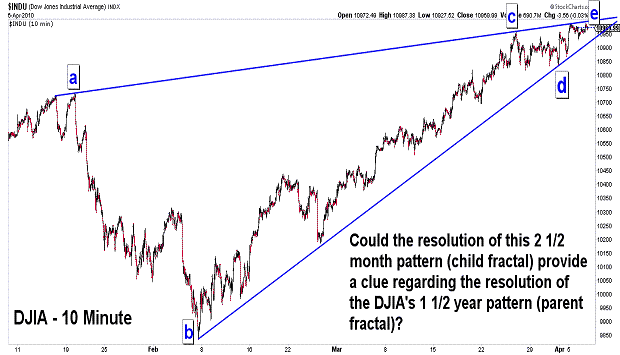
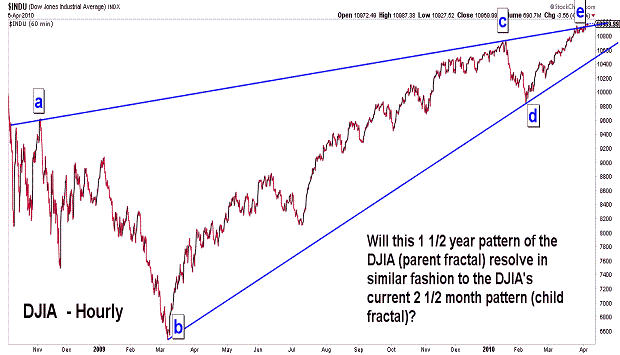
| April 9, 2010 update...As I suggested in Tuesday's update, the DJIA has now traced out the 4th and 5th waves of a diagonal triangle top. If the pattern is correctly labeled, a major reversal is imminent...and will begin once the 5th wave of the triangle is complete. Take a look at the diagonal triangle that ended on January 19th. It should serve as a good illustration of what the reversal should look like when it does begin. Anything other than that will cast doubt on the validity of the triangle analysis. As for the DJIA's longer term pattern, there are a number of possible ways to count it. Lately, I have grown partial to the "b" wave contracting triangle count because of the many mathematical price and time relationships that it provides between the various waves. If the count is valid, the (c) wave of the pattern from the October 2007 high is about to begin...and it should take the form of a double zigzag...just like wave (a) of the pattern. It should also last about 12 months...just like wave (a). Will it also decline by 6300 points like wave (a)? We'll see. |
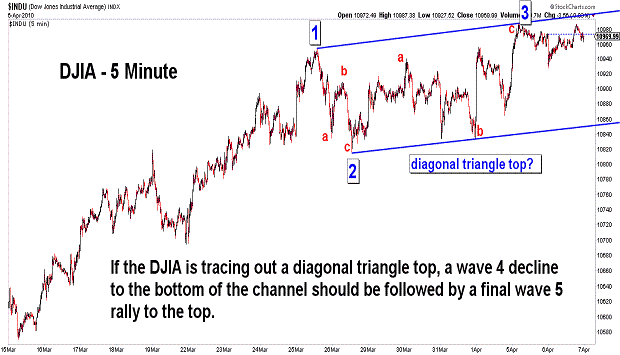
| April 6, 2010 update...If the DJIA is tracing out a diagonal triangle top, as I described and illustrated in the last update, a wave 4 decline to the bottom of the trendchannel should be next. That would be followed by a final 5th wave rally back to the top of the trendchannel to complete the entire rally from the February 5th low. Should the pattern, in fact, develop in this manner...the longer term rally from the March 2009 low and its encompassing wave pattern (of one larger degree) would also be countable as complete. A major decline would be next...the extent of which would depend upon the correct labeling of the waves since the October 2007 high. While there are a number of wave count possibilites at this point, I am currently leaning to the most bearish of them all. The character and strength of the next decline should, however, provide some clues. A decline in the next day or two significantly below 10800 would likely suggest a top is already in place...and eliminate the diagonal triangle top scenario. |
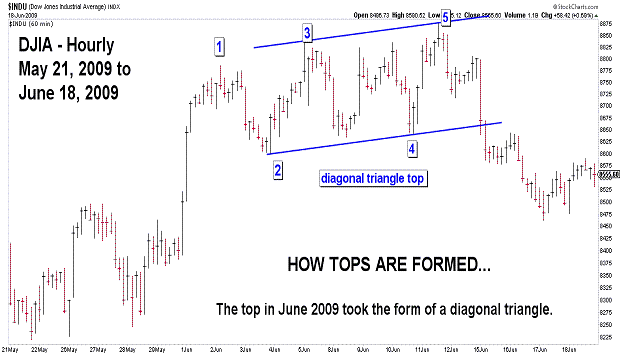
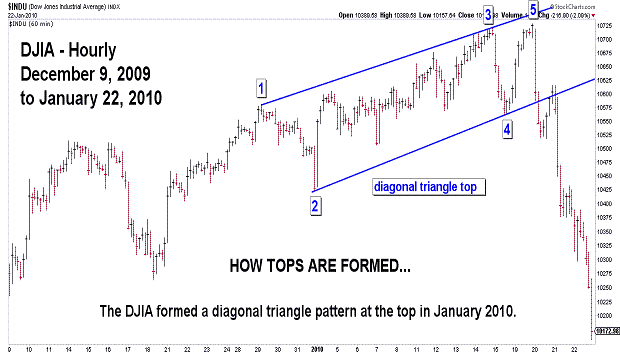
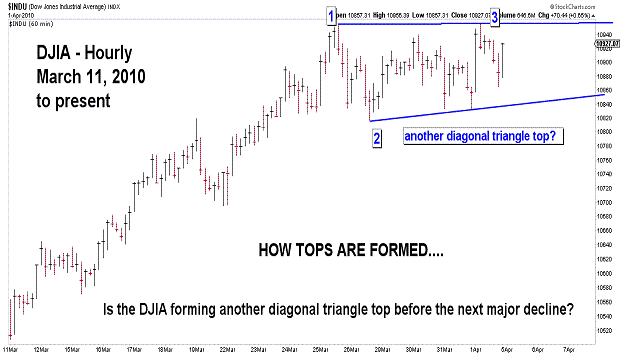
| April 3, 2010 (holiday) update...Since the March 2009 low, the DJIA has had only two signficant declines...each of around 8 to 9 percent. Both were preceeded by diagonal triangle topping patterns (see first two charts above). With that in mind, it is likely to expect the next top to be formed in the same fashion (see third chart). We'll see. Finally, I noted something last week which may or may not be important, but I thought it was interesting. At the January 14th to January 19th top, the DJIA made a new actual intraday high on the 19th...but, it did not do so on a theoretical basis. The same thing happened last week. The DJIA made a new intraday high on Thursday that exceeded the March 25th intraday high by one point. It did not, however, make a new high on a theoretical basis. |
Important: Information and chart access provided herein is educational in nature and shall not, directly or indirectly, be construed as investment advice. No guarantees are made with respect to the accuracy of the information, opinions, predictions, etc. offered herein.
Copyright © 1997 - 2012. The Elliott Wave Chart Blog. All rights reserved. Email
|