|
Charts
IMPORTANT: Chart buy/sell signals are helpful in determining market support and resistance levels...and probable turning points. However, they are only useful if the analyst has a handle on the larger trend. Experience and judgment play a vital role in that determination ...as does Elliott wave analysis.
If a chart does not not appear when you click on the link, you may need to (1) enable javascript, and/or (2) disable pop up blocking for this site, or (3) right click on your mouse and open the link in a new tab or window. Charts will generally appear when you use Internet Exploer or Firefox. Do not use Google Chrome to view charts.
Contact us at info@wavechart.com if you have a question or comment. |
|

Elliott Wave Chart Blog April 2011 Archive
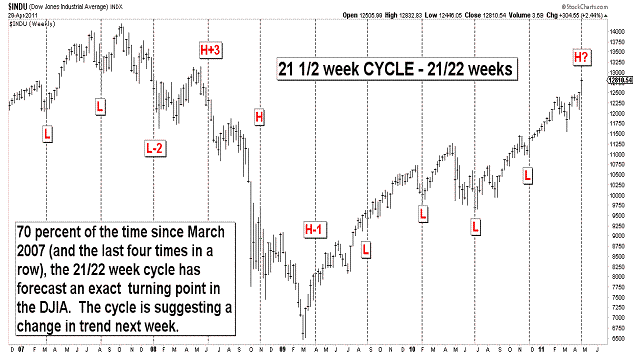
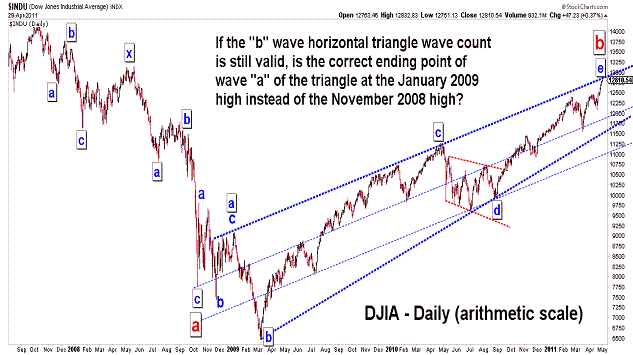
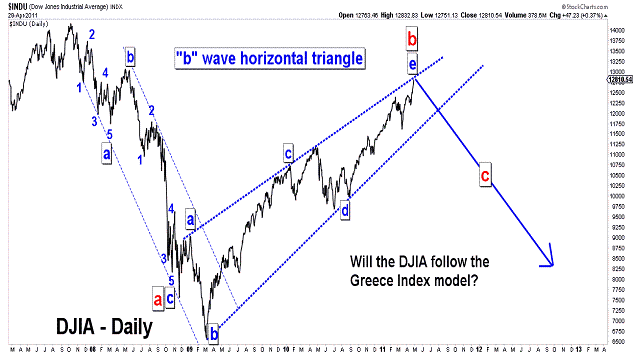
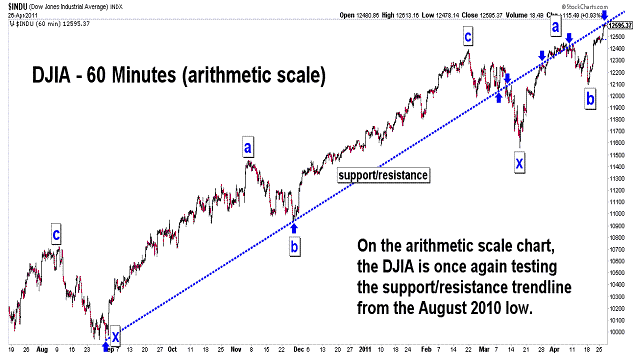
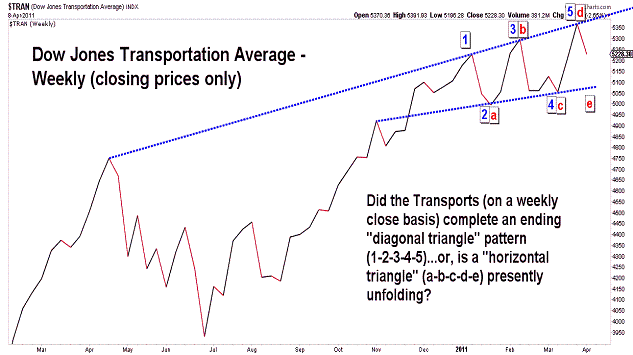
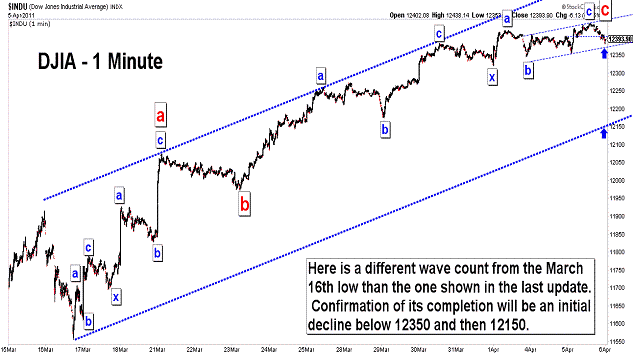
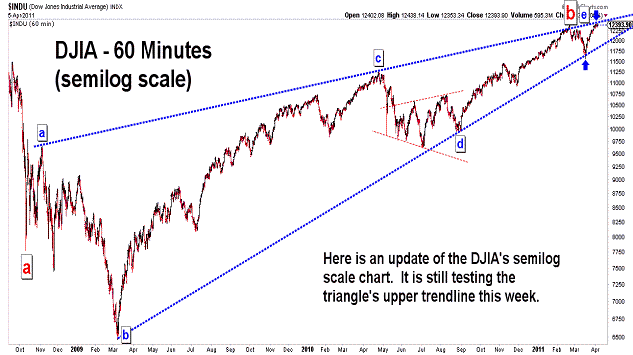
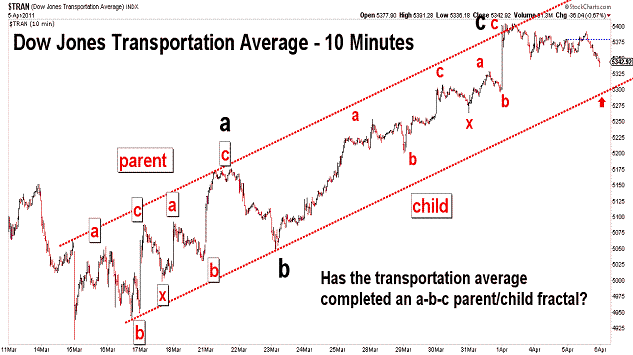
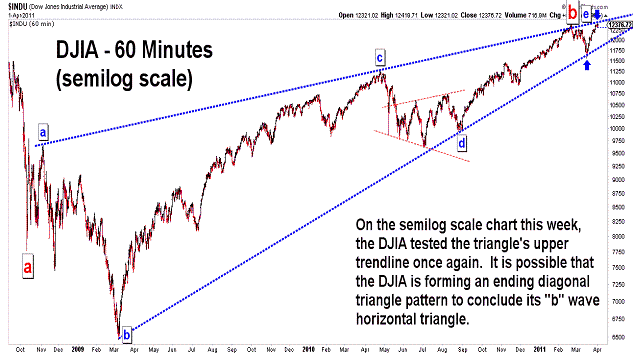
| April 29, 2011 update...The market continued its "melt up" since Tuesday's update and did not confirm a reversal in trend by week's end. One time cycle (the 21/22 week cycle - see second chart above), which has had a high percentage of accuracy since 2007, suggests a turn downward is due next week. It has successfully called four market reversals in a row...so, we'll find out next week if the streak continues to five. You will note that I have modified the "b" wave horizontal triangle slightly (see third chart above). Given the market's action this week, it now looks better with the "a" wave of the triangle ending in January 2009, rather than November 2008. Frankly, I had always thought that the "a" wave counted better with it ending at the later date...but, I never thought the DJIA would rally all the way up to the trendline drawn from that point. But, it has...and so I made the change. This is probably the last change I can make if, in fact, the rally from the 2008/2009 lows is a countertrend correction of the decline from the 2007 high. |
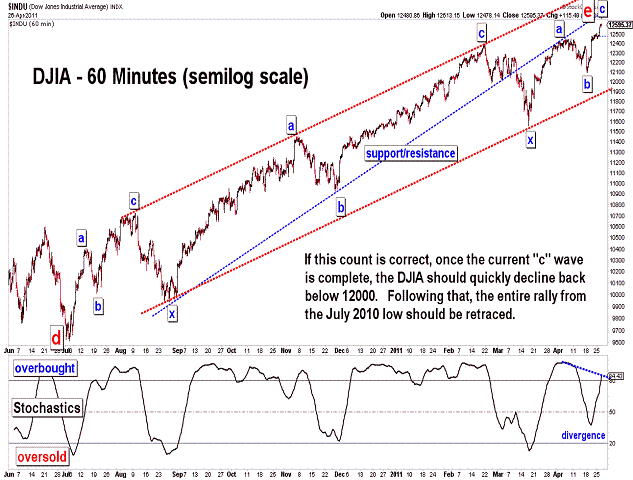
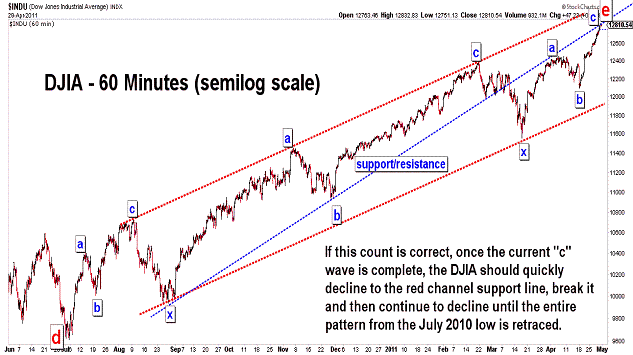
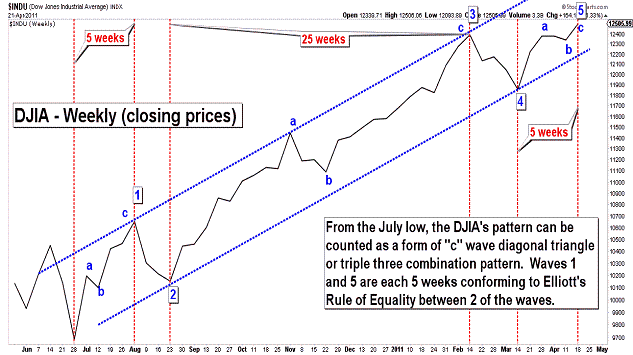
| April 26, 2011 update...According to the Elliott wave pattern from the July 2010 low, the current "c" wave from the April 18th low should be the final wave in the pattern. A close below yesterday's close of 12479 should be a good indication of a reversal. An alternate indication would be a close on Friday below 12505. If I am right about the wave count from the July 2010 low, then according to Elliott rules, it should be entirely retraced...and in significantly less time than it took to unfold. Once that wave is retraced, the market may consolidate for a period of time...but, eventually the rest of the advance from the March 2009 low of 6469 should be retraced as well. |
| April 22, 2011 update...Given the market's current Elliott wave pattern(s), various time cycles and divergences among the stock indices, next week is shaping up to be very interesting. Stay tuned! |
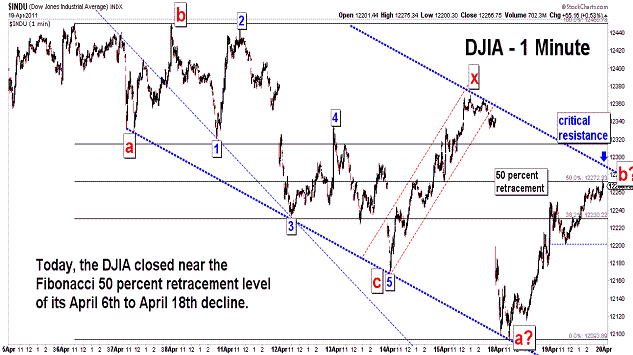
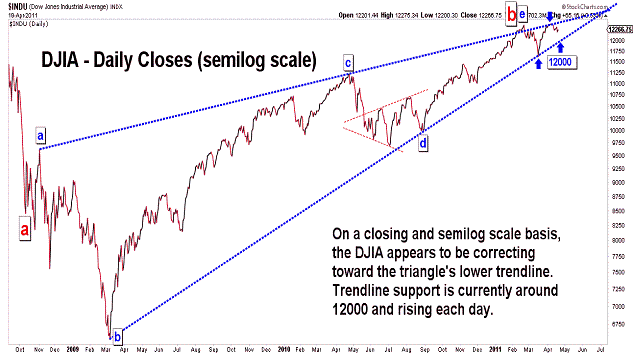
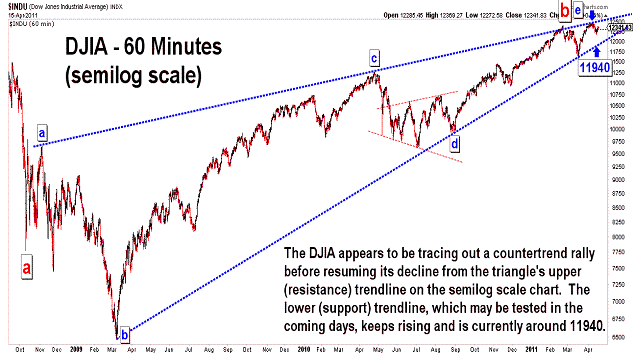
| April 19, 2011 update...Today's rally from yesterday's low retraced 50 percent of the decline from the April 6th high. At least for now, the pattern from that high continues to look corrective in nature. When the current bounce concludes, the next decline (assuming it will exceed yesterday's low) should take the DJIA to the 12000 area. As shown in the second chart above, that area is where the triangle's rising support line on the semilog scale chart is currently situated. |
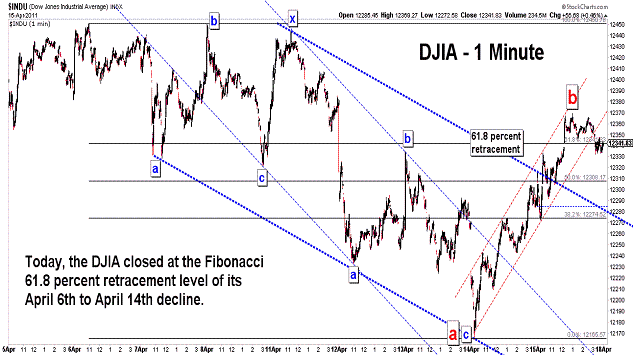
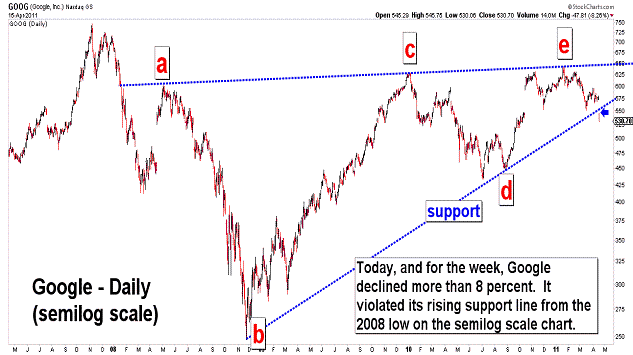
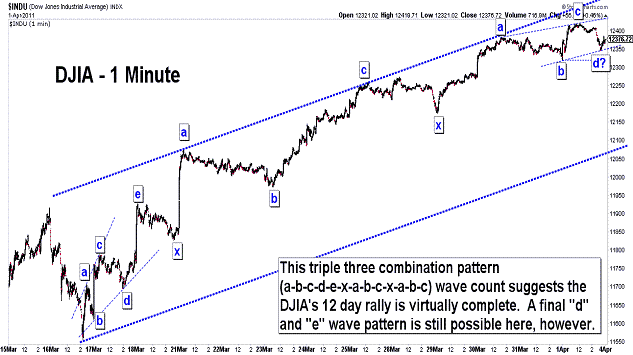
| April 15, 2011 update...Except for today's dramatic selloff in Google, it was a rather dull week in the market. There must have been alot of last minute income tax filing going on! For the week, the market was mixed...the DJIA was up slightly and the NASDAQ down slightly. At the close today, the DJIA had retraced a Fibonacci 61.8 percent of the decline from the April 6th high. Assuming that the "correction" that began at that high is still ongoing, this is an obvious point for the market to reverse back to the downside next week. I still think that the "b" wave triangle's lower support line is the likely testing point for this correction. That line is rising...and is currently around 11940. The April 6th to April 14th decline appears to have unfolded as a double three combination pattern...a-b-c-x-a-b-c (as suggested in Tuesday's update). The next wave down is likely to have a similar pattern. We'll see. |
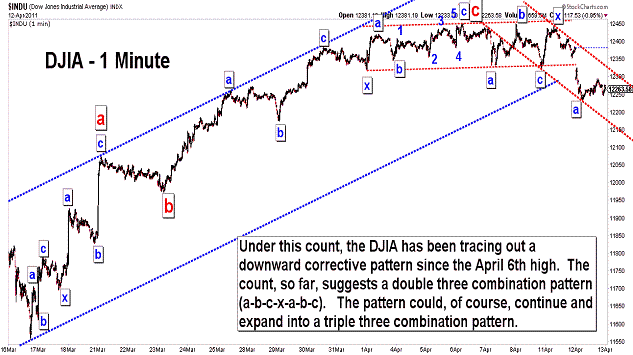
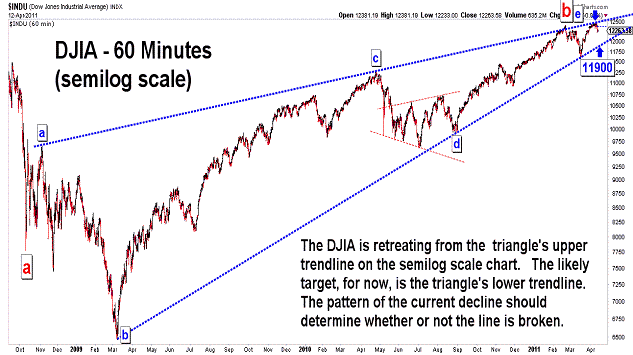
| April 12, 2011 update...The downward correction from last Wednesday's high accelerated today with the DJIA closing 117 points lower. According to one possible wave count (see first chart above), the DJIA is tracing out a double (or possibly triple) three combination pattern...with a likely target of at least the 11900 area. This is the area of the DJIA's "b" wave triangle support line on the semilog scale chart (see second chart above). Choppy action by the DJIA in the coming days would tend to confirm this combination pattern wave count...with the biggest part of the decline coming in the final "c" wave. |
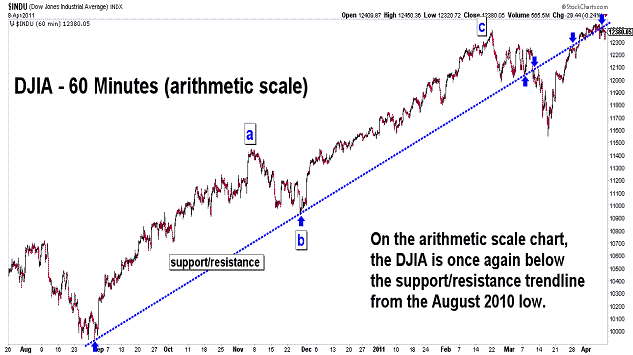
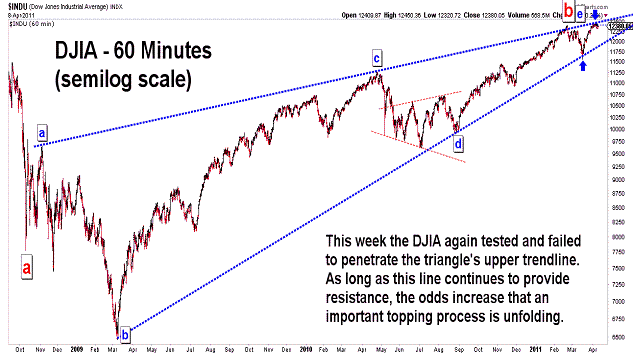
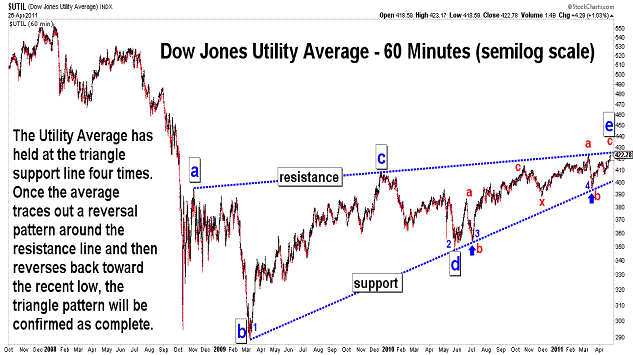
| April 8, 2011 update...The DJIA was essentially unchanged for the week, while the NASDAQ was weaker and lost about 1 percent. The short term correction that I discussed on Tuesday seems to be underway (especially if the 21 1/2 week cycle is working). How low we go in the coming days is not yet clear. The market still has several options in terms of its pattern formation for a long term top. Most importantly this week, the DJIA did not violate the critical resistance line that I have referred to in recent posts (see third chart)...and this helps me sustain my belief in the "b" wave triangle wave count that began in 2008. |
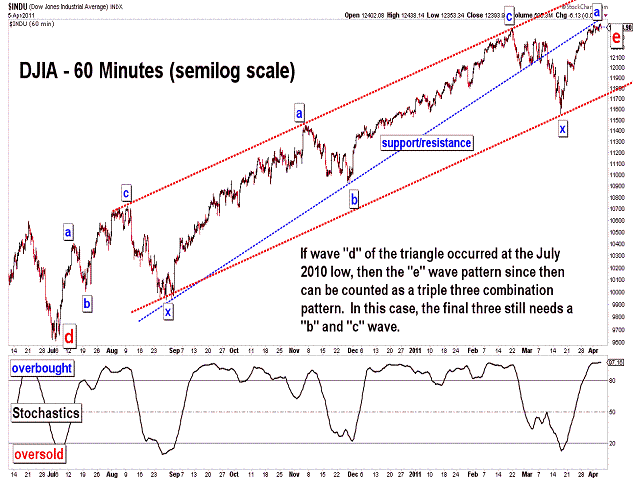
| April 5, 2011 update...As I said in my last post, the market is currently in the 21 1/2 week cycle time window, and a reversal of some kind is likely. If the next decline is modest, it would likely be the "b" wave of a final a-b-c within a triple three combination pattern for wave "e" (as shown in the second chart above). If the decline is larger and retests the area of the March low, it could be the fourth wave of an ending diagonal triangle pattern. If the market does not start to sell off in the next few days, some other (undetermined) pattern is underway. In any event, it is critical that the resistance lines shown in the above charts hold if an important top is in the making. |
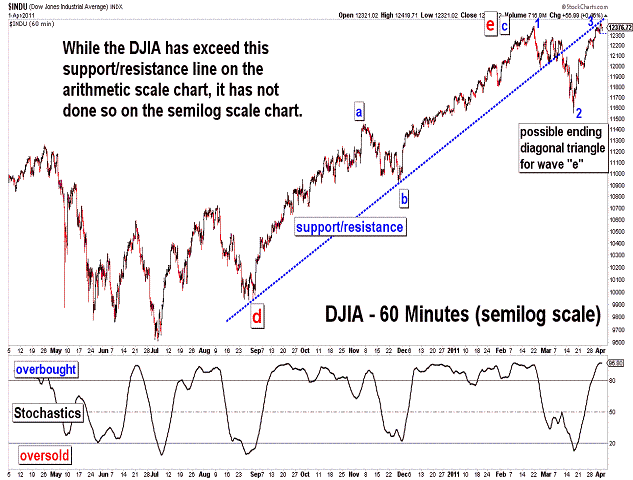
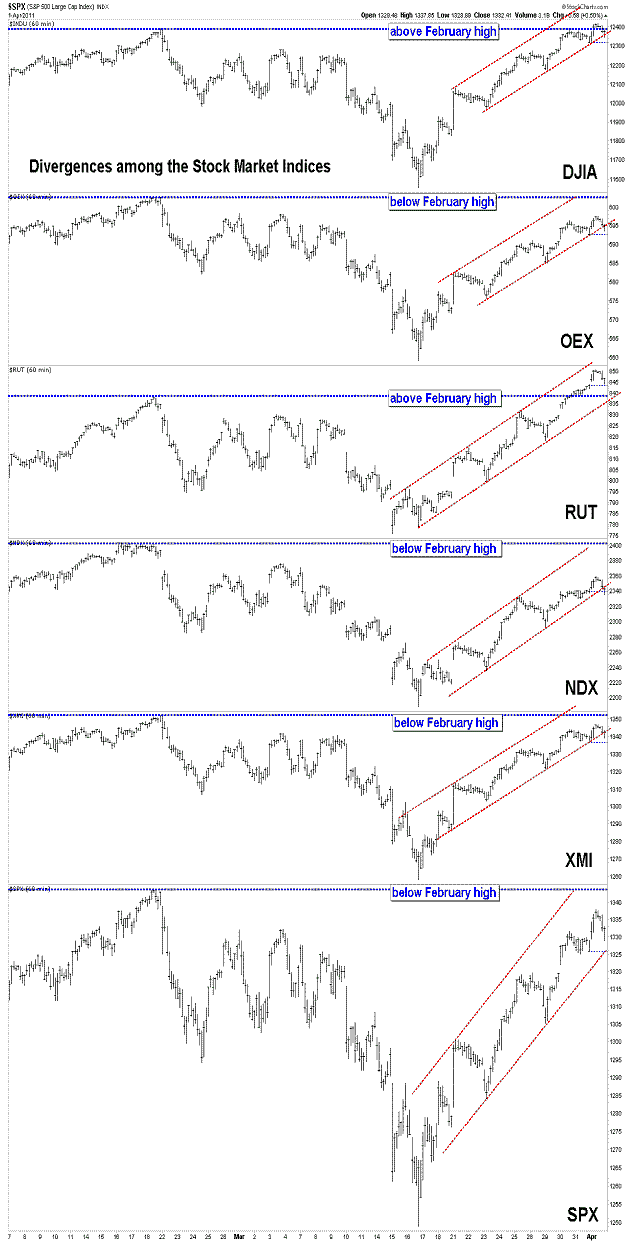
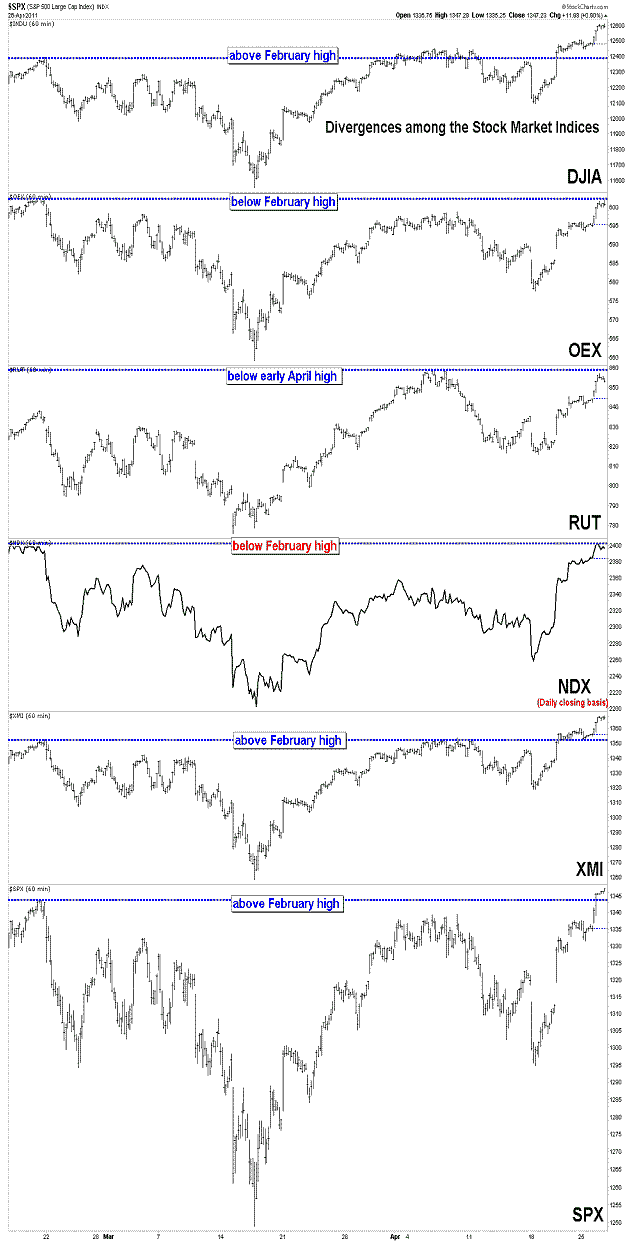
| April 2, 2011 update...The DJIA has now rallied for 12 days since its intraday low on March 16th. For the week, the market gained another 1 plus percent. On an intraday basis, the DJIA on Friday exceeded its February 18th high. It did not, however, close above the February 18th close of 12391.25. That makes for an interesting divergence...and we will see next week if it has a meaningful effect on the market. As you can see in the last chart above, there are additional market divergences currently in place among the various broad indices. Those indices that have not exceeded their February highs need to gain strength and catch up if the current rally is going to continue. A close below Thursday's close of 12319 would, at the very least, suggest some type of near term correction is underway. However, given that we have entered the 21 1/2 week cycle time window (which, since 2007, has produced some dramatic turning points)...the next decline could be larger than most expect. |
Important: Information and chart access provided herein is limited to current subscribers only and shall not be forwarded or retransmitted without written authorization. It is educational in nature and shall not, directly or indirectly, be construed as investment advice. No guarantees are made with respect to the accuracy of the information, opinions, predictions,etc. offered here in. The username/password provided to a subscriber is unique and it is the sole responsibility of the subscriber to protect the confidentiality of said username/password and to further protect it from any unauthorized use.
Copyright © 1997 - 2013. The Elliott Wave Chart Blog. All rights reserved. Email
|