|
Charts
IMPORTANT: Chart buy/sell signals are helpful in determining market support and resistance levels...and probable turning points. However, they are only useful if the analyst has a handle on the larger trend. Experience and judgment play a vital role in that determination ...as does Elliott wave analysis.
If a chart does not not appear when you click on the link, you may need to (1) enable javascript, and/or (2) disable pop up blocking for this site, or (3) right click on your mouse and open the link in a new tab or window. Charts will generally appear when you use Internet Exploer or Firefox. Do not use Google Chrome to view charts.
Contact us at info@wavechart.com if you have a question or comment. |
|

Elliott Wave Chart Blog May 2010 Archive
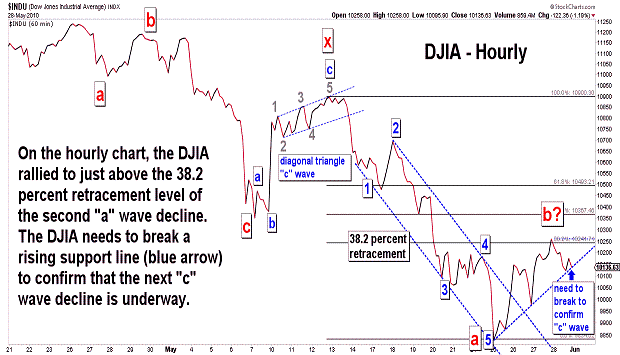
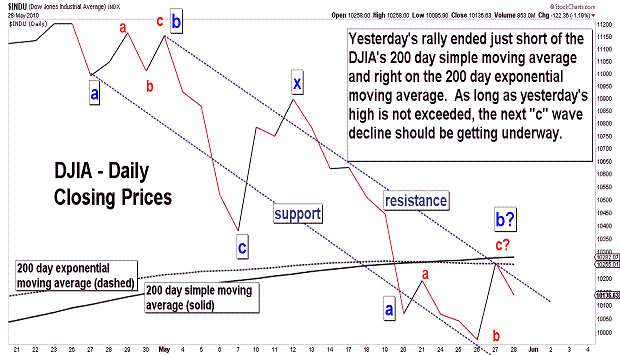
| May 28, 2010 update...It was a mixed week for the market indices. On Tuesday, I suggested that the DJIA completed the second "a" wave of "a series of a-b-c corrective patterns" from the April 26th high. I said that a "b" wave was likely in progress...and showed several possible targets in Tuesday's charts. One was the 200 day moving average...another was the 38.2 percent retracement level of the decline from March 13th (wave "a"). Yesterday, the DJIA closed right between them...within 10 points of the first and 30 points of the second. So, there is a high probabilty that wave "b" is complete and wave "c" is underway. Today's decline provided some good support for that case...but, further confirmation is required next week. A reversal back to the upside would obviously negate that wave "c" has started. As I said in recent updates, my target for the end of wave "c" is 8700 to 9400. We'll see what happens next week. In the meantime, enjoy the Memorial Day holiday. |
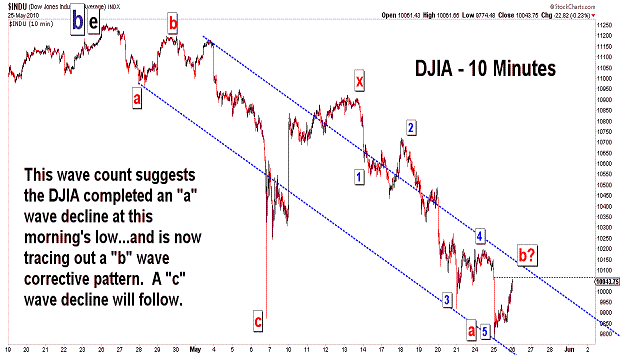
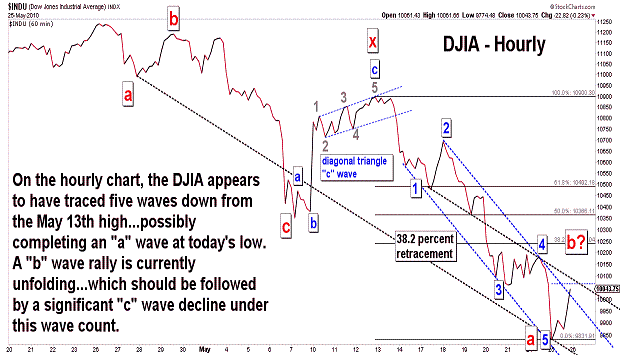
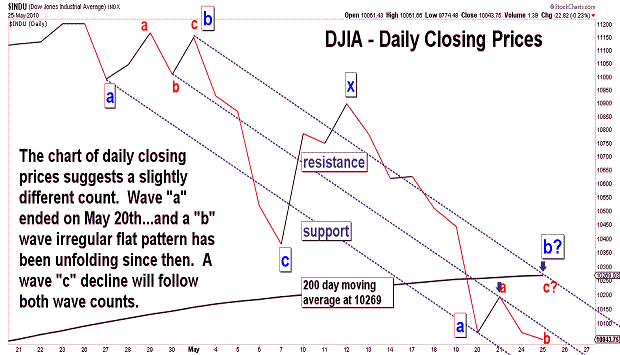
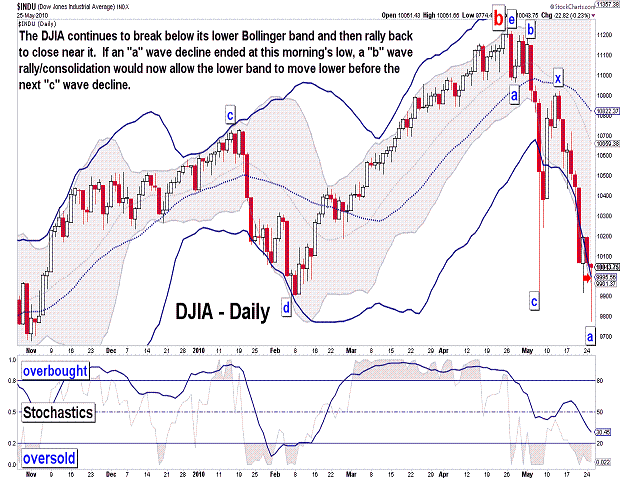
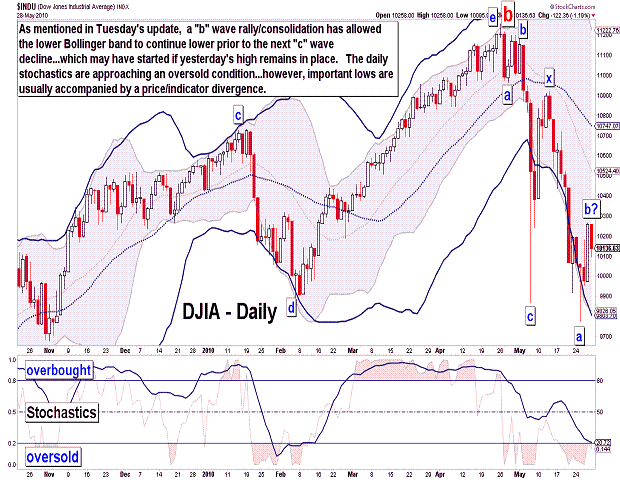
| May 25, 2010 update...On Friday, I suggested the DJIA "in the coming days" would follow other stock indices in breaking its May 6th low. The DJIA did so today. While the DJIA and other indices today closed well off their lows, they continue to decline (so far) in accordance with my preferred wave count. To reiterate, that wave count suggests the DJIA is declining from its April 26th high in a series of a-b-c corrective patterns. At this morning's low, the DJIA either completed the second "a" wave of the pattern....or, alternatively, completed a subwave of a "b" wave corrective pattern that began on May 21st. In either case, a "b" wave is likely now in progress. Over the past several days, it appears that the market is weakest at the open in the morning, but reverses and rallies back in the afternoon. Technically, the indices have a hard time staying for any length of time below their lower bollinger band. They quickly snap back to it or slightly above it. A "b" wave consolidation would allow the lower band to move lower before the next "c" wave decline begins. I don't think we will have to wait too long before that decline gets started (my target remains 8700 to 9400)! |
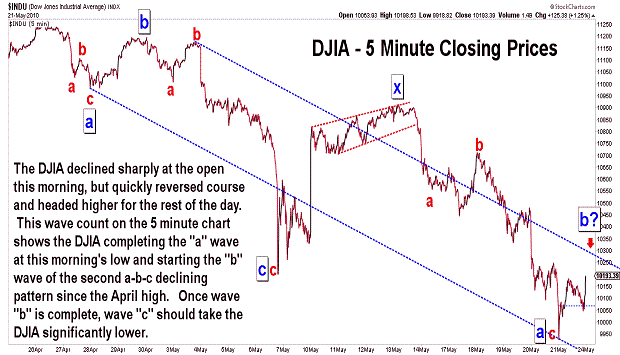
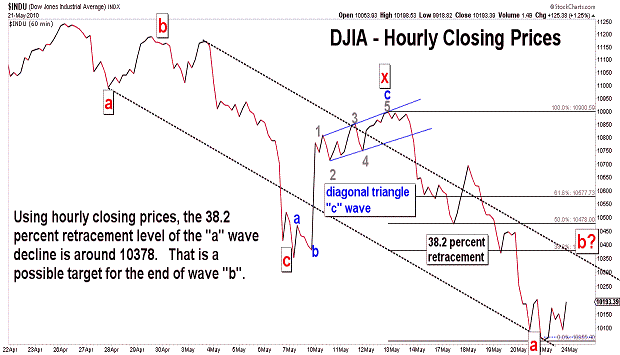
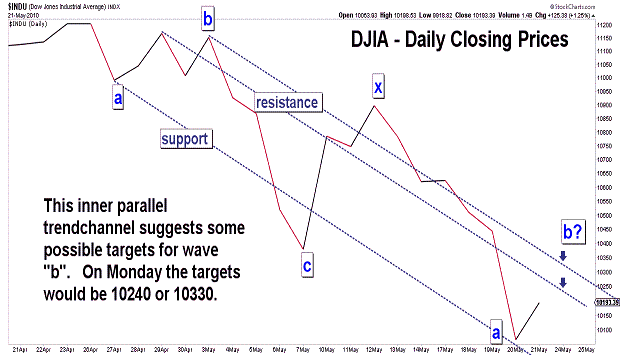
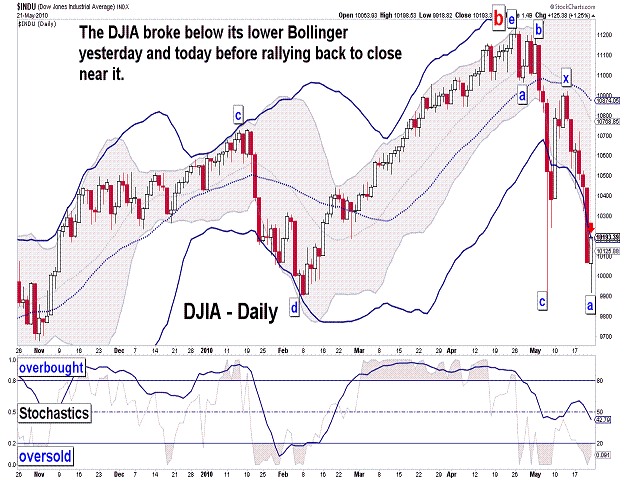
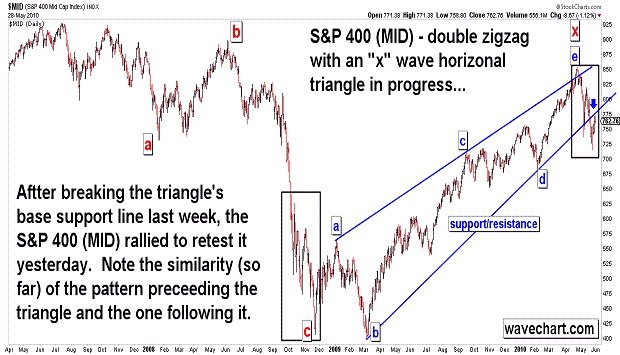
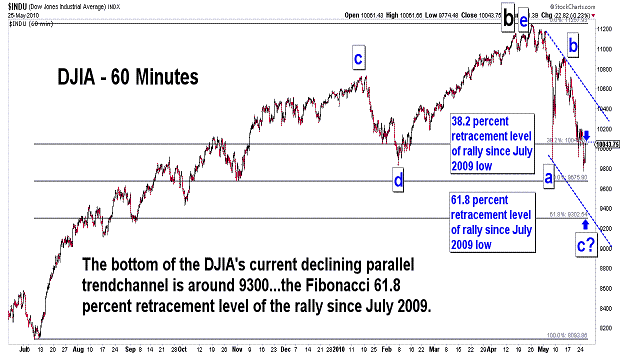
| May 21, 2010 update...The DJIA lost about 4 percent this week. While the DJIA has not yet broken below its recent May 6th low, a number of other broad stock indices have, i.e., SPX, OEX, NYA, RUT, MID, XII. If my preferred wave count is correct, the DJIA will follow suit in the coming days. That wave count suggests the DJIA is declining from its April 26th high in a series of a-b-c corrective patterns. At this morning's low, the DJIA completed the second "a" wave of the pattern. On the hourly chart, that low occurred at 10060 (today's actual intraday low was 9918.82). In Tuesday's update I suggested "...that a wave "b" corrective pattern is likely to occur in the 10000 to 10200 area." That turned out to be a pretty good guess on both an hourly and daily closing basis (I was slightly off on an intraday basis). In any event, wave "b" is likely to continue unfolding for a period of time next week (keep an eye on the 200 day moving average - currently at 10262)...before wave "c" begins and takes the DJIA significantly lower (8700 to 9400 is my current expectation). While it would not be fatal to my count, a rally above 10500 would probably make me rethink the timing and overall pattern of the current intermediate term decline. |

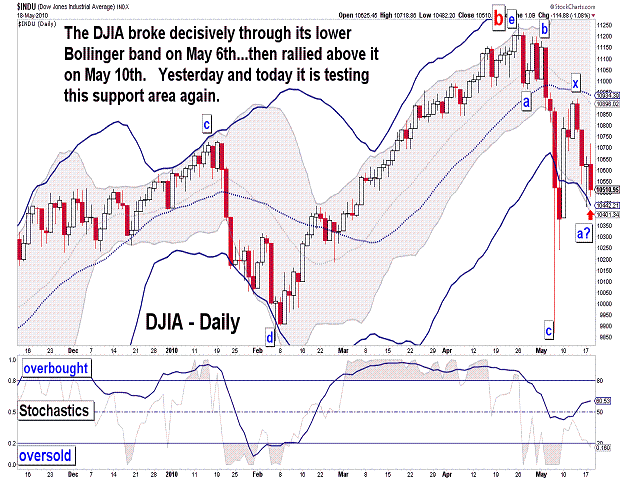
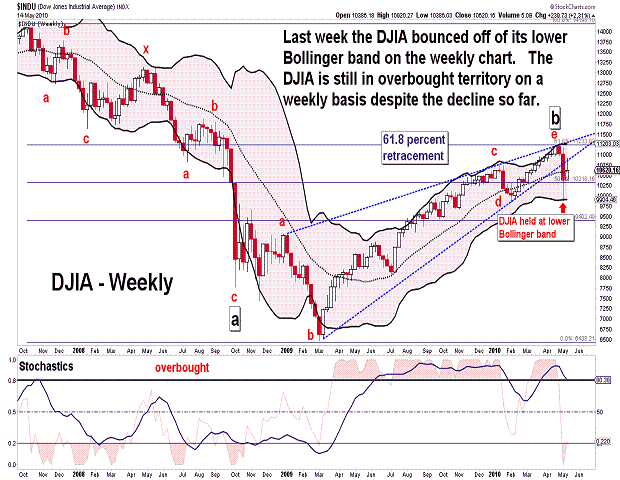
| May 18, 2010 update...Sorry about the lateness of today's update. I was out of town most of the day and away from the action of market. There really is not much to add to the comments of the past few updates. The DJIA continues to unfold in line with my preferred view that another a-b-c pattern is unfolding following the completion of an "x" wave last Thursday. As you can see in the second chart, the DJIA has declined back to test its lower Bollinger band...after moving below and above it during the past week and 1/2. The lower Bollinger band could provide some temporary support or slow down the current decline. But, once it starts to bend sharply downward, the DJIA should work its way lower right with it...especially during the next wave "c" decline. My best guess (and it is just that) is that a wave "b" corrective pattern is likely to occur in the 10000 to 10200 area. We'll see. |
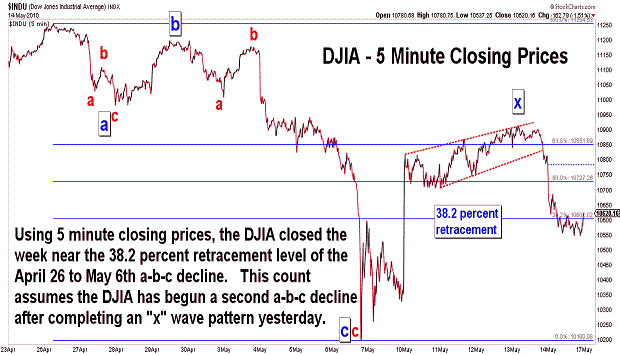
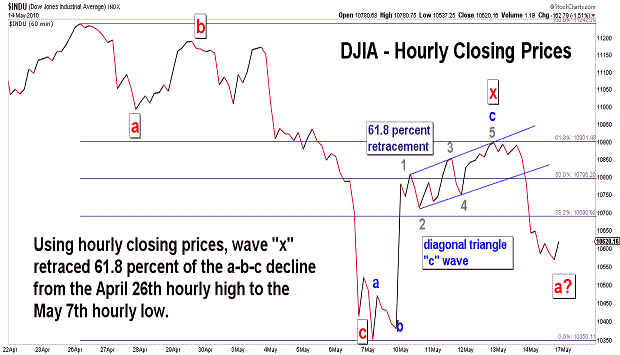
| May 14, 2010 update...The DJIA ended with triple digit moves four out of 5 days this week. Despite the strong gains on Monday and Wednesday, the DJIA closed today BELOW the midpoint of this week's trading range. I suggested in Tuesday's update that the DJIA was likely tracing out the first "x" wave of a multi-three combination corrective pattern (a-b-c-x-a-b-c or a-b-c-x-a-b-c-x-a-b-c). The "c" wave of that "x" wave appears to have completed a diagonal triangle pattern yesterday. That lead to the large selloff yesterday afternoon and today. While the "x" wave could trace out a more complex pattern, it is more likely (in my opinion) that the next "a" wave in the declining pattern from April 26th is underway. This "a" wave does not have to decline below last week's low of 9869 before a countertrend "b" wave begins (although it could). That "b" wave cannot, however, exceed 10920 or something else is going on, i.e. a complex wave "x" is still unfolding. Once wave "b" is complete, wave "c" should take the DJIA to or below 9000...possibly the July 2009 lows. We'll see. |
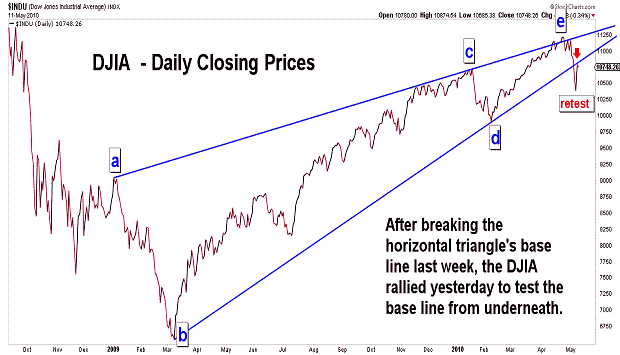
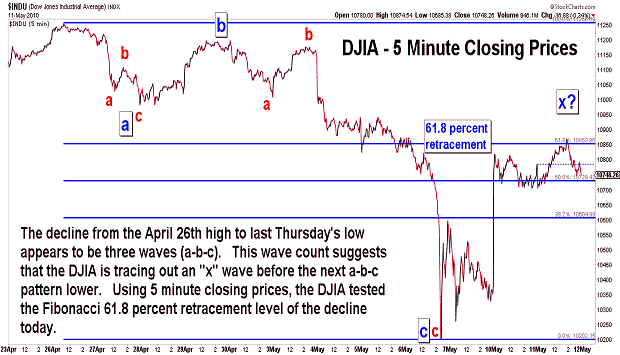
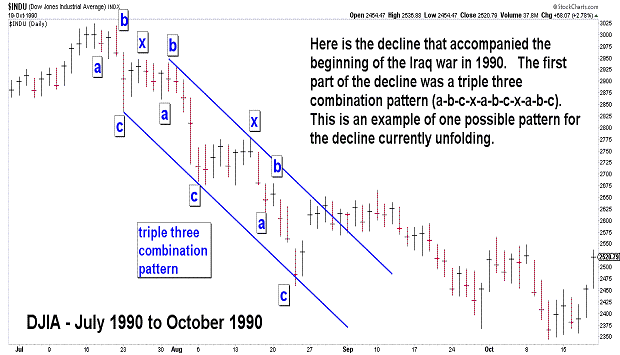
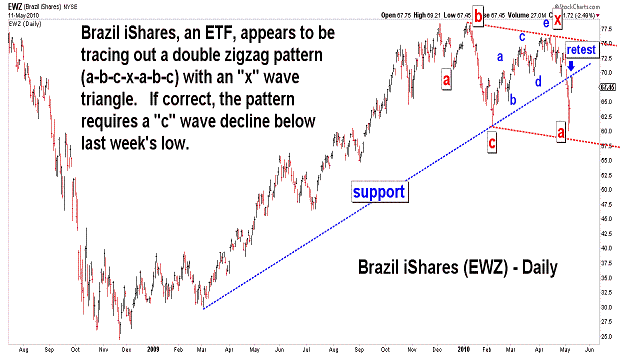
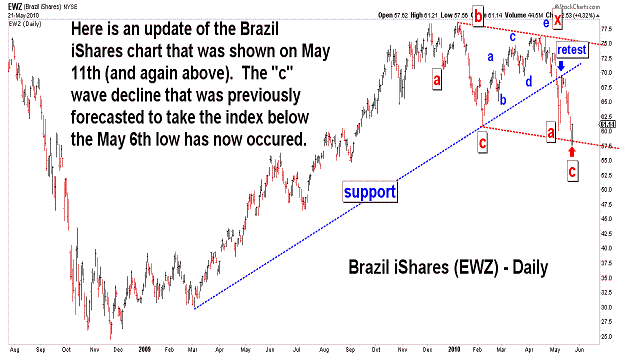
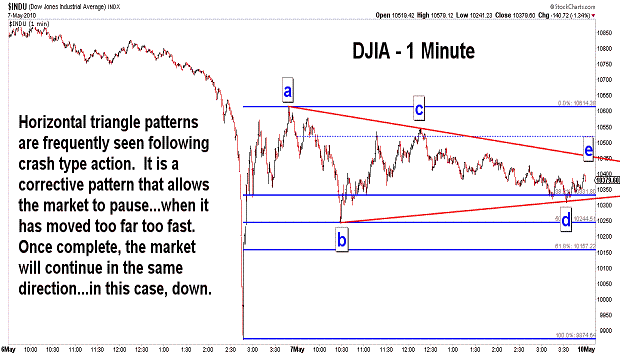
| May 11, 2010 update...In last Tuesday's update I said: "I expect to see more downside action in the coming days and weeks followed by brief rallies that retest support lines (emphasis added) that are broken along the way down." Well, yesterday the DJIA did rally back to test its previous support line which was broken decisively last week (see first chart). In last Friday's update I said: "The pattern from the April 26th high is only 9 days old and its structure can take various forms in the coming days and weeks." Yesterday's strong rally helped to eliminate a few of the possible wave counts from the April 26th high. Clearly, the decline from that high to last Thursday's low was three waves (a-b-c). As long as the April 26th high remains intact, the best count (in my opinion) for this week's rally is an "x" wave (see second chart). I put up a chart of the DJIA during 1990 (see third chart) to illustrate the type of pattern that may be unfolding. That pattern in 1990 was a triple three combination pattern (a-b-c-x-a-b-c-x-a-b-c). We are only in the first phase of that pattern if it is indeed unfolding. We'll see how long the current pattern mimics that one...I'll let you know if and when the current action deviates from the pattern. Finally, last Friday I pointed out that one indice (XMI) declined below its February 5th low...confirming in my mind that the rally from the February low was complete and that an important top was in place. Today, I noticed that the DJIA on a theoretical basis also declined below its February 5th low. So, that makes two (at least). |
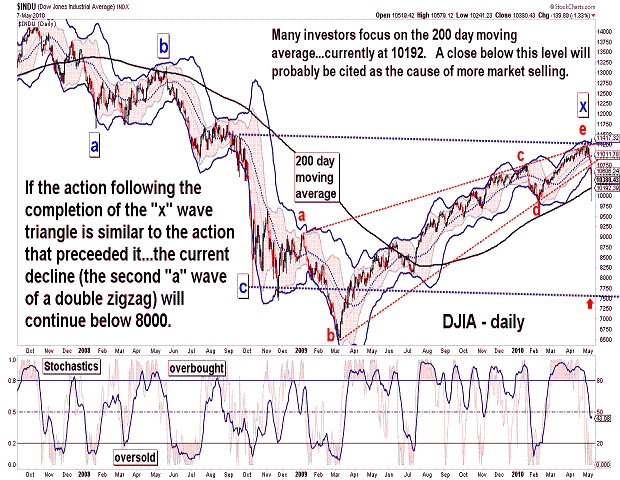
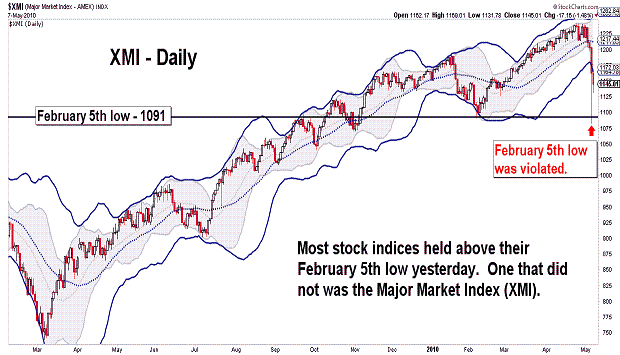
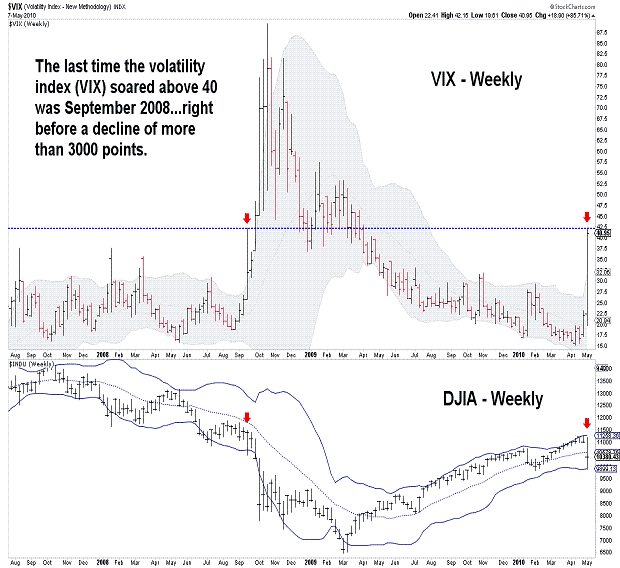
| May 7, 2010 update...An intermediate/long term decline is underway. The DJIA lost almost 6 percent this week; the NASDAQ lost almost 8 percent. If my wave count is correct, the markets should decline well into 2011...and the low of 2009 should be broken. During yesterday's roller coaster ride, most of the broad stock indices managed to hold above their February 5th lows...however, one major indice did not - the Major Market Index (XMI). In my mind, that price violation eliminates any possibility that the rally from February is incomplete. The April 26th "e" wave overthrow and reversal (as described in recent updates) was ideal in terms of my preferred wave count. The pattern from the April 26th high is only 9 days old and its structure can take various forms in the coming days and weeks. For example, today the DJIA could have been tracing out a 4th wave since yesterday's low with a 5th wave to come next week...or it could be the "x" of a more complex declining corrective pattern. We'll see. As you can see in the VIX chart (last chart above), market volatility has soared...and intraday action (in the DJIA) is now in the hundreds of point. So, while it is possible for the DJIA to close up over 100 points on any given day in the near term, I expect to see much lower prices in the coming weeks...especially after the DJIA's 200 day moving average (10192) is broken on a closing basis (see third chart above). |
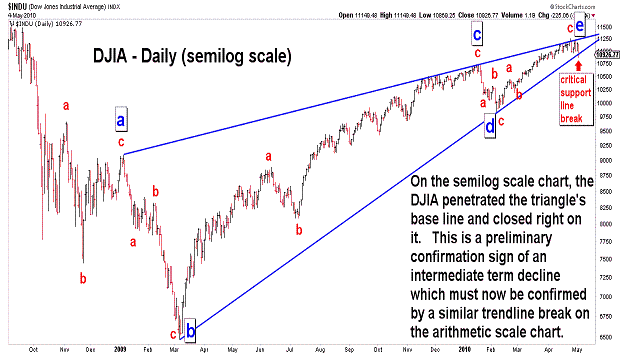
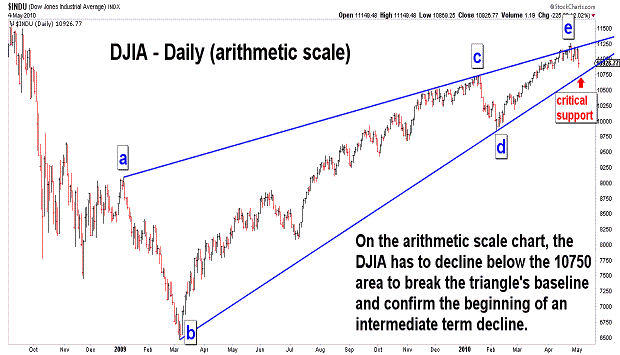
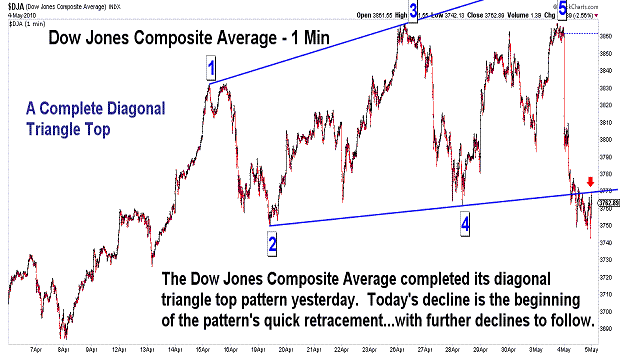
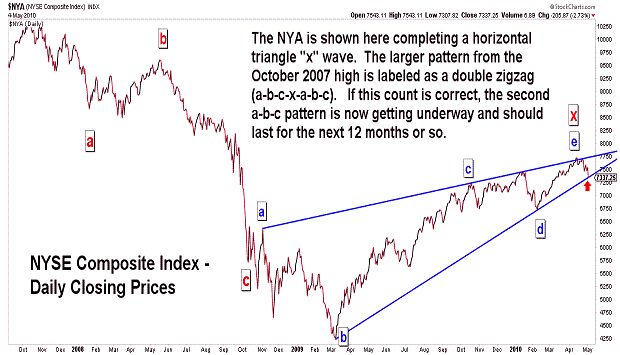
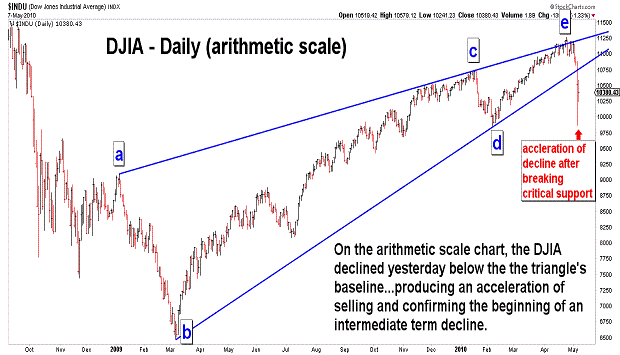
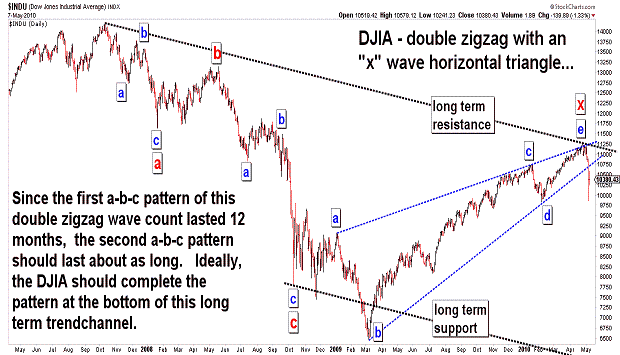
| May 4, 2010 update...Three days ago I said..."if my "b" wave horizontal triangle analysis is valid, we should see a break of the triangle's baseline in the coming days." The triangle's baseline WAS broken today on a semilog scale basis (see first chart)...providing the first step of a confirmation process for an intermediate term decline. Step 2 of the process will occur when support is penetrated on the arithmetic scale chart...currently around 10750 (see second chart). Please note on the fourth chart that the NYSE Composite today became the fist indice on an arithmetic scale to close on its (triangle baseline) support line. While the Dow Jones Industrial Average made its recent high 8 days ago, the Dow Jones Composite Average made its high yesterday...completing a diagonal triangle pattern (see third chart). Today's action was fully in line with the type of action that should follow the completion of this type of topping pattern. I expect to see more downside action in the coming days and weeks followed by brief rallies that retest support lines that are broken along the way down. |
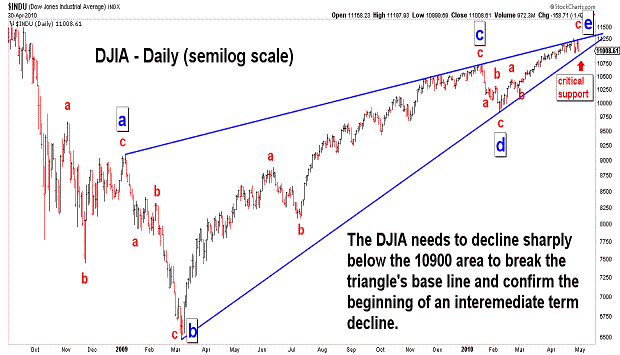
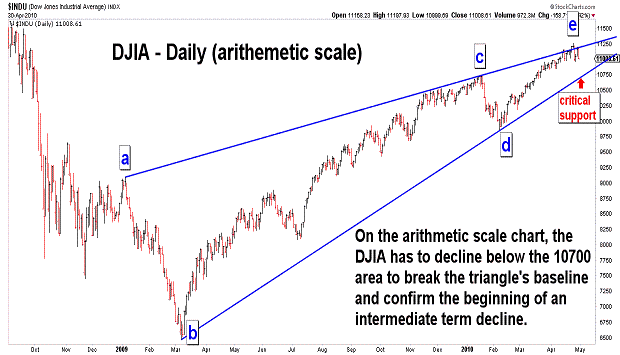
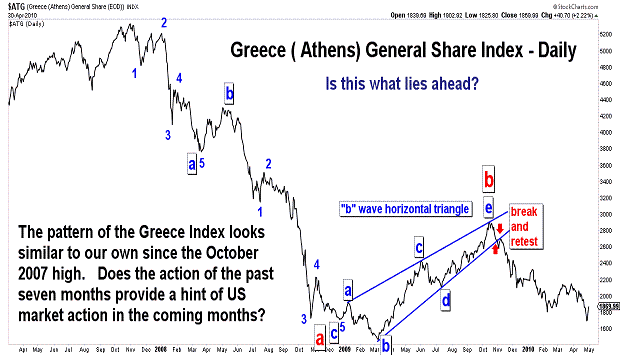
| May 1, 2010 update...Here are some charts updated through yesterday's close. Key support on the DJIA semilog scale chart is the 10900 area...key support on the DJIA arithmetic scale chart is the 10700 area. If my "b" wave horizontal triangle analysis is valid, we should see a break of the triangle's baseline in the coming days and then a retest. A much sharper decline would follow the retest. Take a look at the third chart which shows the Greece stock index. It may be providing a roadmap of market action to come. |
Important: Information and chart access provided herein is educational in nature and shall not, directly or indirectly, be construed as investment advice. No guarantees are made with respect to the accuracy of the information, opinions, predictions, etc. offered herein.
Copyright © 1997 - 2012. The Elliott Wave Chart Blog. All rights reserved. Email
|