|
Charts
IMPORTANT: Chart buy/sell signals are helpful in determining market support and resistance levels...and probable turning points. However, they are only useful if the analyst has a handle on the larger trend. Experience and judgment play a vital role in that determination ...as does Elliott wave analysis.
If a chart does not not appear when you click on the link, you may need to (1) enable javascript, and/or (2) disable pop up blocking for this site, or (3) right click on your mouse and open the link in a new tab or window. Charts will generally appear when you use Internet Exploer or Firefox. Do not use Google Chrome to view charts.
Contact us at info@wavechart.com if you have a question or comment. |
|

Elliott Wave Chart Blog May 2011 Archive
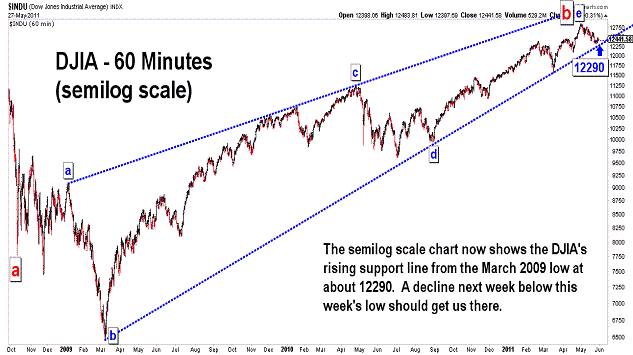
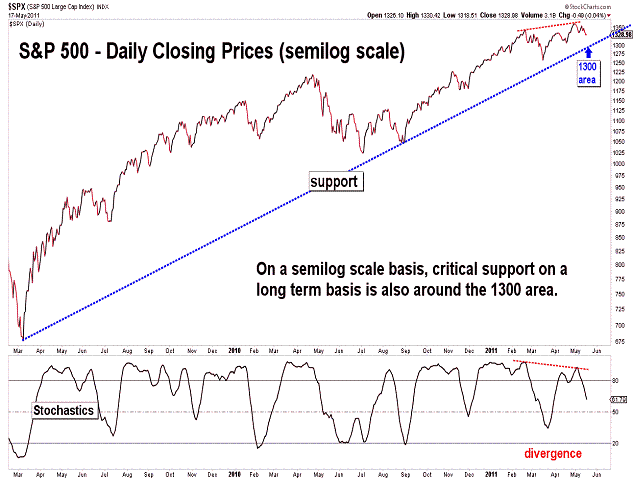
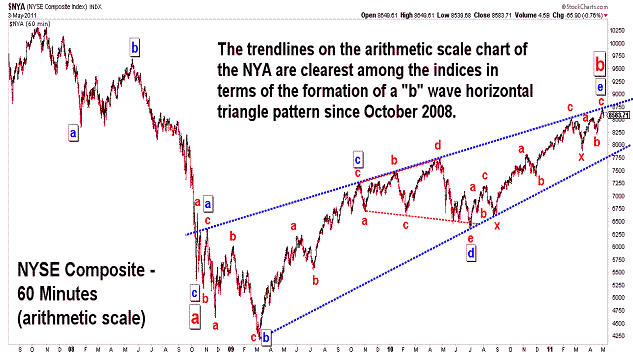
| May 28, 2011 update...As I said on Tuesday, I ordered a new computer online...and because of all the upgrades that I wanted, it won't arrive for several weeks. In the meantime, I will have to make do without my array of tools/utilities that I use for these updates. As I said on Friday, the market declined for the fourth straight week...something that last occurred almost two years ago, during the first correction after the March 2009 low. On a percentage basis, the decline so far has been modest. I am waiting for the market to break its support line from the March 2009 low for the decline to accelerate...first on a semilog scale basis...and then on an arithmetic scale basis. We probably have to wait for the break on the arithmetic scale chart for the real fireworks to begin. That may be some weeks from now. The action will likely be choppy until we get past that point. |
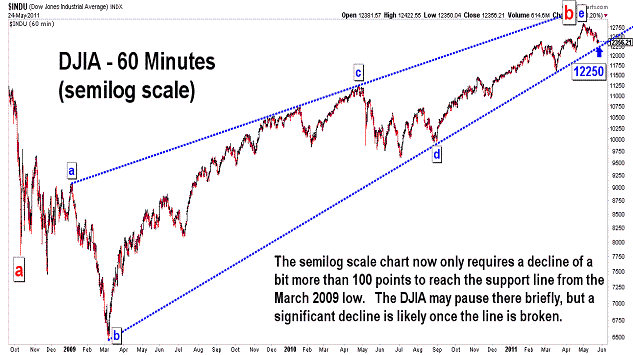
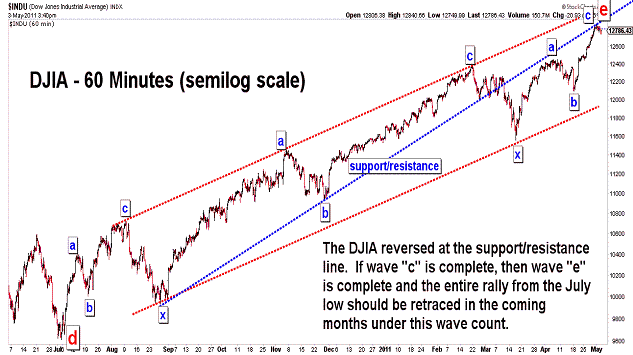
| May 24, 2011 update...What a day! No, not for the market. Just for me. My computer crashed and I will now have to spend hours retrieving data and setting up a new computer. I ordered one online today...and it will be two to three weeks before it gets built. In the meantime, I will be limited for the next few weeks in terms of updating this page. I will try to create and post one chart, at least, for each update during this time. As for the market, the DJIA is approaching an important support line (on the semilog scale chart). The DJIA will either pause there...or gap right through it. I don't think we will have to wait too long to see what happens. |
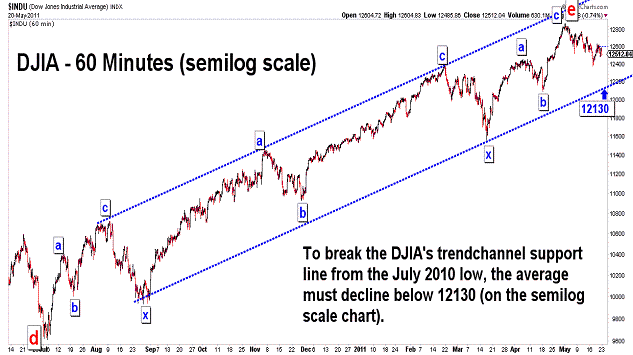
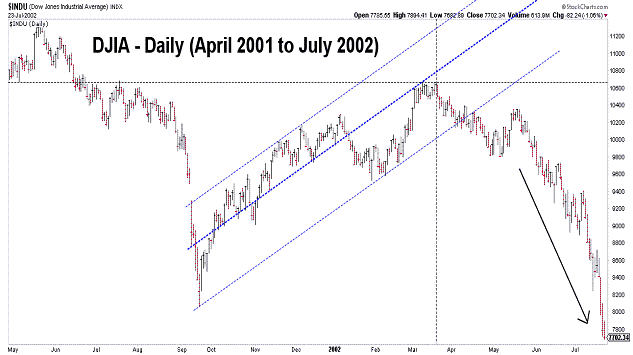
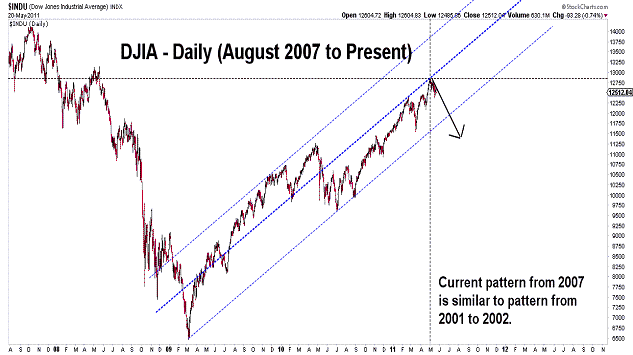
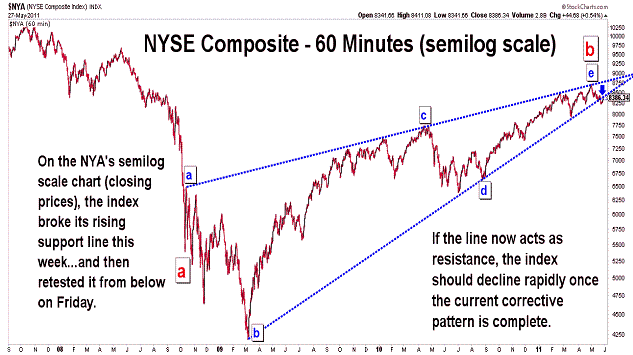
| May 21, 2011 update...The DJIA declined for the third week in a row. The last time that happened was August 2010...9 months ago. Since the March 2009 low, there have only been five occurences of three week declines...and just one occurrence of more than three weeks...a four week decline in June/July 2009. So, if something has changed in the market since the bottom in March 2009, we should know over the coming two weeks. As you can see in the last two charts (which I have posted previously), the market's pattern since the 2007 high closely resembles the market pattern of 2001-2002. That pattern suggests a contination of the decline in the coming months (with one intervening rally)...that will eventually take the DJIA below the March 2009 low. This pattern should be confirmed once the DJIA declines below its rising trendline from that 6469 low. |
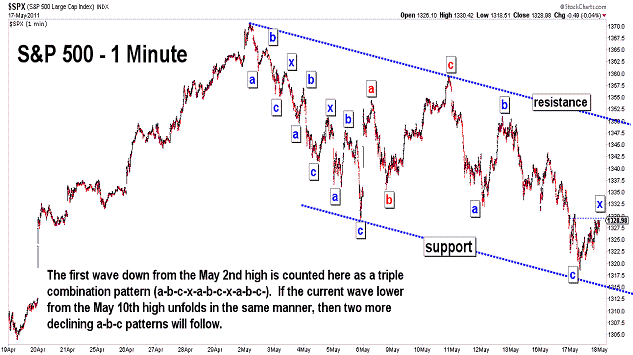
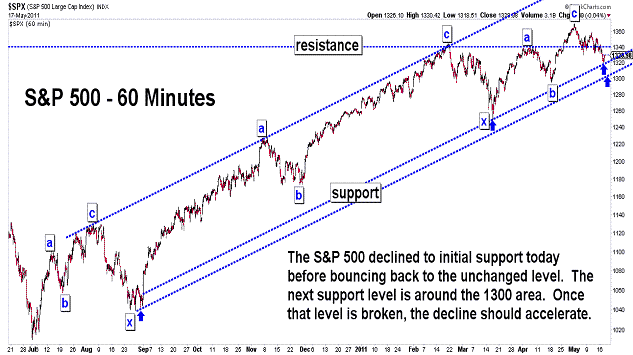
| May 17, 2011 update...I posted charts of the S&P 500 index today. While its pattern is similar to that of the DJIA, its levels of support and resistance do not exactly correspond to the DJIA's (or other indices for that matter) on any given day. As you can see in the second chart above, the S&P 500 did decline to one support line today, at which point it reversed and rallied back to the unchanged area. The DJIA, on the other hand, did not decline to its corresponding support line. This is one reason why it helps to look at a multitude of charts to determine the likely reversal points for the market each day. |
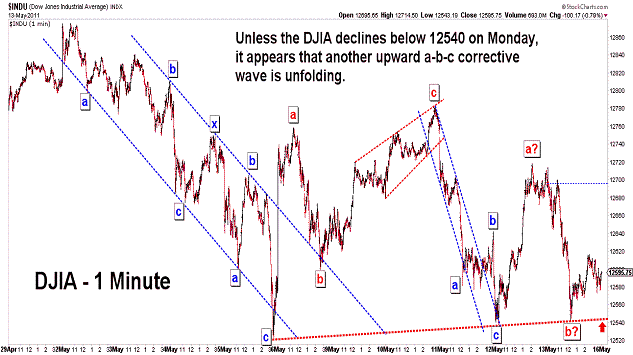
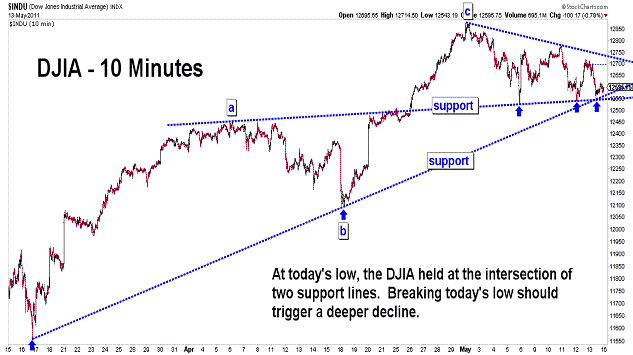
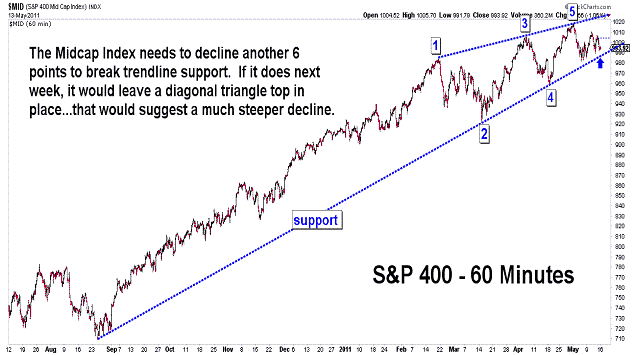
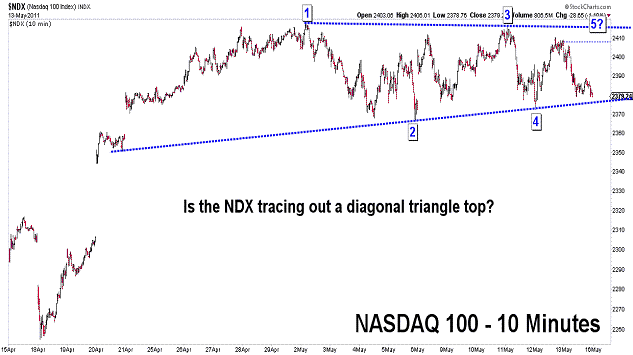
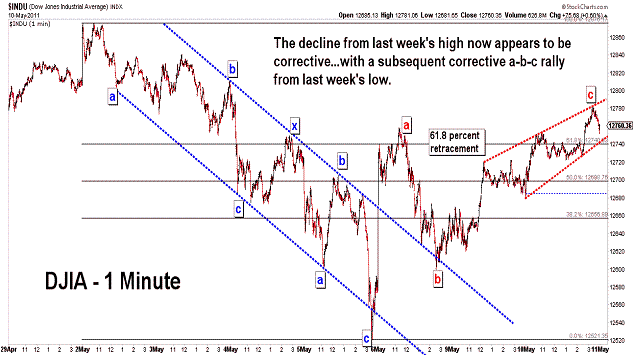
| May 13, 2011 update...The broad indices, for the most part, ended the week modestly lower. At today's mid-day low, the DJIA held and reversed at the intersection of two support lines (see second chart of DJIA above). If this support area is broken on Monday, a deeper decline should follow. Alternatively, the current pattern does allow for one more rally to the top of the range to complete a possible diagonal triangle pattern for some indices (see NDX chart above). A major decline would follow at that point. |
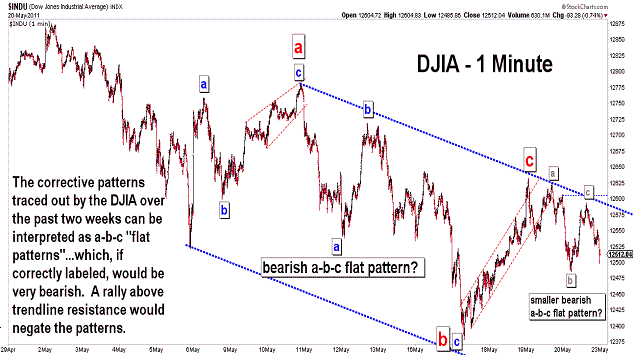
| May 10, 2011 update...On a short term basis, last Friday's primary count for the DJIA is still valid...and the alternate count was negated. The DJIA has been tracing out corrective patterns in both directions...which allow for multiple possibilities in the next several days. Hopefully, as the current short term pattern becomes more fully developed, the intermediate and long term patterns will clear up. |
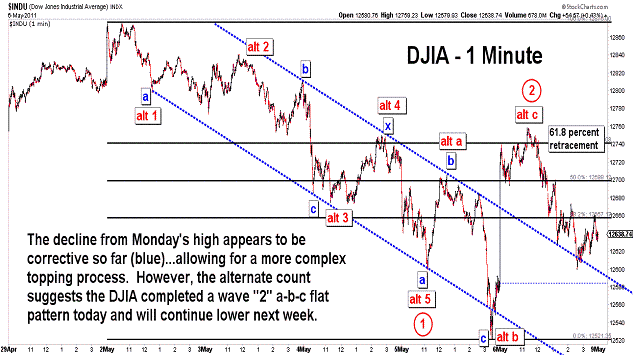
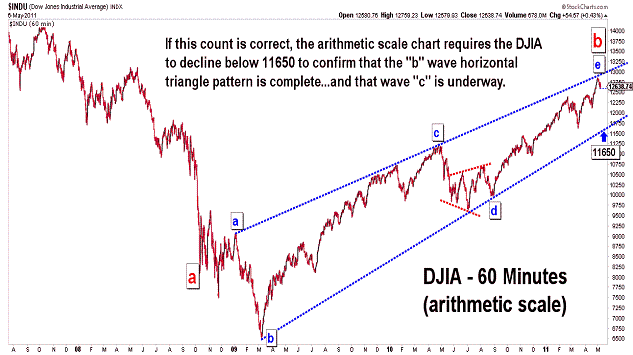
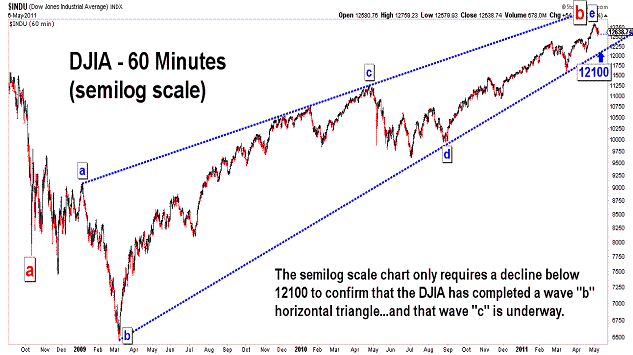
| May 6, 2011 update...Depending on the stock indice that you follow, the market was down from just under 1 percent to more than 3 percent for the week. One of the biggest losers for the week was the precious metals index which lost more than 9 percent...with silver losing more than 25 percent (I call that a "crash"). The pattern of the decline from Monday's high is ambiguous...and is subject to two basic wave count interpretations, which I labeled in the first chart above. More downside action is needed to confirm that the rally from last July/August (and the March 2009 low) is over. Until then, a more complex topping process cannot be ruled out. Tonight's charts point out some of the critical support levels to watch next week. |
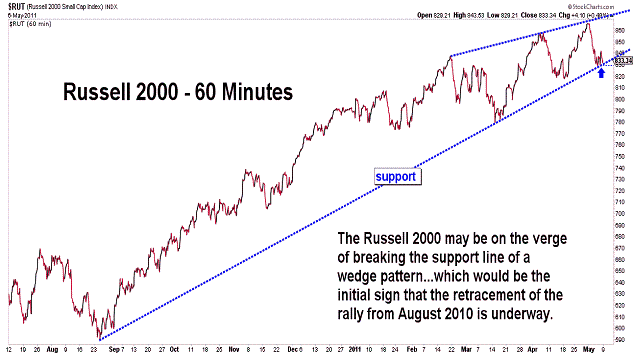
| May 3, 2011 update...While the DJIA is barely below its close of last Friday, some indices like the Russell 2000 (-2 1/2 percent) are down sharply for the week so far. If cycles and patterns are any indication, the DJIA will catch up and join other indices in a substantial decline in the coming months. A down close for the week would help to confirm that the selloff has begun. But, until then, a more complex topping process is still an option for the market. |
Important: Information and chart access provided herein is limited to current subscribers only and shall not be forwarded or retransmitted without written authorization. It is educational in nature and shall not, directly or indirectly, be construed as investment advice. No guarantees are made with respect to the accuracy of the information, opinions, predictions,etc. offered here in. The username/password provided to a subscriber is unique and it is the sole responsibility of the subscriber to protect the confidentiality of said username/password and to further protect it from any unauthorized use.
Copyright © 1997 - 2013. The Elliott Wave Chart Blog. All rights reserved. Email
|