|
Charts
IMPORTANT: Chart buy/sell signals are helpful in determining market support and resistance levels...and probable turning points. However, they are only useful if the analyst has a handle on the larger trend. Experience and judgment play a vital role in that determination ...as does Elliott wave analysis.
If a chart does not not appear when you click on the link, you may need to (1) enable javascript, and/or (2) disable pop up blocking for this site, or (3) right click on your mouse and open the link in a new tab or window. Charts will generally appear when you use Internet Exploer or Firefox. Do not use Google Chrome to view charts.
Contact us at info@wavechart.com if you have a question or comment. |
|

Elliott Wave Chart Blog June 2010 Archive
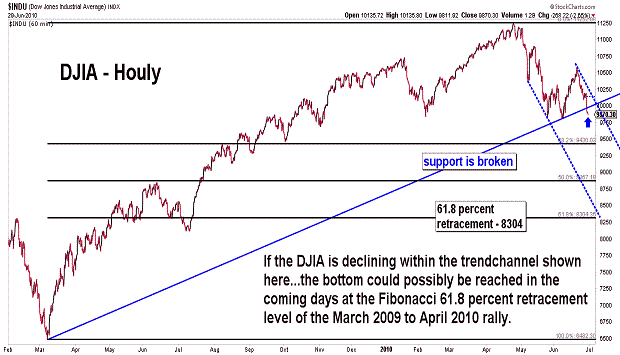
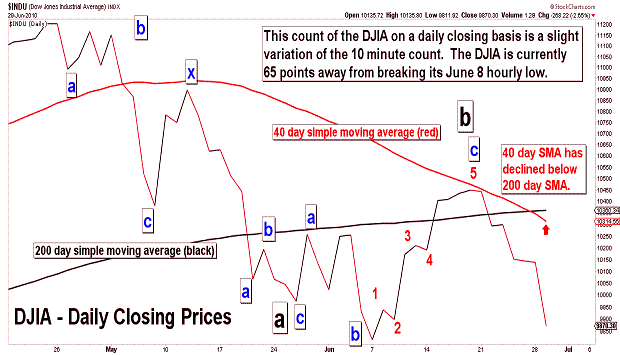
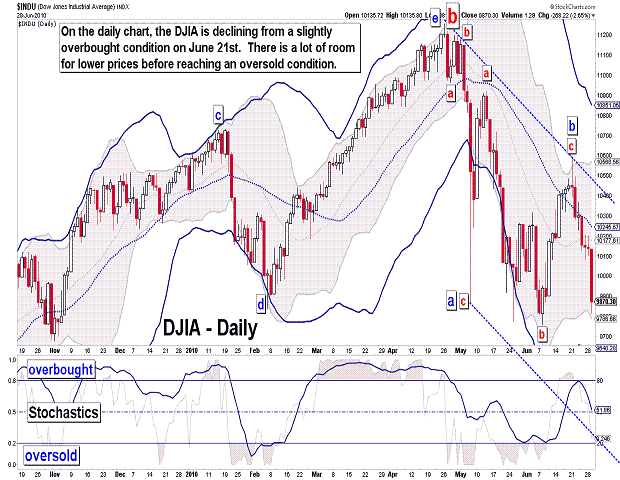
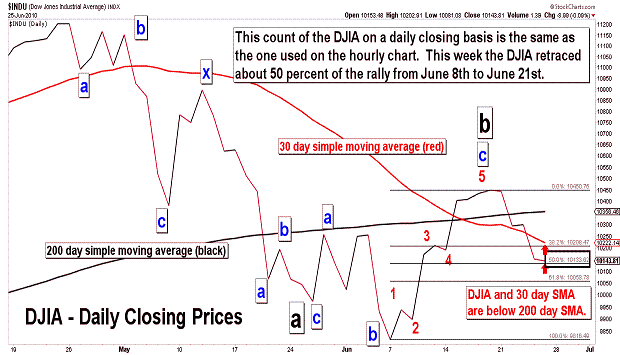
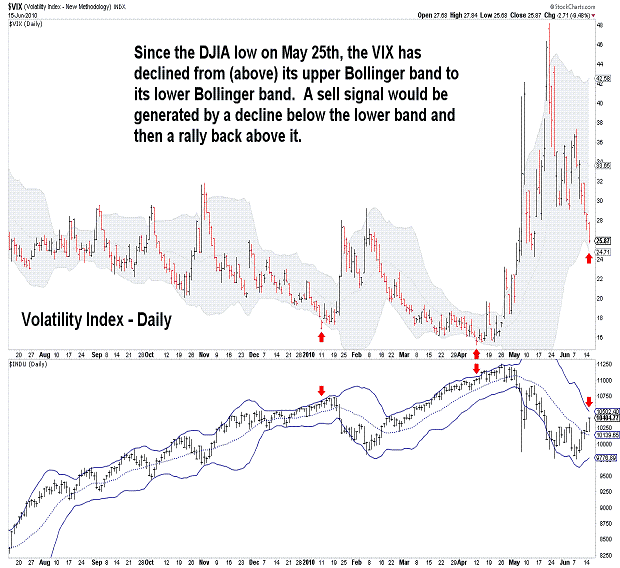
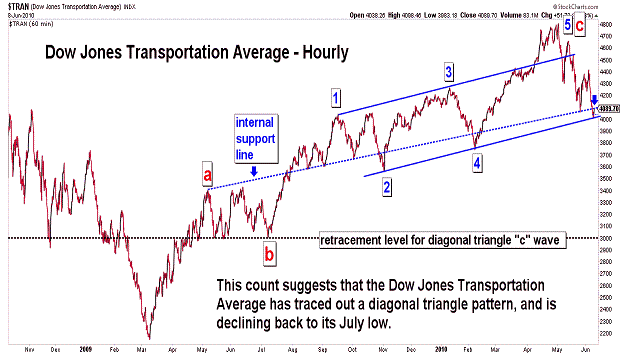
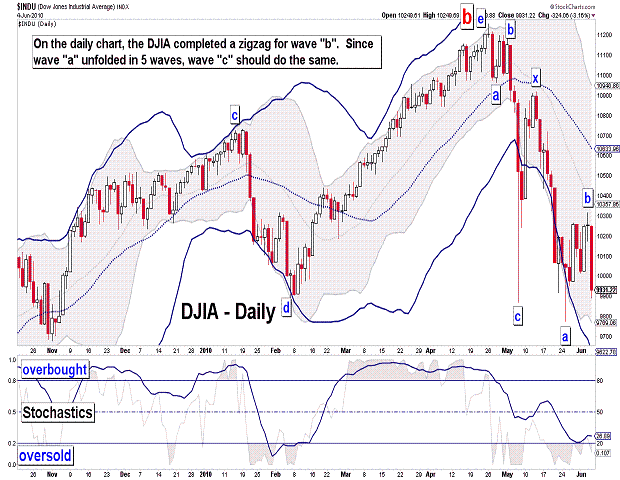
| June 29, 2010 update...A number of broad market indices made new lows for the year today (i.e., NASDAQ Composite, OEX, SPX, XII). Others should follow in short order. Assuming the DJIA is declining in a "c" wave pattern as I have labeled it in the charts above, the current decline should take the average to the 8700 - 9400 target that I have discussed in recent updates. As the hourly chart above indicates, it is even possible for the present decline to reach the 8300 level...i.e., the 61.8 percent retracement point of the March 2009 to April 2010 advance. We'll see! In any event, the current market decline, as the fifth chart shows, has only reached neutral territory and can decline substantially more before reaching oversold territory (on a daily basis). |
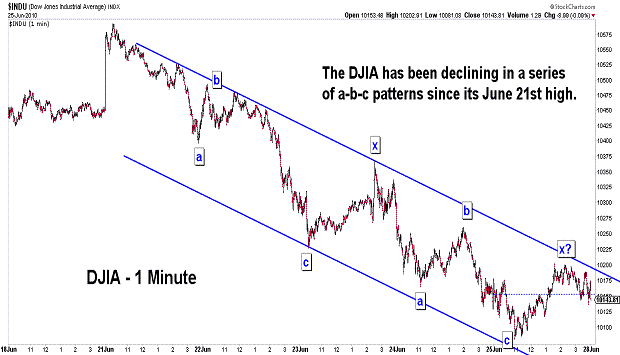
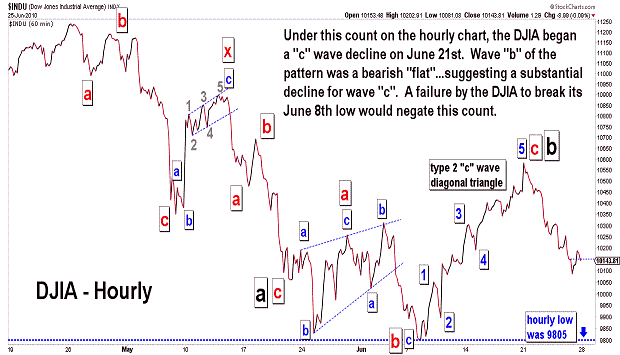
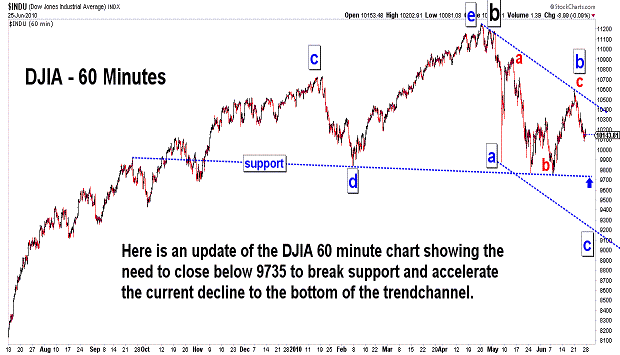
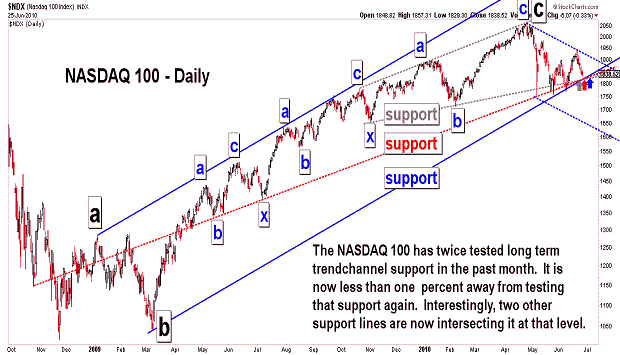
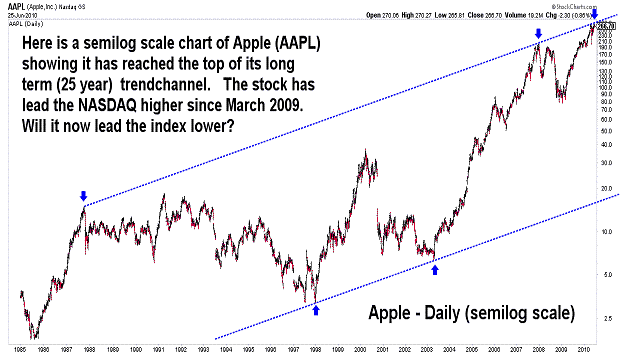
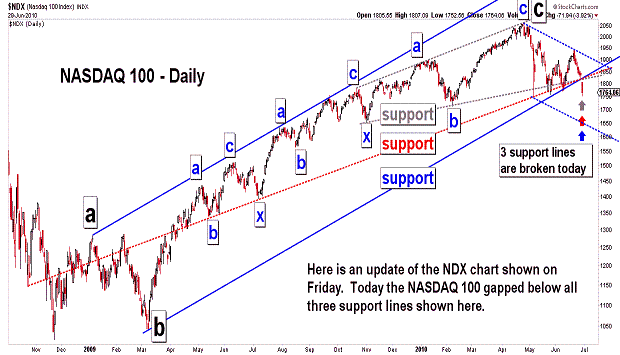
| June 25, 2010 update...The DJIA lost about 3 percent this week...the NASDAQ about 4 percent. Both declines engulfed last week's gains on their respective weekly candlestick charts. For candlestick chartists, an engulfing pattern is very bearish. What else is bearish? Interestingly, except for Apple (until this week - see AAPL chart), most of the top 10 NASDAQ 100 stocks. Looking over their individual stock charts, they look very weak (See APPLE - 16.50%, MICROSOFT - 4.91%, QUALCOMM - 4.73%, GOOGLE - 4.67%, ORACLE - 2.98%, CISCO - 2.96%, TEVA - 2.58%, INTEL - 2.39%, RIMM - 2.29%, GILEAD - 2.24%). As suggested by the AAPL chart above, a reversal in that stock (the most heavily weighted stock in the NASDAQ 100 index) should provide the impetus for more (accelerated) downside action. We'll see! In terms of the DJIA, the key level is still the June 8th low of 9757. Once that level is breached the next phase of the intermediate term decline will be confirmed. |
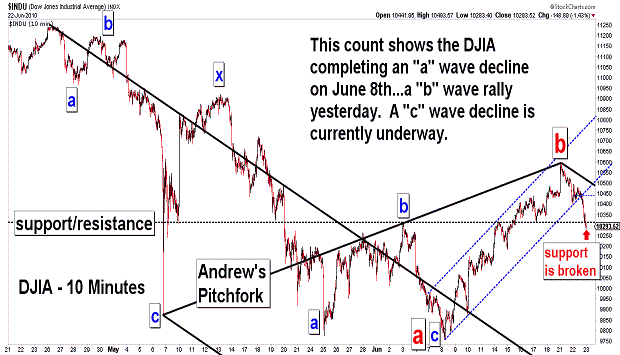
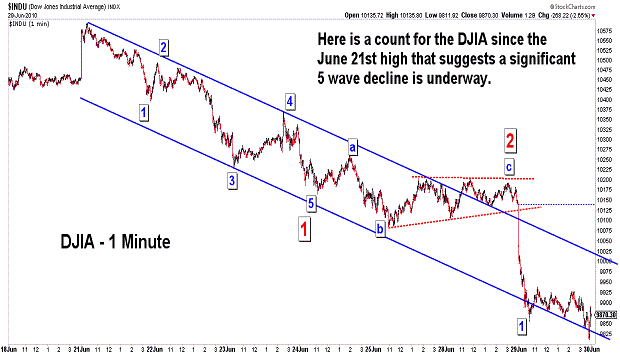
| June 22, 2010 update...I am leaving shortly to attend my daughter's high school graduation...so tonight's update will be abbreviated. On Friday, I indicated that yesterday was the 55th Fibonacci day from the April 26th top...and that it just might coincide with a high and a reversal in trend. In fact, yesterday's key reversal day was followed today by a nice 1 1/2 percent decline in the DJIA. Assuming wave "c" is now underway, a MAJOR decline has just begun. The key level to watch now is the June 8th low of 9757. The DJIA has to slice right through that level in the coming days...or more boring sideways corrective action will follow. |
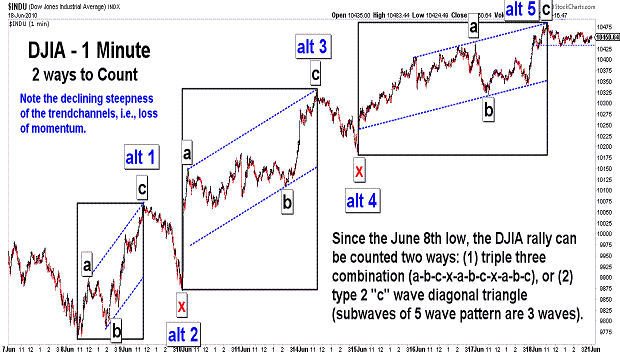
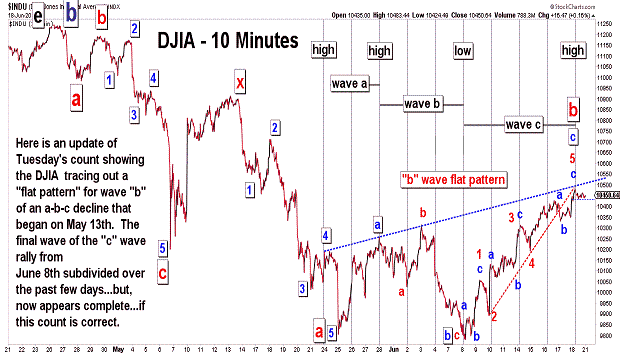
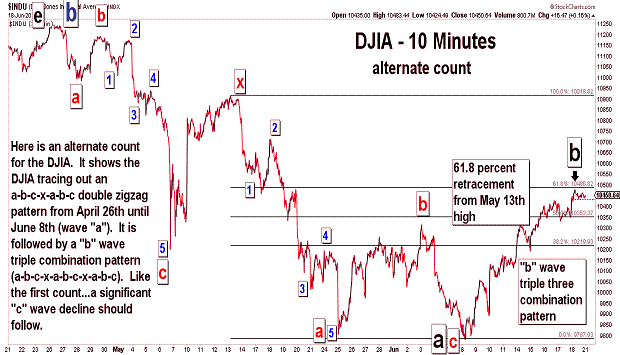
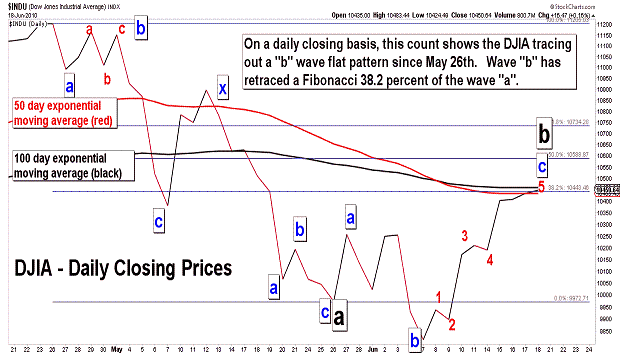
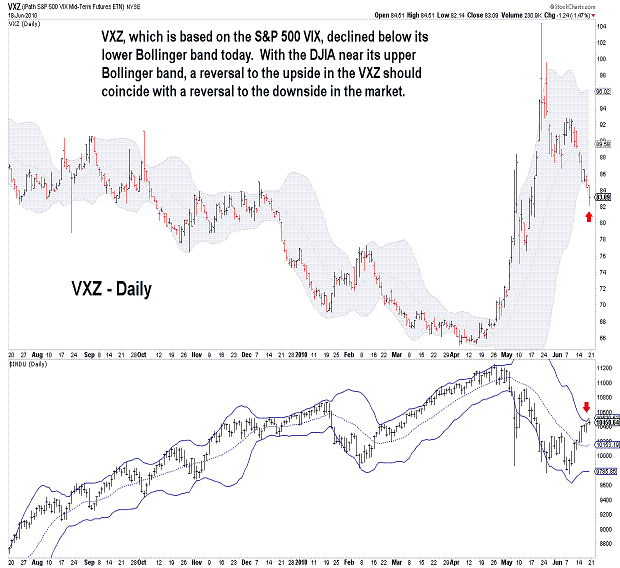
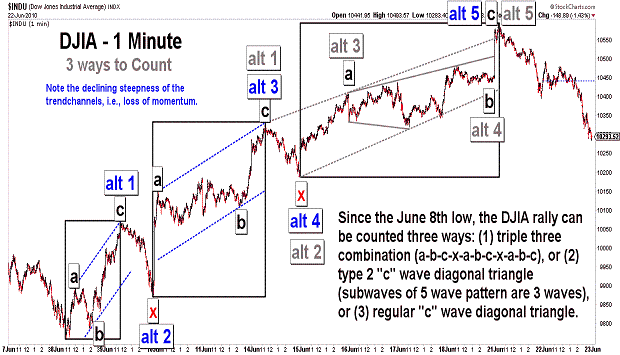
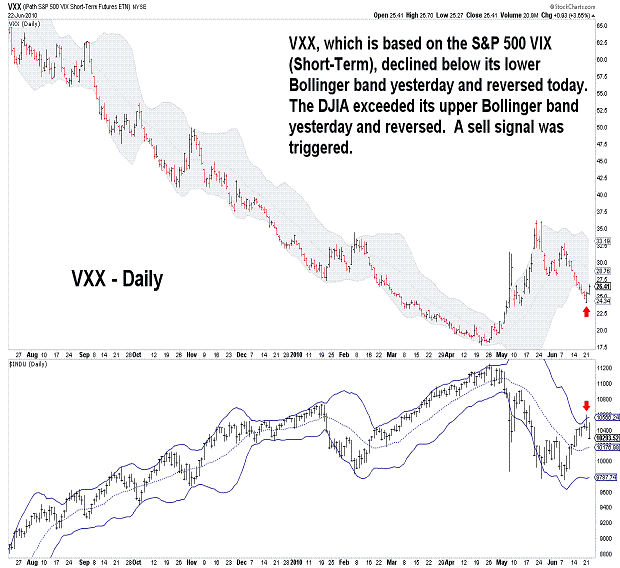
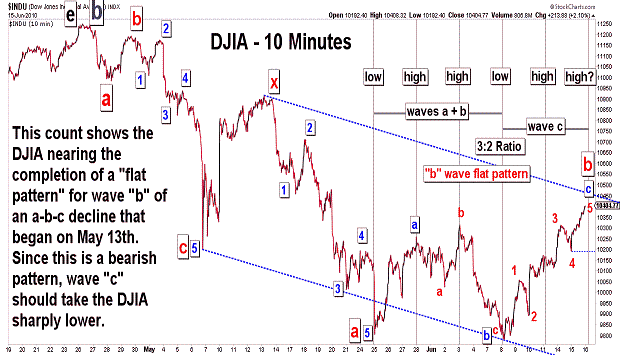
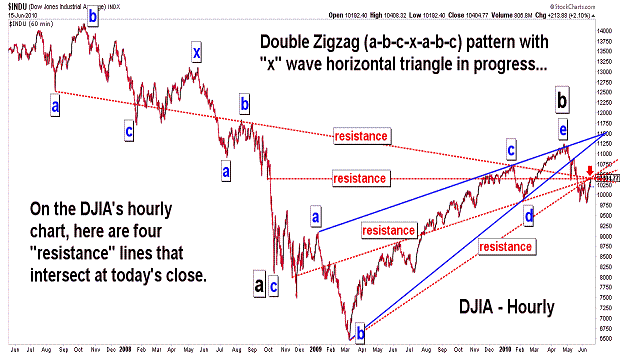
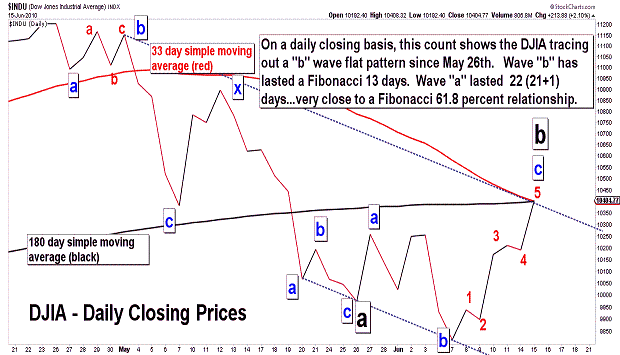
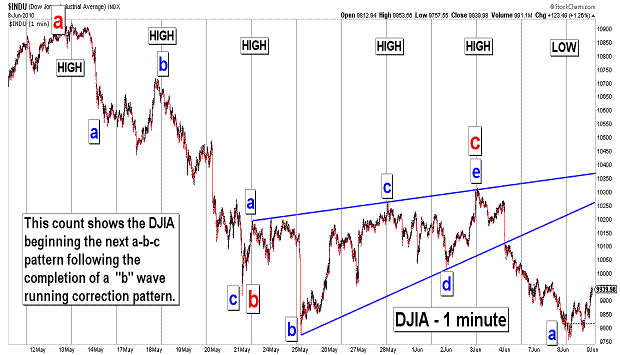
| June 18, 2010 update...On Tuesday, I thought a downside reversal was imminent. Instead, the final wave of the rally from the June 8th low subdivided and extended into today's action. As you can see in the first chart above, the pattern of that 8 day rally can now be counted as complete...in two different ways. With (1) the completion of three alternate wave counts (see second, third and fourth charts)...and with (2) a number of short term technical indicators diverging at today's high...and with (3) the DJIA near its upper Bollinger band on the daily chart, a reversal to the downside next week should be a done deal. Anything other than that means a more complex wave pattern is unfolding...with several more wave subdivisions to come before a top. As I mentioned in recent updates, Monday is the 55th Fibonacci day since the April 26th top. A few weeks ago I thought it would be a low...maybe now it will turn out to be a high. We'll see. |
| June 15, 2010 update...Last Friday, I offered three possible wave counts for the DJIA given the form of the rally from the June 8th low. After the action of the past two days, one count now seems to be best...and it suggests that a major reversal to the downside is imminent. Assuming the DJIA turns lower tomorrow and quickly declines below yesterday's low of 10186, it becomes very likely that a wave "c" decline to 8700 to 9400 is underway. There are, I must admit, a few wave count possibilities that delay the beginning of the wave "c" decline...but, even so, the current rally is probably nearly complete. If wave "c" does not begin, we are likely to see more sideways action for the next few weeks...with a more complex wave "b" pattern unfolding. |
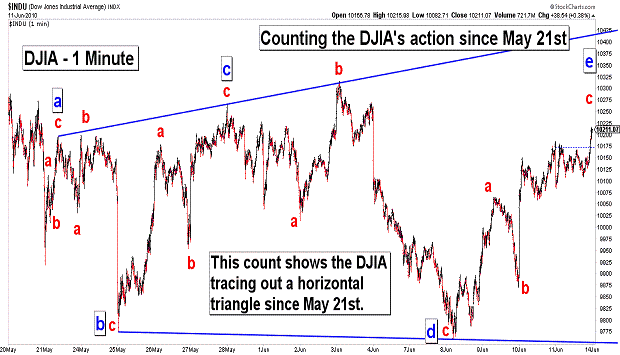
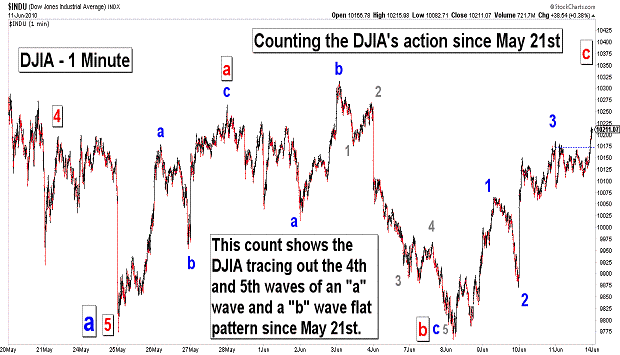
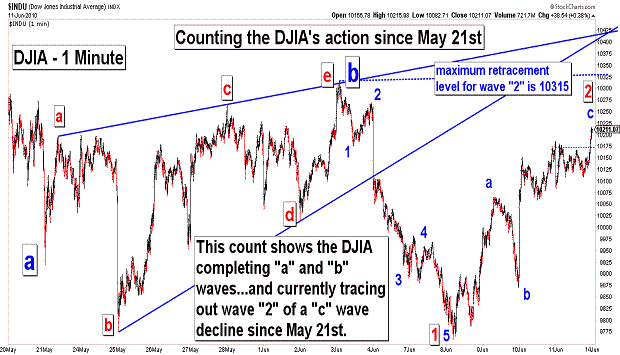
| June 11, 2010 update...On
Tuesday, I suggested that the DJIA was tracing out the second wave of a "c" wave decline that began on June 3rd. That may still be the case...however, there are several other possible wave counts that may also develop over the next few days. The first three charts above show the primary wave count alternatives. The main difference between the three counts lies in the extent of the rally since June 8th. One count does not permit a rally above 10315...the other two counts do. The bottom line, however, is that they all eventually resolve on the downside. I am sticking to my target of 8700 to 9400 for now. Given the pace of the pattern since the June 3rd high, I am starting to have reservations about the likelihood of a bottom by June 21st (see the past two updates for details). But, we shall see! |
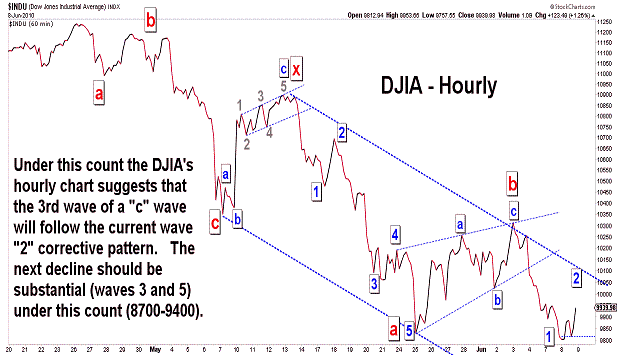
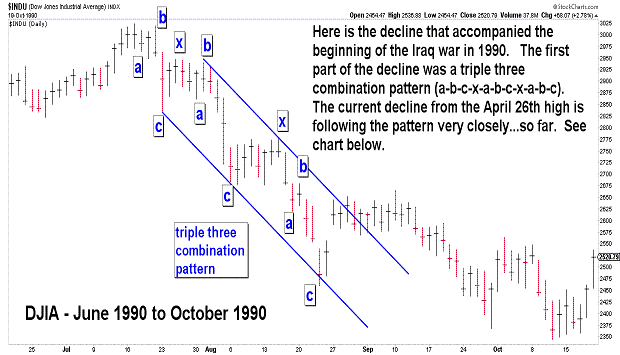
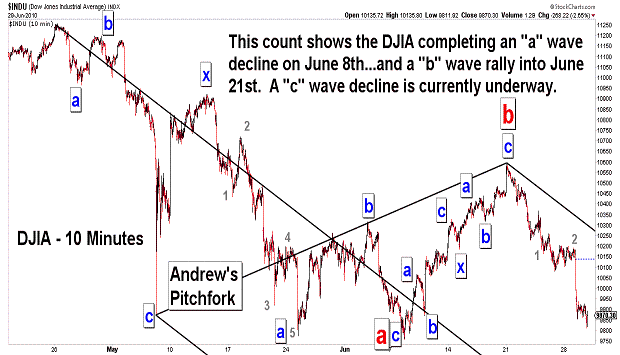
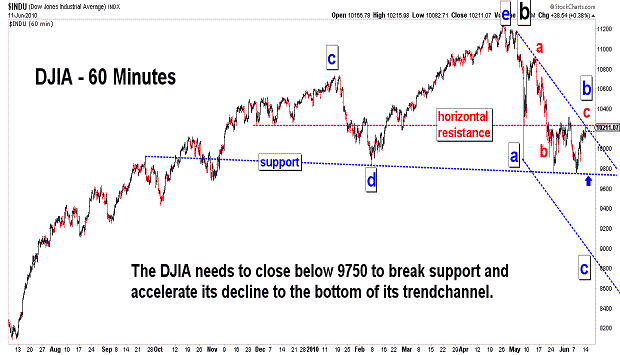
| June 8, 2010 update...The market has continued to follow the 1990 pattern that I discussed in the May 11th update (see last two charts above). The pattern currently suggests that the DJIA is tracing out a "c" wave decline...which should take it to the bottom of its declining trend channel in the coming days (in 5 waves). Today's rally appears to be wave 2 of "c". Once complete, a significant wave "3" decline should follow. Last Friday, I mentioned June 21st as a likely Fibonacci reversal date (55 Fibonacci days from the April 26th high). Let's see if that date coincides with a final 5th wave decline for wave "c". |
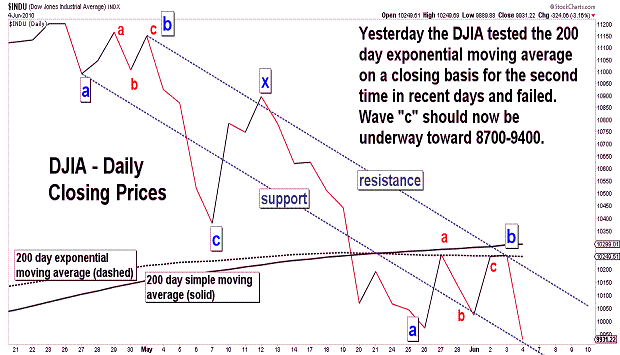
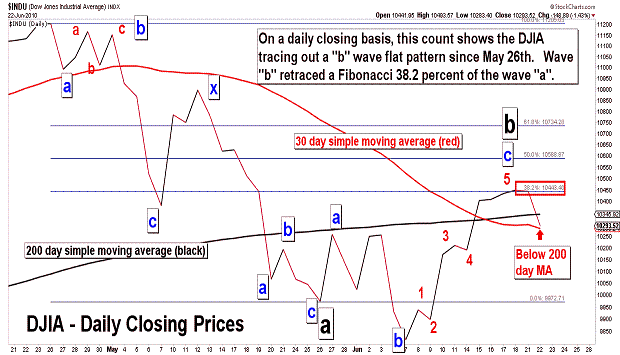
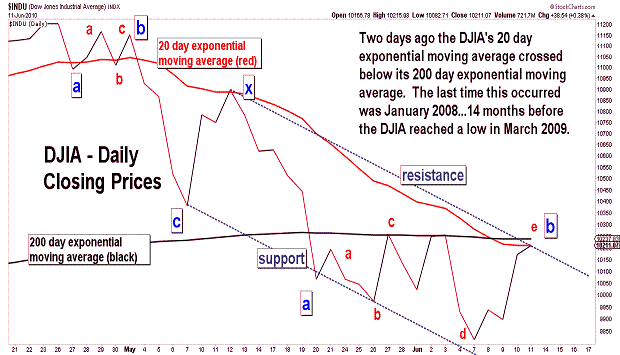
| June 4, 2010 update...I had thought, as you can read in Tueday's update, that a wave "c" decline had begun last Friday...after the DJIA had tested its 200 day moving average. Instead, following Tueday's decline, the market reversed to the upside and the DJIA retested its 200 day moving average yesterday. A major decline followed today...and (again) I think that wave "c" is finally underway toward 8700 to 9400. In the charts above, I offer two slightly different wave counts. They both, however, suggest the same bearish outcome...a substantial decline in the coming days. I noted in the last chart the date June 21st. That day is the 55th Fibonacci day from the April 26th high. During 1987, it took exactly 55 Fibonacci days to go from the August high to October crash low. The pace of the market's decline since April 26th would seem to suggest that a low (although not a final low IMO) around June 21st is quite possible. |
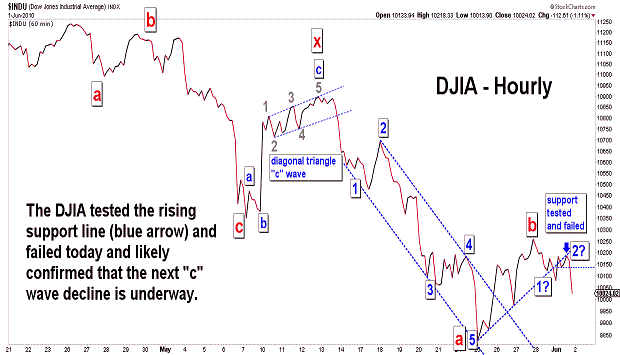
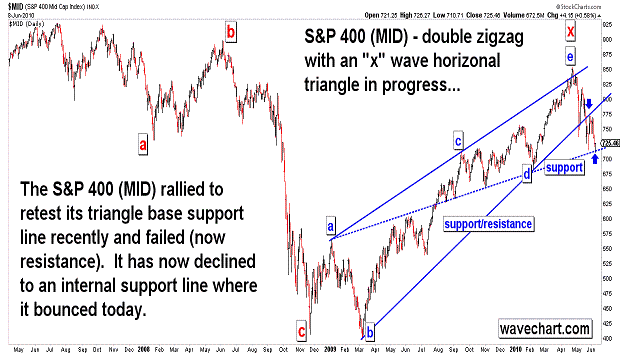
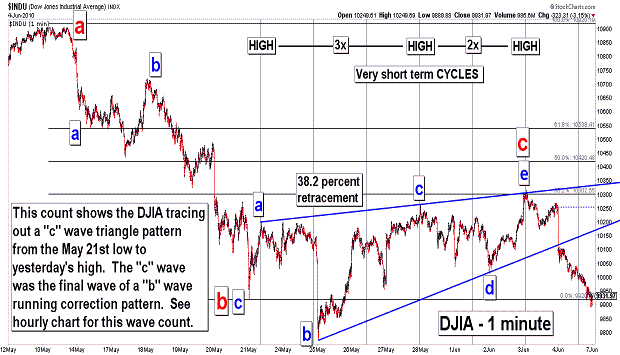
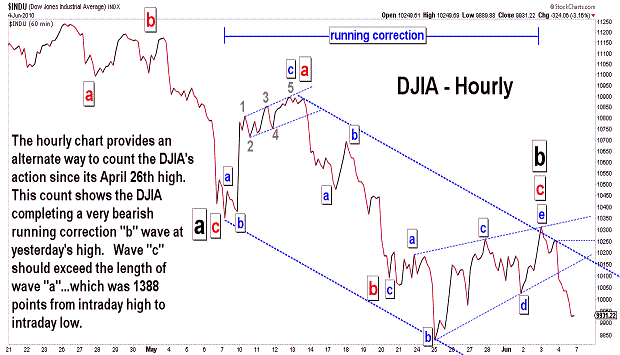
| June 1, 2010 update...Because of yesterday's holiday, I only posted one chart tonight. The DJIA opened weakly this morning...down almost 100 points. It then rallied to its high of the day around 1:30 pm...up about 82 points. From there, the market weakened and ended near its lows...down 112 points. As the chart above shows, the DJIA failed and reversed at its near term support line...confirming (I believe) that the next wave "c" decline is underway. How far wave "c" takes the DJIA will depend on a test and reaction (assuming it, in fact, comes) by the average of its recent low of 9774. The DJIA's initial "a" wave from the April 26th high was small relative to the large "c" wave that followed. The recent second "a" wave was also large (comparable to the preceeding "c" wave)...so, one possibility is that the current "c" wave will be small...and hold not too far below 9774. If that happens, the DJIA will complete a double zigzag pattern and a sizeable rally will follow. The other possibility is that the DJIA will trace out a much more significant decline below 9774 (to the 8700-9400 area)...and confirm that a more substantial intermediate term decline is unfolding. A rally above 10264 would negate both possibilities. I think the action over the next few days will be important in discerning the correct wave count. |
Important: Information and chart access provided herein is educational in nature and shall not, directly or indirectly, be construed as investment advice. No guarantees are made with respect to the accuracy of the information, opinions, predictions, etc. offered herein.
Copyright © 1997 - 2012. The Elliott Wave Chart Blog. All rights reserved. Email
|