|
Charts
IMPORTANT: Chart buy/sell signals are helpful in determining market support and resistance levels...and probable turning points. However, they are only useful if the analyst has a handle on the larger trend. Experience and judgment play a vital role in that determination ...as does Elliott wave analysis.
If a chart does not not appear when you click on the link, you may need to (1) enable javascript, and/or (2) disable pop up blocking for this site, or (3) right click on your mouse and open the link in a new tab or window. Charts will generally appear when you use Internet Exploer or Firefox. Do not use Google Chrome to view charts.
Contact us at info@wavechart.com if you have a question or comment. |
|

Elliott Wave Chart Blog June 2011 Archive
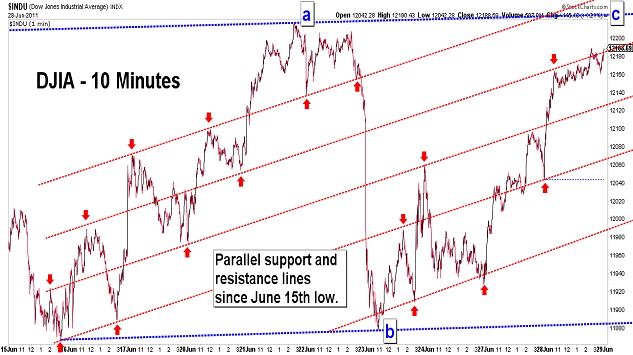
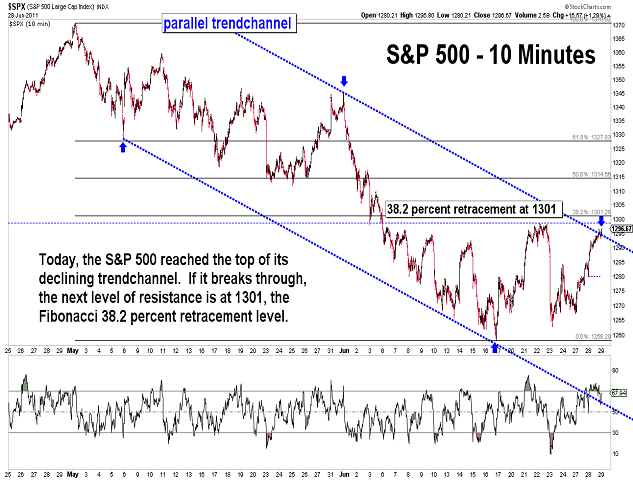
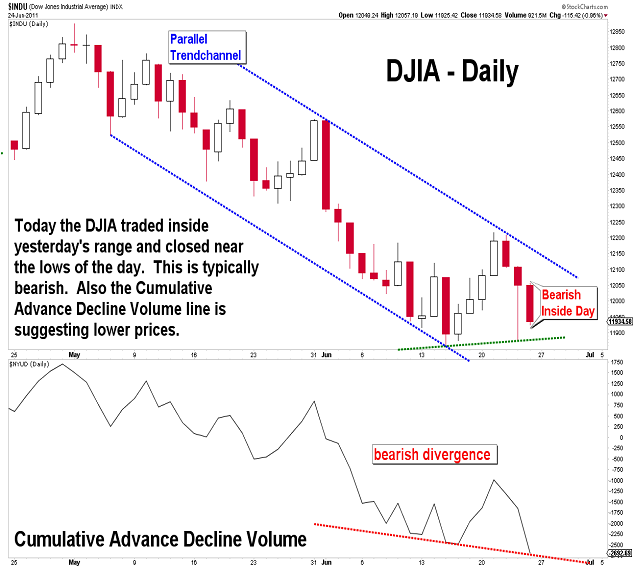
| June 28, 2011 update...Last Friday I said, "(o)nly a strong upward reversal on Monday would help to postpone (the) inevitable" break of the DJIA's long term support line. Yesterday's rally certainly did just that. Today's follow through rally suggests the market is tracing out an a-b-c corrective pattern, which...when complete...should lead to the next (and more devastating) phase of the intermediate decline from the May highs. |
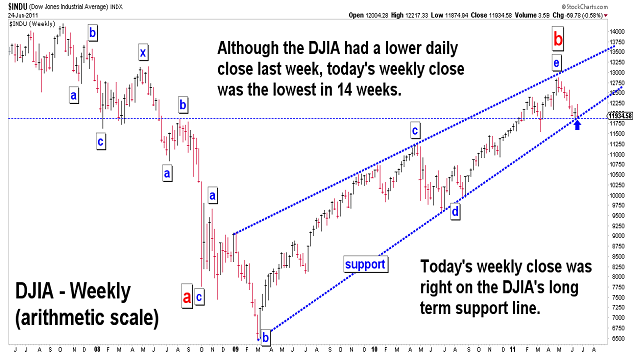
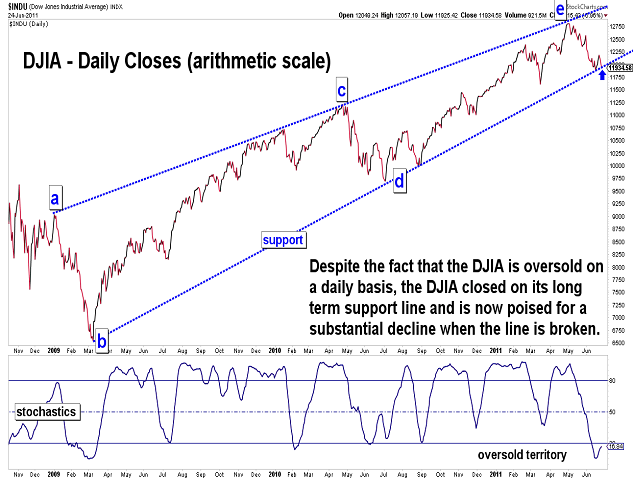
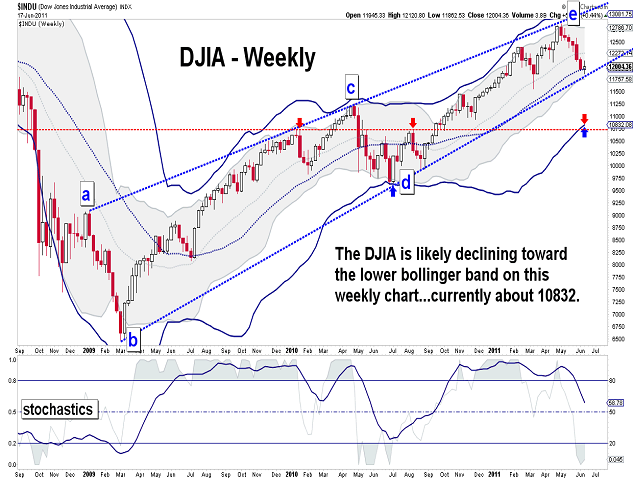
| June 24, 2011 update...Despite the market's oversold condition after almost two months of declines, it is now poised for more significant declines next week if this week's lows are broken. The DJIA closed right on its long term support line from the March 2009 low...and I expect "crash-type" action to follow once it is broken. There is initial support on the weekly chart around 10900-11000. Only a strong upward reversal on Monday would help to postpone this inevitable event for a period of time. |
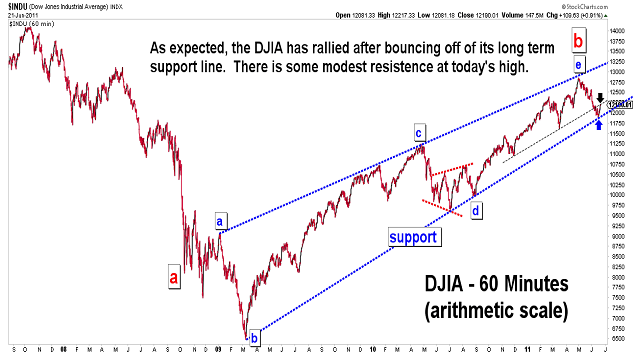
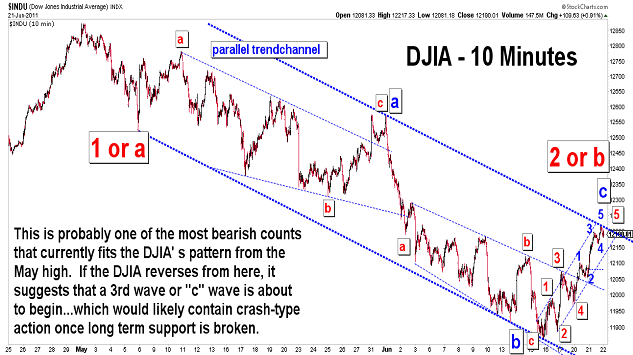
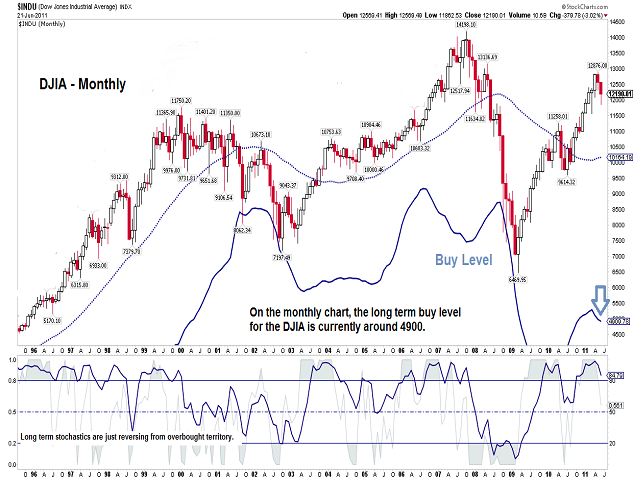
| June 21, 2011 update...Market trends frequently change with the season. Is the current four day rally about to end as summer begins? For the past month or so, I suggested that the DJIA's decline from the May high was likely to lead to a test of its long term support line from the March 2009 low...and it did so last week. Last Friday, I said that it was "too soon to determine how long the DJIA (and other indices) will consolidate before resuming the decline"...but that once the long term "support line is broken, the decline should accelerate." I still expect that to happen in the coming days/weeks. As you can see in the monthly chart above, the DJIA has a lot of room to decline if I am correct in my forecast that a major long term bear market is just getting underway. Currently, the buy level on the monthly chart is at 4900. We'll see in a year or so whether that buy line was accurate. |
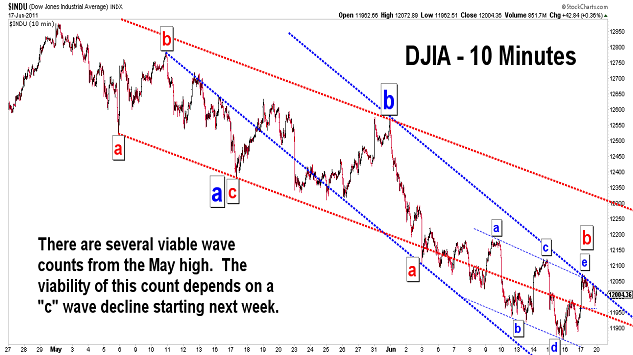
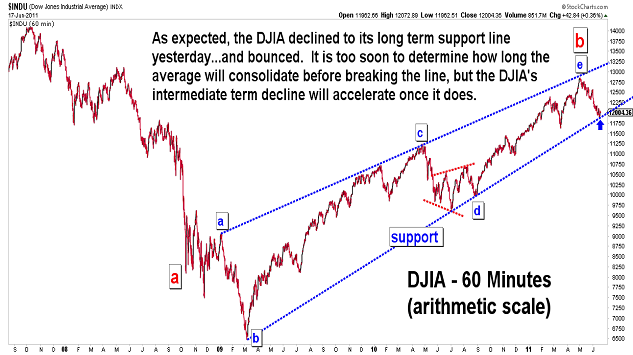
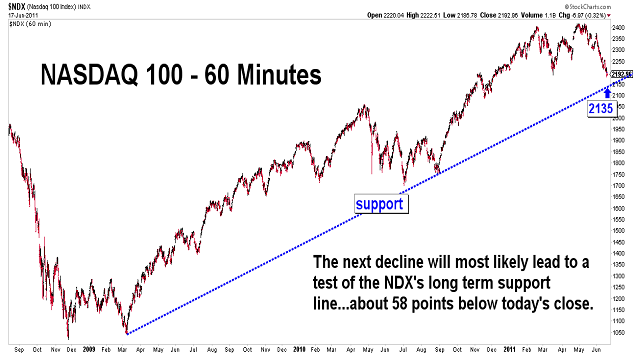
| June 17, 2011 update...As expected, the DJIA declined to its long term support line...and then bounced. After finally closing positively for the week, it is too soon to determine how long the DJIA (and other indices) will consolidate before resuming the decline from the May high. Once the support line is broken, the decline should accelerate...and I expect some crash-like action along the way. |
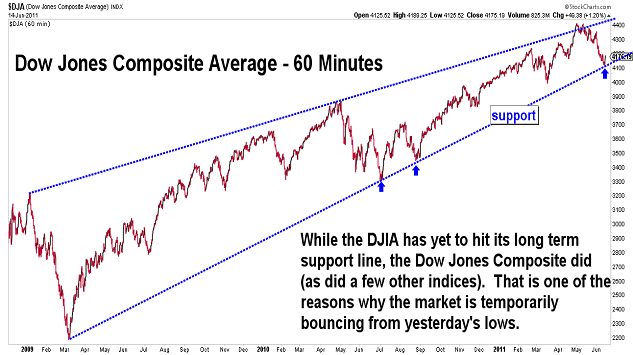
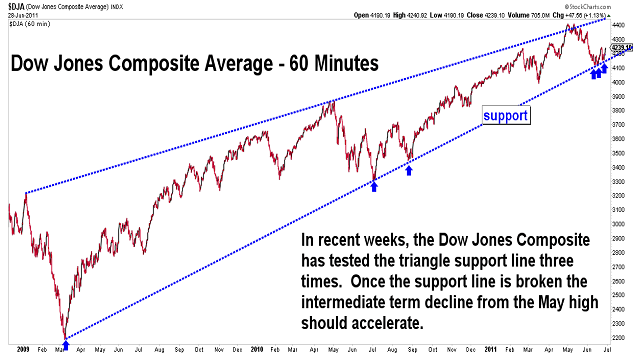
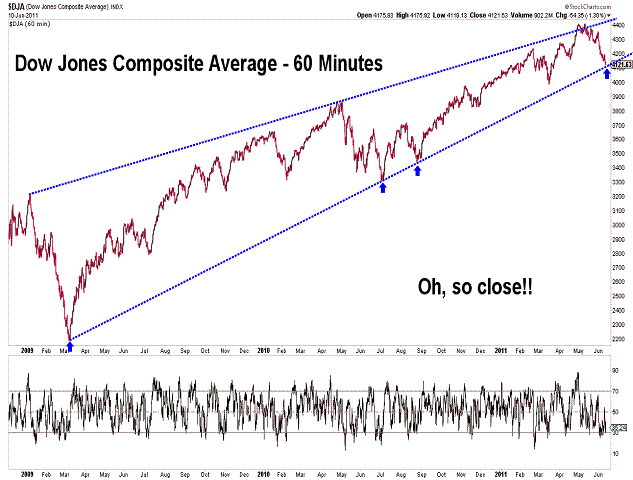
| June 14, 2011 update...While the DJIA did not quite decline all the way to its long term support line this week, the Dow Jones Composite Average did (as did a few others). Thus, today's short-term bounce. Once the market reverses and declines below yesterday's lows, the DJIA and other indices will test their long term support lines as well. When all of the indices break this support line, the fireworks should (most likely) begin. By the way, I finally received my new computer today and am working as fast as I can to set it up and transfer all of my (stock market) data from the old system. |
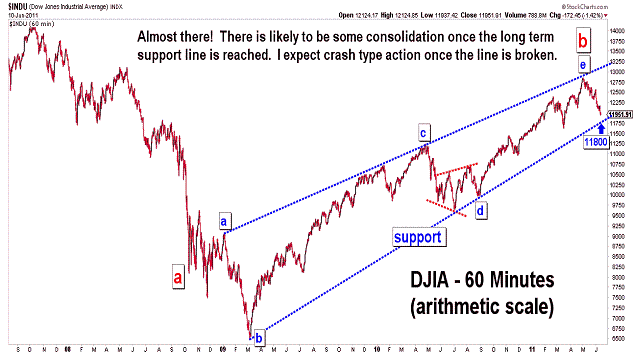
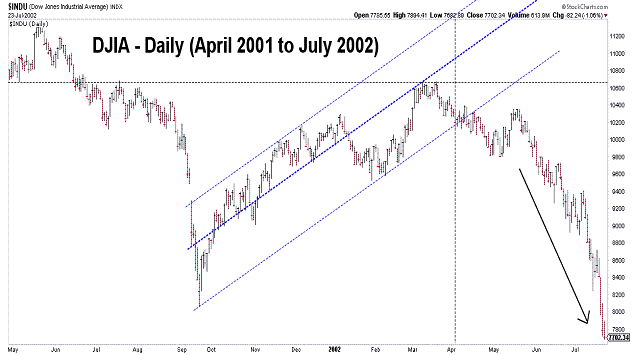
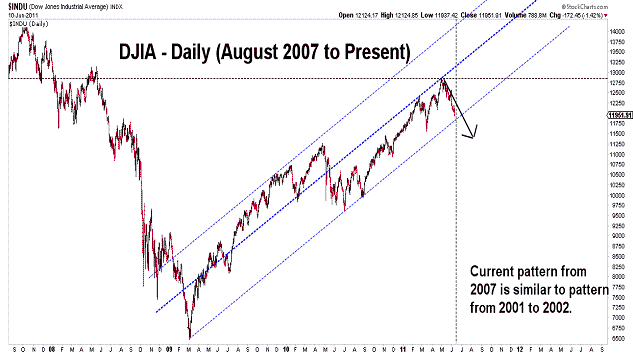
| June 10, 2011 update...After six weeks of declining, the DJIA is very close to reaching its long term support line from the March 2009 low. We should get there next week. After that, a period of consolidation is likely. But, when the line is finally broken, I expect crash like action...probably, like the "flash crash" of May 2010. The overall pattern still looks very much like 2001-2002. |
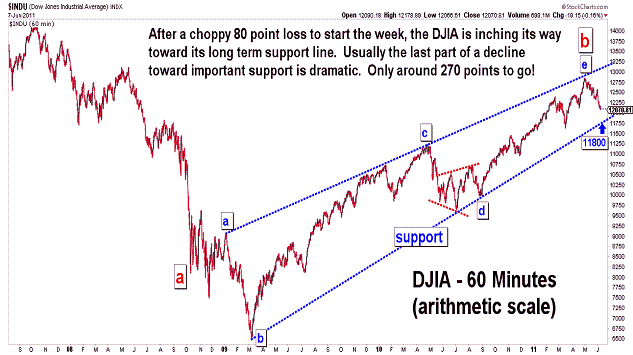
| June 7, 2011 update...There is nothing new to add to the recent updates. The DJIA has worked its way 80 points lower to start the week...and is on target to decline to its long term arithmetic scale support line in the coming days. |
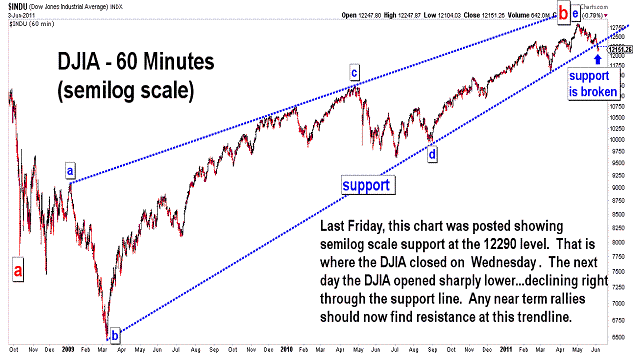
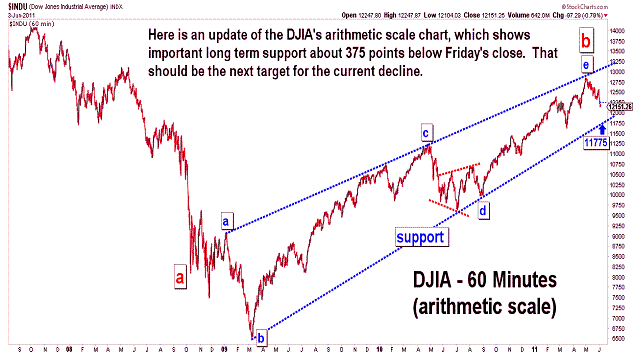

| June 4, 2011 update...The DJIA has now declined five weeks in a row. That has not occurred at any time since the low of March 2009. That is one of the clues suggesting that the market's long term trend has changed from up to down. Last Friday, I posted a semilog scale chart of the DJIA showing long term support at 12290. The average closed right on that level on Wednesday. On Thursday, the DJIA declined right through the support line and is currently about 140 points below it. The line should now act as solid resistance...forestalling any near term rally attempts. The DJIA's next target is the support line on the arithmetic scale chart...currently around 11775. At this point, I think we get there sooner rather than later. |
Important: Information and chart access provided herein is limited to current subscribers only and shall not be forwarded or retransmitted without written authorization. It is educational in nature and shall not, directly or indirectly, be construed as investment advice. No guarantees are made with respect to the accuracy of the information, opinions, predictions,etc. offered here in. The username/password provided to a subscriber is unique and it is the sole responsibility of the subscriber to protect the confidentiality of said username/password and to further protect it from any unauthorized use.
Copyright © 1997 - 2013. The Elliott Wave Chart Blog. All rights reserved. Email
|