|
Charts
IMPORTANT: Chart buy/sell signals are helpful in determining market support and resistance levels...and probable turning points. However, they are only useful if the analyst has a handle on the larger trend. Experience and judgment play a vital role in that determination ...as does Elliott wave analysis.
If a chart does not not appear when you click on the link, you may need to (1) enable javascript, and/or (2) disable pop up blocking for this site, or (3) right click on your mouse and open the link in a new tab or window. Charts will generally appear when you use Internet Exploer or Firefox. Do not use Google Chrome to view charts.
Contact us at info@wavechart.com if you have a question or comment. |
|

Elliott Wave Chart Blog July 2010 Archive
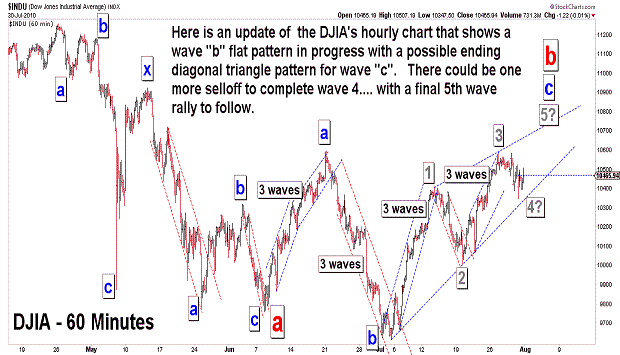
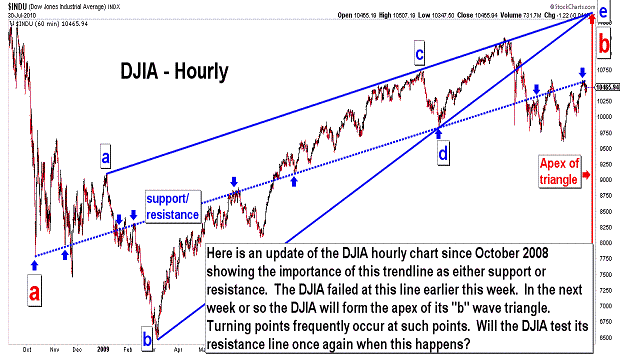
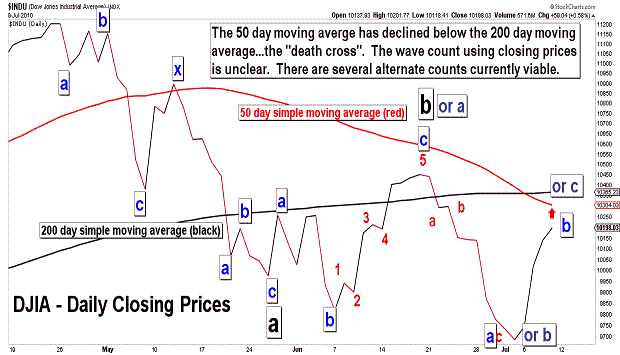
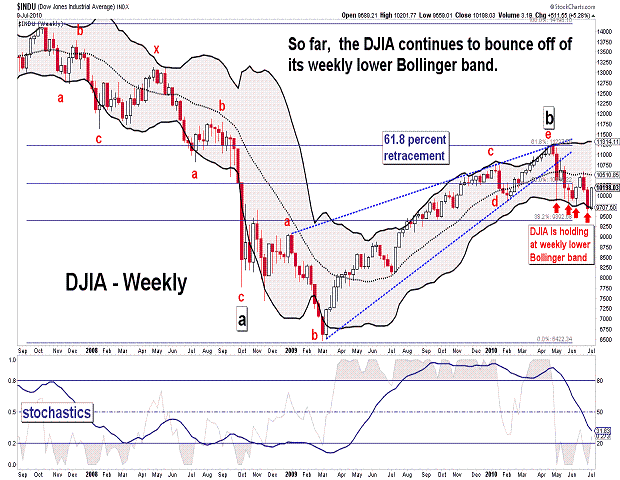
| July 30, 2010 update...The market was mixed for the week with the broad indices just slightly higher or lower. Unfortunately, this week's action did not give us a clear signal that a "b" wave top is in place...and it leaves the door open for one more rally following the current pullback. I have updated the charts shown in the past week...and the only real new information you will see is in the second chart above. The "b" wave triangle that I have been using in my preferred wave count is about to form its apex. Typically, the market will reverse course when that happens. Such reversals can be major or minor ones...and depend upon the larger wave pattern unfolding at the time of the apex formation. In the present case, I believe we are due for a MAJOR reversal that will finally take the DJIA to the 8700 to 9400 area...with lower levels to come thereafter. We'll see. |
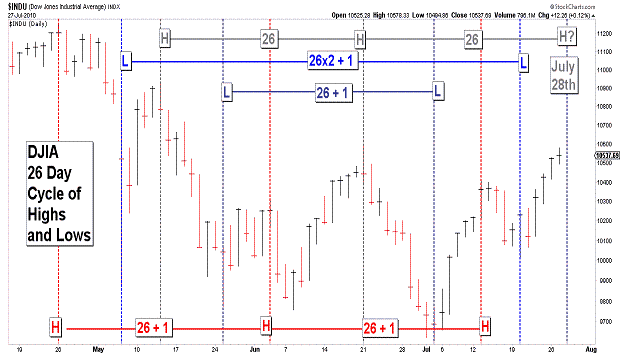
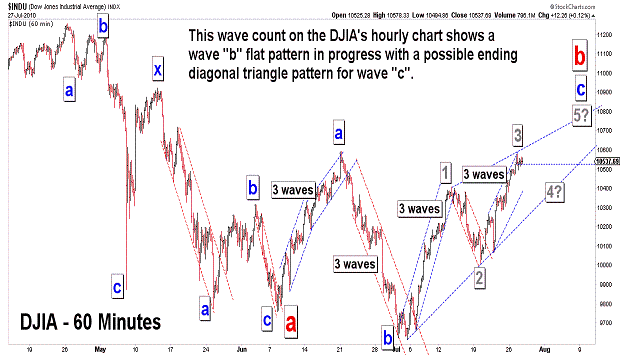
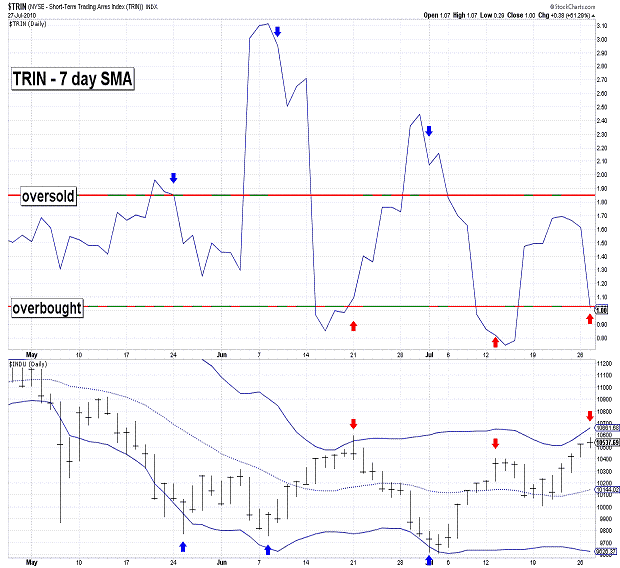
| July 27, 2010 update...The market was mixed today with a number of indices forming key reversal patterns (i.e., closing down after making a higher intraday high) on their daily charts . While most indicies that I follow did not exceed the intraday high of June 21st, a few did...Dow Jones Composite, NYSE Composite, Major Market Index. Since price divergences between indices are frequently seen at important turning points, a top could be in place (or nearly so) if the divergence is not cured. A top in the current time frame is suggested by various cycles. There was a Fibonacci Cycle turn date yesterday (see chart in Friday's update)...one on the trading day chart tomorrow (see first chart above)...and another one this week on the Fibonacci Cycle weekly chart. While I have to conceed that the wave count still has a few viable options in terms of the current pattern, various technical indicators are giving initial sell signals. If the market turns down from here and holds above its July 20th low, one possibility is the formation of an ending diagonal triangle pattern. Should that happen there would be one more rally that should exceed this week's high. There are even more complex possibilities that would extend the sideways action since May for several additional weeks...but, breaking the July 20th low would significantly increase the odds that a substantial decline below the July 2nd low is finally underway. |
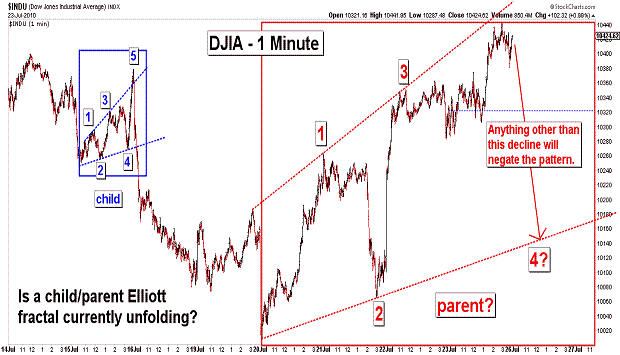
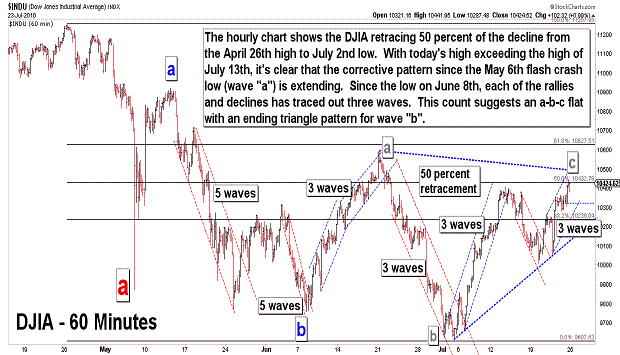
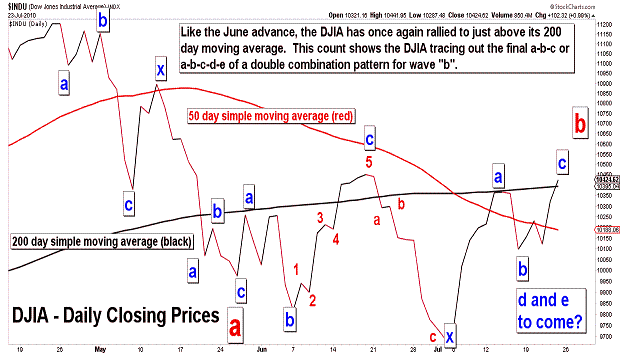
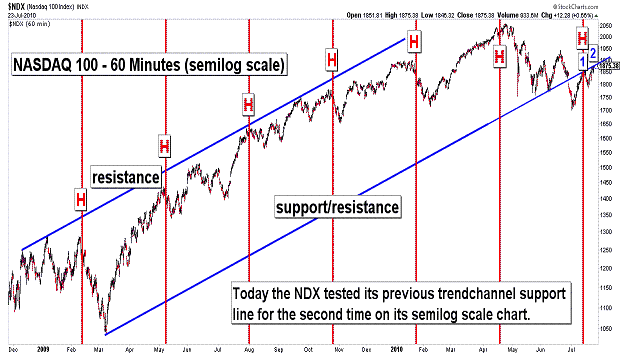
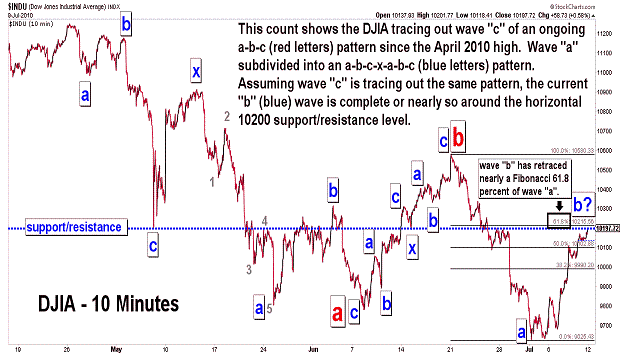
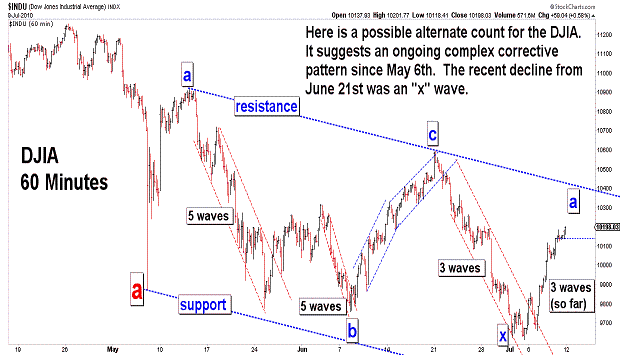
| July 23, 2010 update...Both today and Monday are potential Fibonacci Cycle turn dates (see fourth chart above). Today's rally above the March 13th high (the previous Fibonacci Cycle turn date) eliminates the "b" wave triangle count that was discussed is recent updates. Since I still believe that the April 26th high will remain as the high for the year, there are two basic "bearish" wave counts in play. One is the "leading diagonal" count shown on the Fibonacci Cycle chart just cited...which suggests that the market is currently tracing out a wave "2" (a-b-c) pattern. The other is the a-b-c declining pattern...which suggests that the market is currently tracing out a "b" wave corrective pattern. There are several ways to count the "b" wave...and the difference between them depends solely on how complex the corrective pattern becomes. Market technicals suggests a top is near...but, it may turn out to be only short term if the next decline holds above 10007.76 (Tuesday's low). If that happens the current sideways trading range pattern will extend with another (and likely final) rally back to the top. We'll see. |
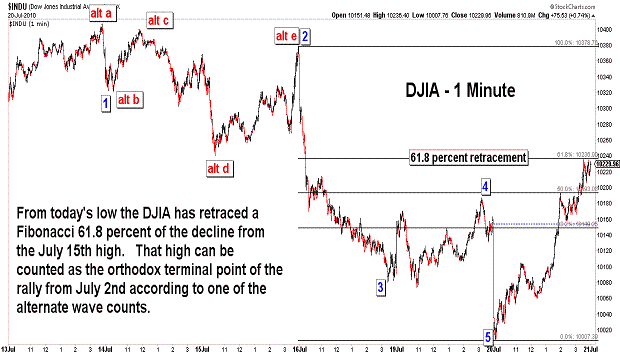
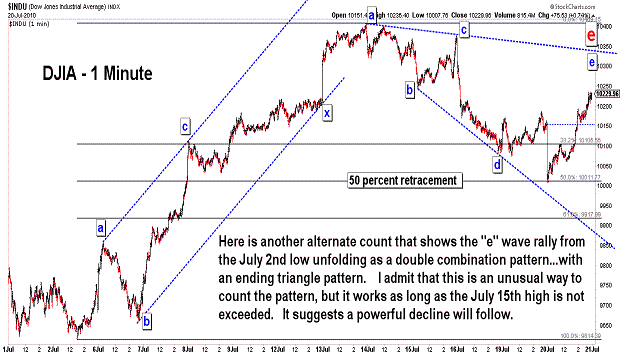
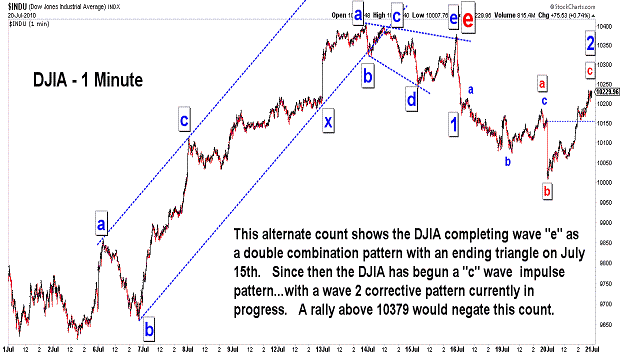
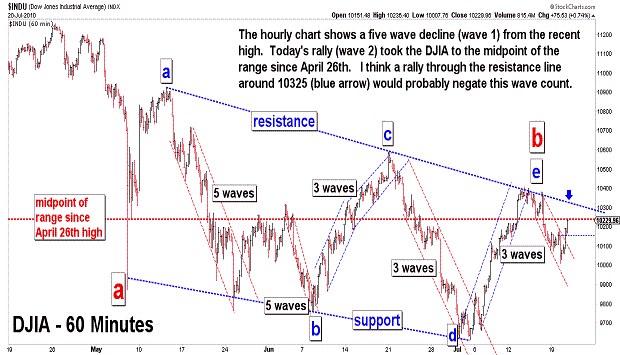
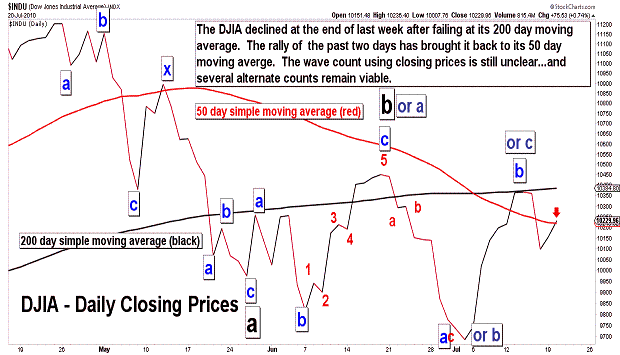
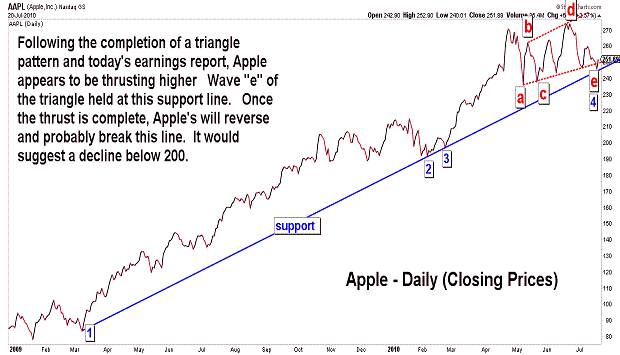
| July 20, 2010 update...Today's opening decline took the DJIA to the 50 percent retracement level of the rally from the July 2nd low. From today's low, the DJIA reversed and rallied 222 points by the close...retracing a Fibonacci 61.8 percent of the decline from the July 15th high. Because of today's sharp reversal, the market's near term direction is somewhat foggy. As you can see in the DJIA charts above, there a number of ways to view the DJIA's pattern since last week's high. The alternate wave counts shown in the charts, for the most part, resolve similarly if the 10359 level (or slightly lower at the indicated resistance line) is not exceeded. If that level IS exceeded, a rally above 10407 becomes likely. However, if and when that happens, it is not yet clear whether the high of June 21st (10594) will hold or fail. A number of technical indicators are likely to give sell signals before that does happen...but, that will not eliminate the possibility of a rally beyond 10594. Today's after hours rally in Apple suggests (as of now) that the NASDAQ 100, at least, is likely to take out its recent high. If that happens without confirmation from other indices, the first of what could be multiple sell signals in the coming days will be triggered. |
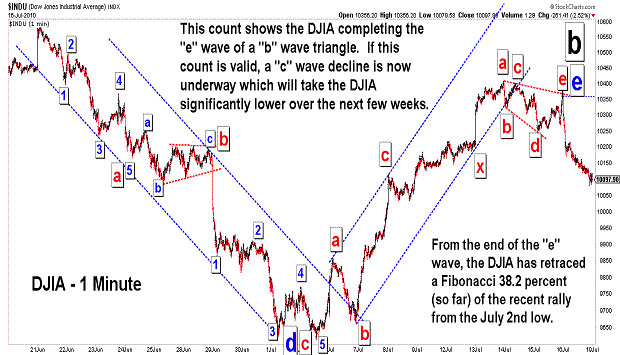
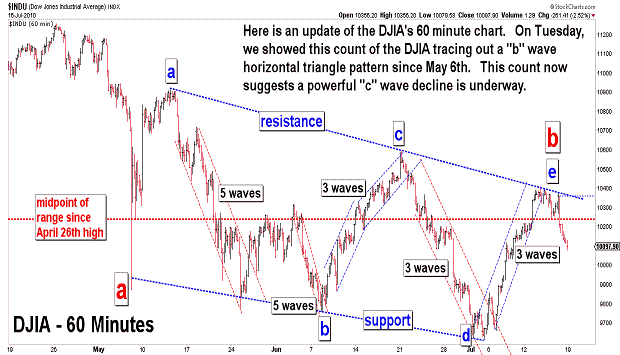
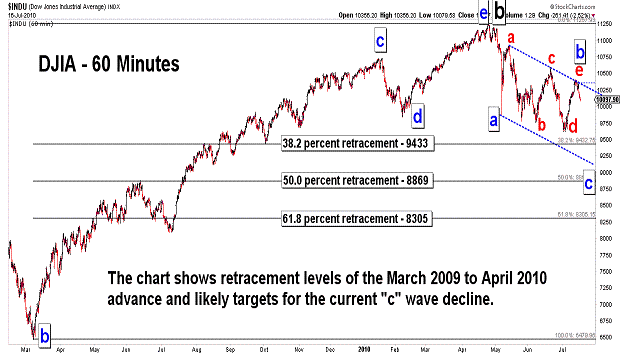
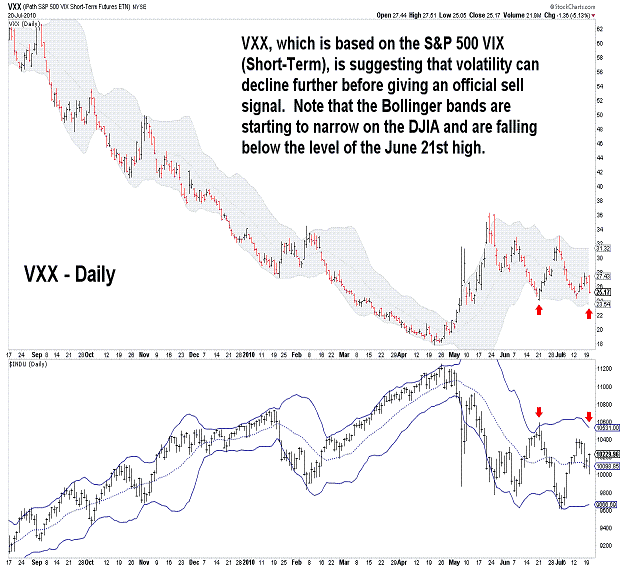
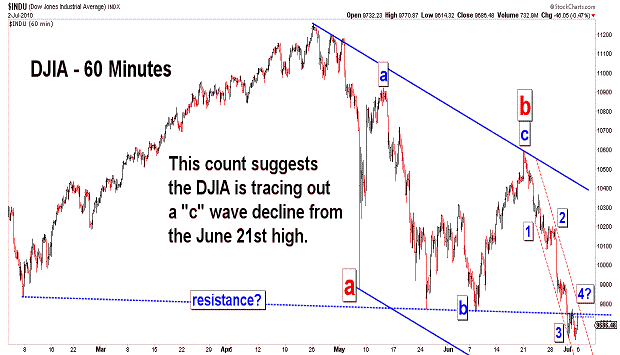
| July 16, 2010 update...Tuesday's Fibonacci cycle turn date called this week's reversal perfectly (see Tuesday's Fibonacci Daily chart). Although the DJIA closed a few points higher on Wednesday, Tuesday's theoretical high was not exceeded...and the DJIA is now more than 2 1/2 percent lower. So where do we go from here? If my wave count is correct, the market goes substantially lower over the next few weeks as wave "c" of an a-b-c pattern from the April 26th high unfolds. There is, however, a small possibility that the rally from the July 2nd low (wave "e") will subdivide into a more complex a-b-c pattern. If so, the current decline is only wave "b" of that pattern. Any decline below 9900 (IMO) would probably negate that possibility...so, a sell off next week of more than 200 points means the DJIA is most likely headed to one of the retracement levels noted in the third chart above. Given the DJIA's current trendchannel, my best guess is the 50 percent level, i.e. around 8869. That is the area of the high just before the June/July 2009 correction. If I am right above the extent of the forthcoming decline, the DJIA will finally have to break its daily and weekly lower Bollinger bands. Should that happen in "crash" like fashion, the tendency is for the market to snap back with a quick relief rally. Alternatively, when it occurs more slowly like January to March 2009, the market tends to hug the line as it falls. Clearly, IF my "b" wave horizontal triangle count (see first three charts above) is correct, the decline should be rapid. |
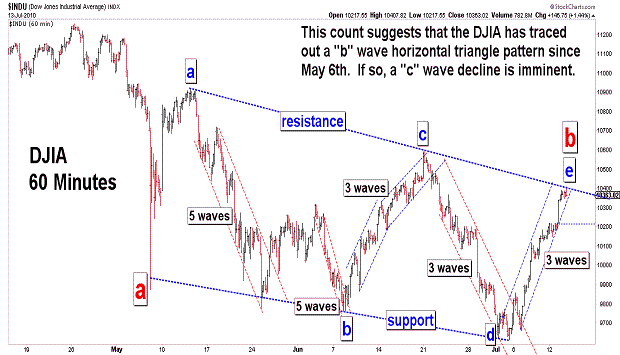

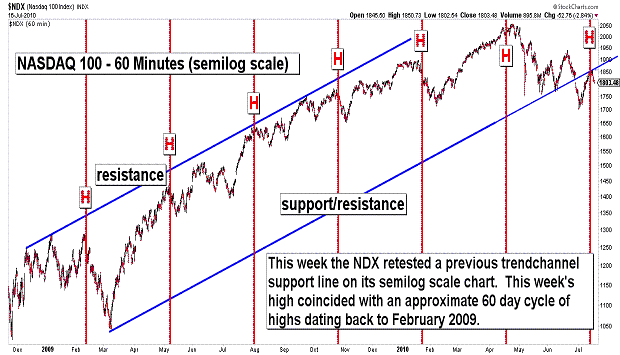
| July 13, 2010 update...As I write this update, there is an after hours rally transpiring...lead by Intel's better than expected earnings. CNBC has made a big deal of it and they keep bringing on one analyst after another that is bullish on corporate profits. I realize it's in CNBC's self interest to hype an economic recovery. But, I just don't see it. I am generally an optimistic person...but, I don't think we can keep postponing the economy's day of reckoning given the country's exploding debt...especially the part that's not even recognized on the official books. If I could see something bullish in the charts I would change my mind. For example, if the market holds above its March 2009 lows through the middle of next year, I think the probability of a rally to new highs will increase. Until then, I'll continue to view the trend since the April 26th high as bearish and unfinished. As you can see in the charts above, we tested a resistance line today...that suggests the DJIA has been tracing out a horizontal triangle pattern since the May 6th "crash" low. That makes some sense...because triangles typically follow market action that moves too far too quickly. If the current rally is the "e" wave of a triangle, a reversal should occur from near current levels...and it should occur this week. We'll see. |
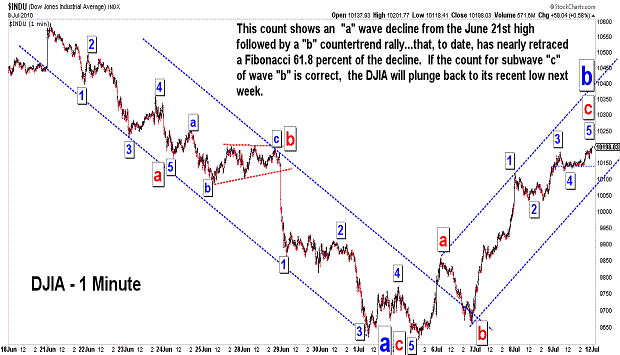
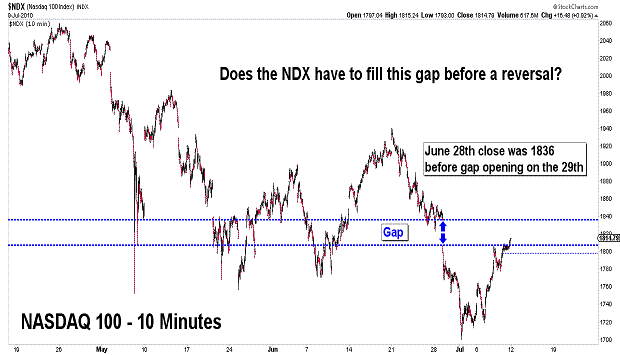
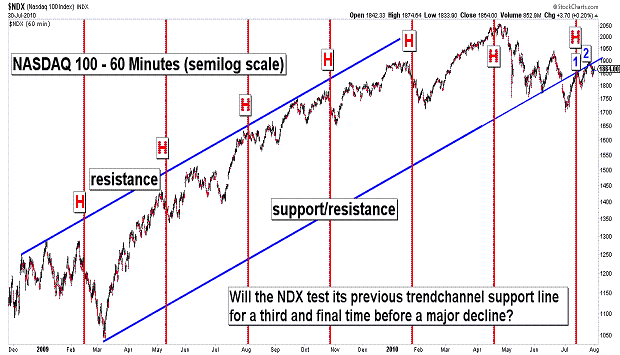
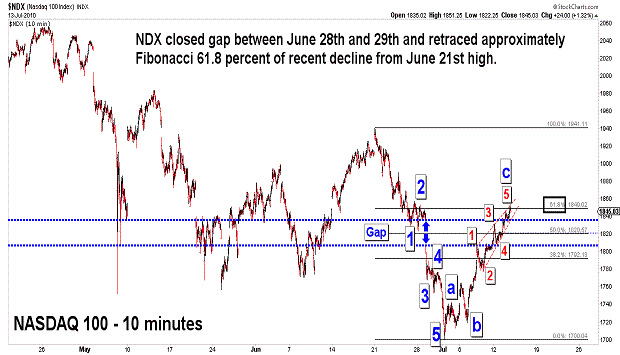
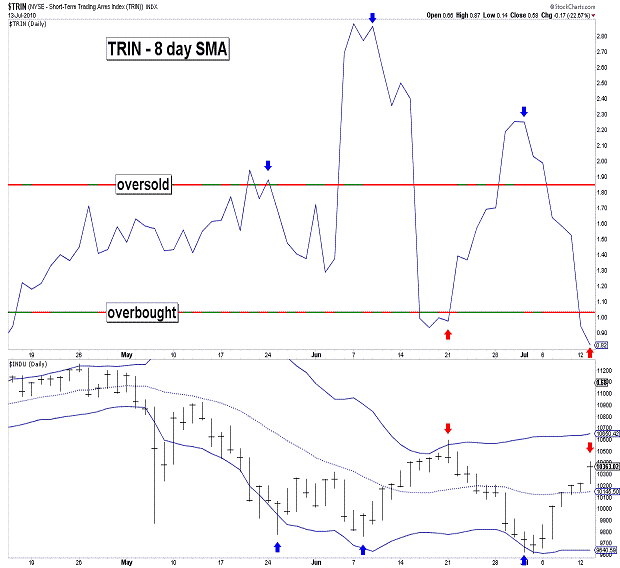
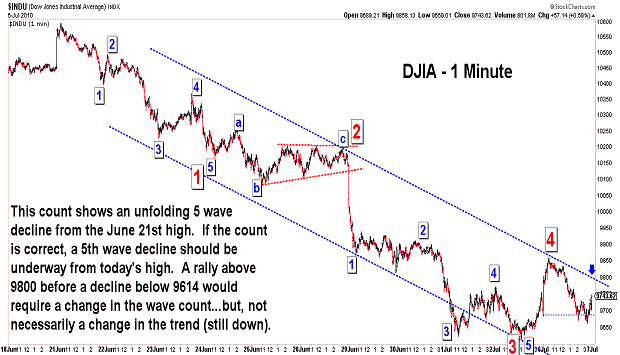
| July 9, 2010 update...Last week at this time I suggested there would "be a good short term bounce...once 5 waves are complete from the June 21st high." We did, in fact, get a short term bounce beginning this past Tuesday, but unfortunately, it occurred without the materialization of a 5th wave decline We had a holiday this past Monday...and it is possible to rationalize that the 5th wave decline occurred in the overnight futures session. Still the charts that we have to deal with, in particularly the DJIA, now show a three wave decline (IMO) from the June 21st high. That opens up a number of wave count alternatives. By today's close, the DJIA had retraced nearly a Fibonacci 61.8 percent of the recent decline. The rally may stop right here...but, higher prices next week can not yet be ruled out...due to those wave count alternatives that are currently in play. As you can see in the weekly chart above, the weekly lower Bollinger band has provided substantial support for the market over the past two months. It will not do so again...assuming that I am correct about a major decline beginning at the April 26th high. The last chart above shows the NDX starting to fill a gap between June 28th and 29th. Should the market climb higher early next week, a reversal might occur once the gap is closed. We'll see. |
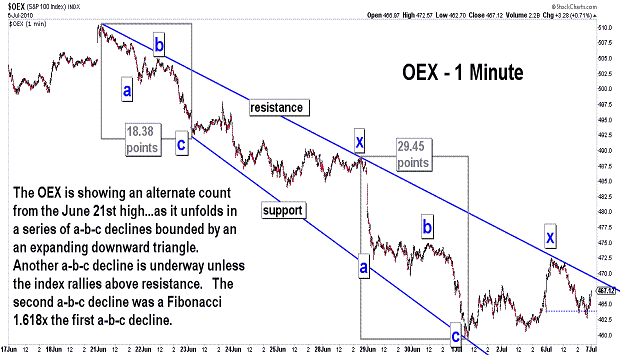
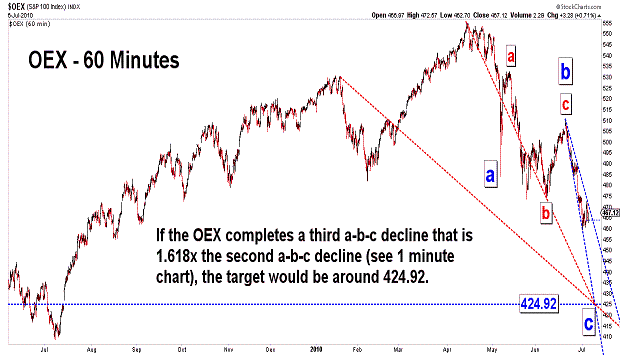
| July 6, 2010 update...The market opened strongly this morning following the holiday weekend, but the market was mixed by session's close. On Friday, I gave some reasons why a I thought that a short term bounce was near...but, I also thought it would start from a lower level. If today's bounce was NOT the start of a short term countertrend rally (and I still think that is likely to be the case), then today's high must not be broken before last Friday's low is exceeded. As you can see in the two OEX charts above, an interesting pattern is developing (or, if complete, developed). From the June 21st high, the index has declined in a series of two a-b-c patterns. Interestingly, the length of the second a-b-c pattern was a Fibonacci 1.618x the length of the first. If a third a-b-c decline has begun from today's high and is 1.618x the length of the second a-b-c pattern, then the next target for a low in the OEX is around 424.92. We'll see. |
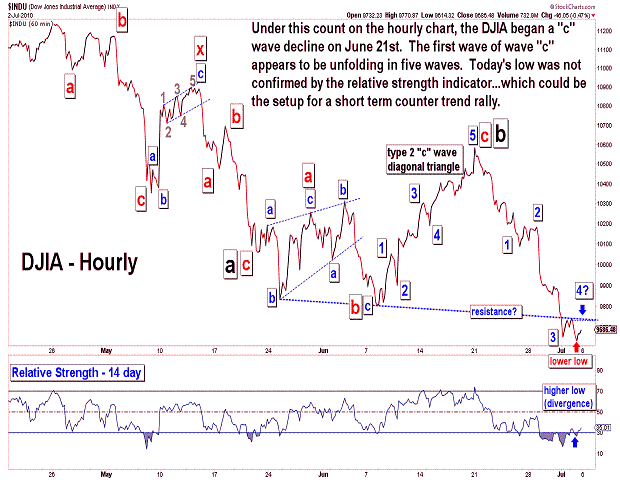
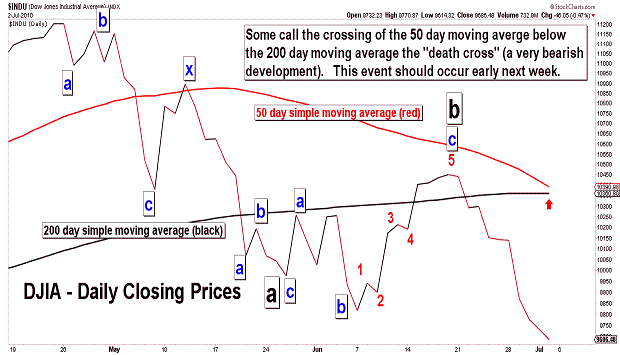
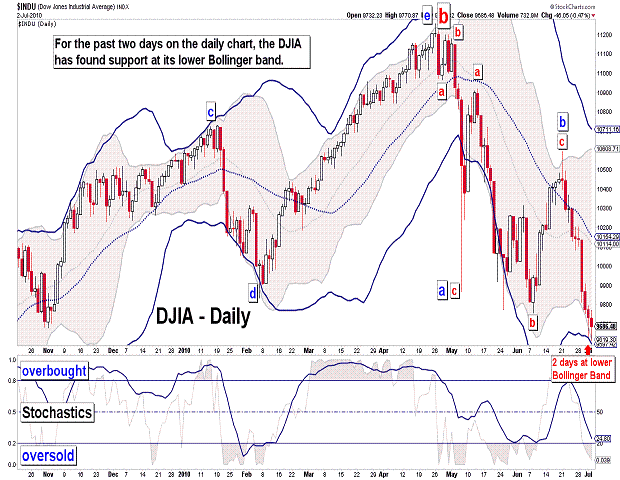
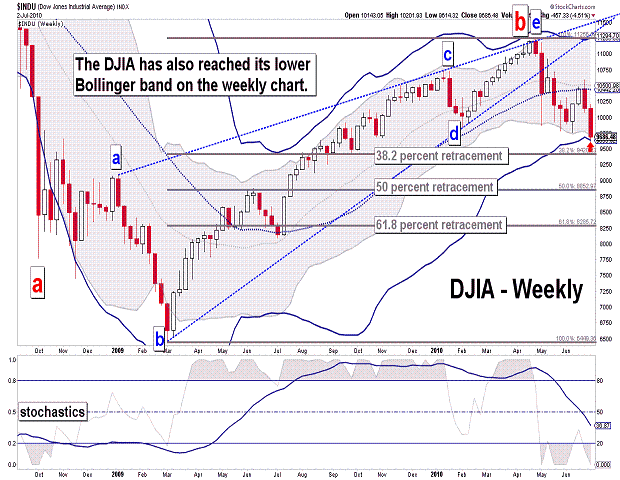
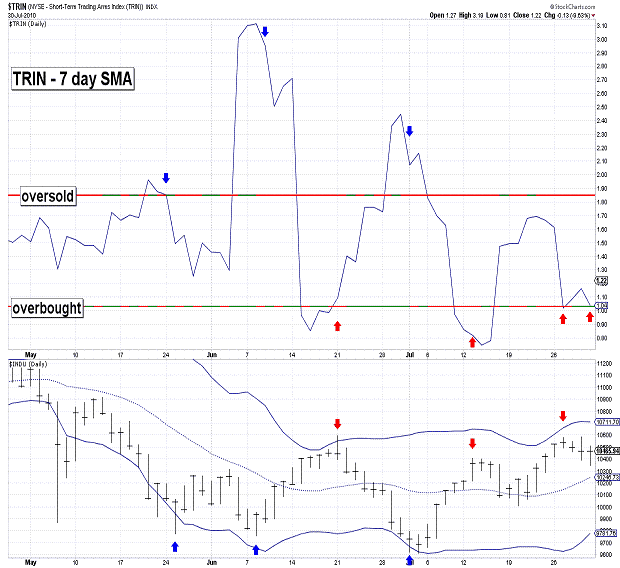
| July 2, 2010 update...This week the market's losses accelerated...the DJIA declined about 4 1/2 percent and the NASDAQ declined about 6 percent. When the market topped out on April 26th, I suggested that the next "bear market" would last 12 months or so. We are "bearly" past the 2 month marker...and, the DJIA has already declined 13 1/2 percent from the high. How does this compare to the first phase of the decline from the October 2007 high? That decline was 15 1/2 percent...but, it took 50 percent more time to accomplish the additional 2 percent loss (48 trading days vs. 71 trading days). I think the present decline is likely to far exceed that one by the time we get to the 23rd trading day from now. Technically, the market is oversold on both the hourly and daily charts, and it has reached the lower Bollinger band on both the daily and weekly charts. So, it is not yet clear, however, how low the market goes before that happens. I have mentioned the 8700 to 9400 area previously. We'll see! In the meantime, enjoy the July 4th holiday. |
Important: Information and chart access provided herein is educational in nature and shall not, directly or indirectly, be construed as investment advice. No guarantees are made with respect to the accuracy of the information, opinions, predictions, etc. offered herein.
Copyright © 1997 - 2012. The Elliott Wave Chart Blog. All rights reserved. Email
|