|
Charts
IMPORTANT: Chart buy/sell signals are helpful in determining market support and resistance levels...and probable turning points. However, they are only useful if the analyst has a handle on the larger trend. Experience and judgment play a vital role in that determination ...as does Elliott wave analysis.
If a chart does not not appear when you click on the link, you may need to (1) enable javascript, and/or (2) disable pop up blocking for this site, or (3) right click on your mouse and open the link in a new tab or window. Charts will generally appear when you use Internet Exploer or Firefox. Do not use Google Chrome to view charts.
Contact us at info@wavechart.com if you have a question or comment. |
|

Elliott Wave Chart Blog July 2011 Archive
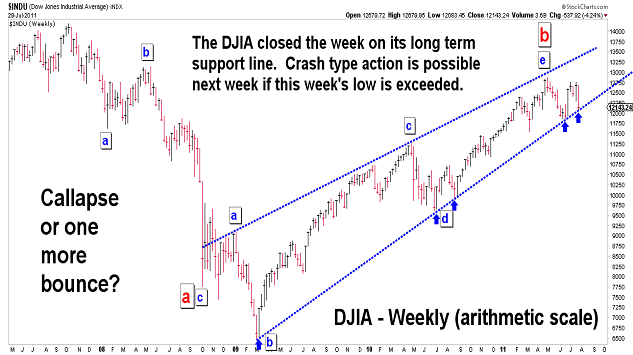
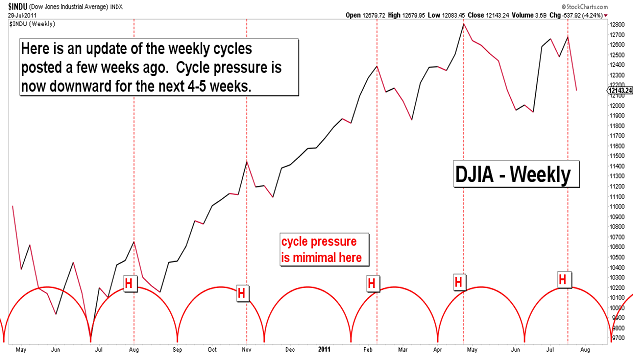
| July 30, 2011 update...On Tuesday, I said that a "decline below last week's low would suggest that the DJIA's long term support line (now around 12150) would be tested once again." That's exactly how the week ended (with the DJIA closing at 12143). So, do we collapse next week or do we hold and bounce once again? You would think from all of the talk in Washington D.C. that the market's fate rests in the hands of Congress. From a very short term time frame perspective that may be true. If the Congress acts this weekend, there could be a relief rally early in the week...postponing (for a short time only) a collapse next week. If it fails to act and Friday's low is immediately exceeded, crash type action in the market is likely to follow. But, whatever happens fundamentally in the coming days, in terms of the federal debt ceiling vote or otherwise, the market will not be helped by weekly cycles...which have peaked and are headed downward for the next month or so. |
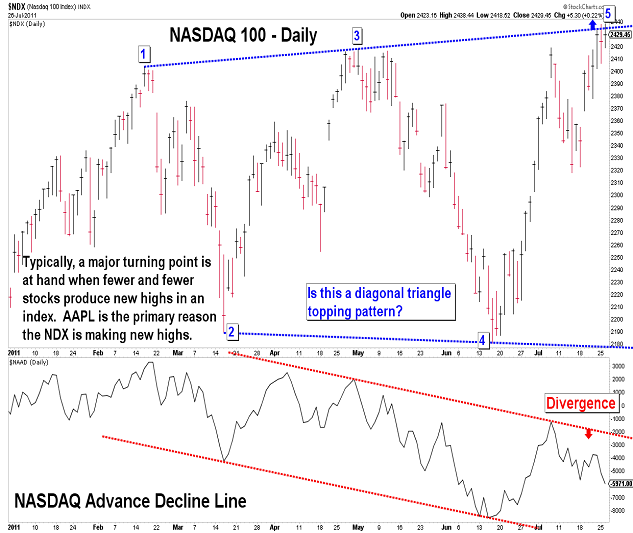
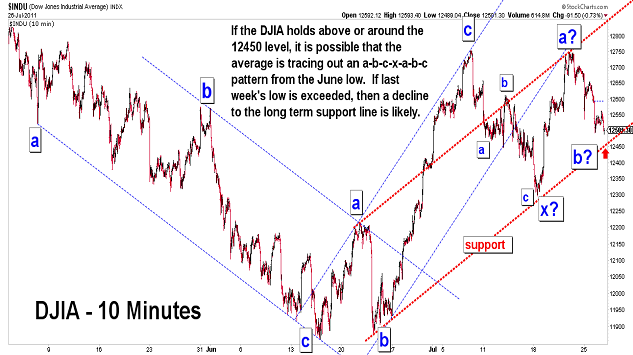
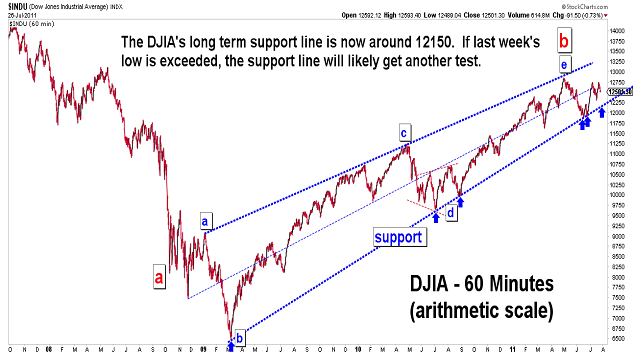
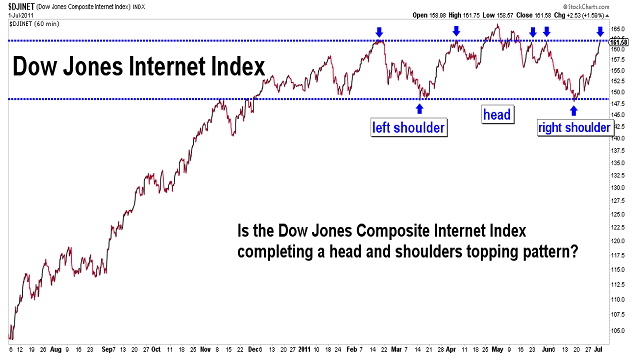
| July 25, 2011 update...Last Friday, I pointed out the increasing number of divergences in the market. Here is another one: the NASDAQ advance decline line is declining even as the NASDAQ 100 is making new highs. This would lend some additional support to my point on Friday that the NDX appears to be tracing out a diagonal triangle topping pattern. As for the DJIA, the decline from last week's high appears corrective so far...with possible support around the 12450 level (if there is another rally to come). A decline below last week's low would suggest that the DJIA's long term support line (now around 12150) would be tested once again. |
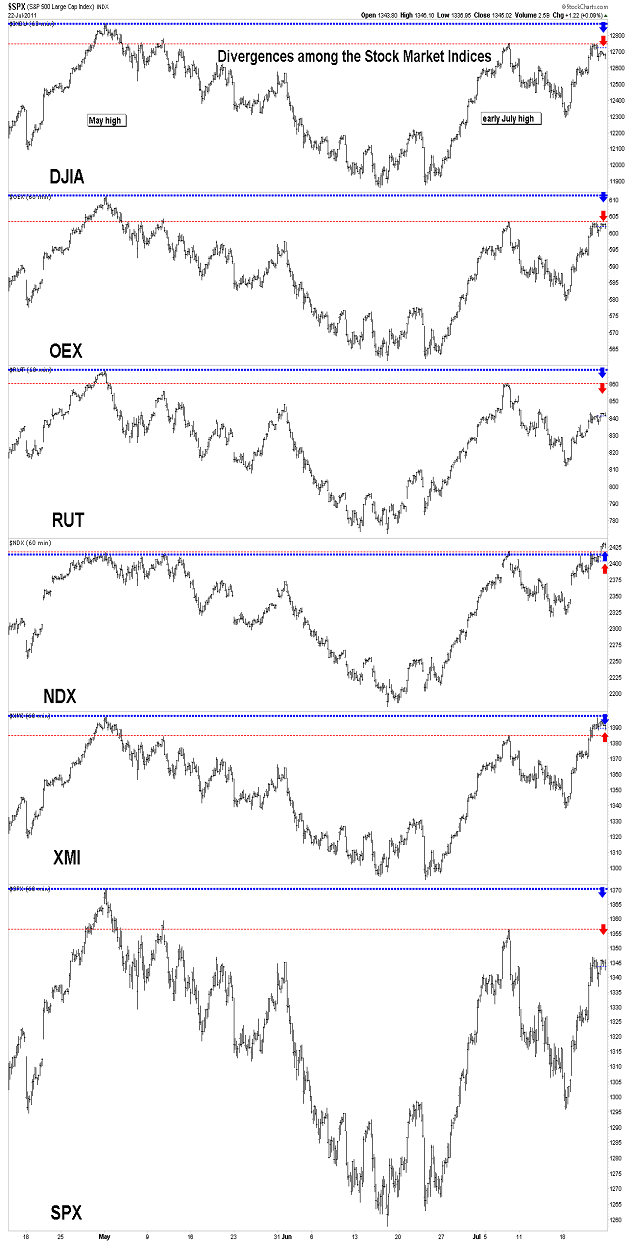
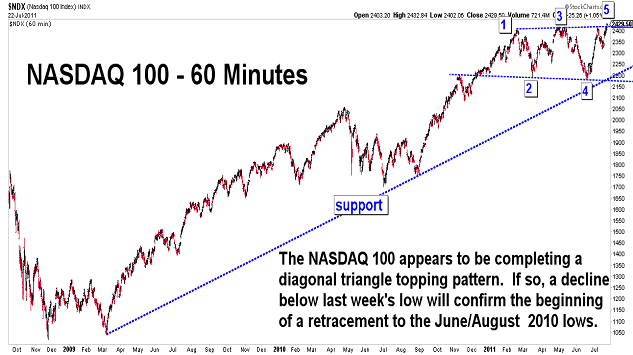
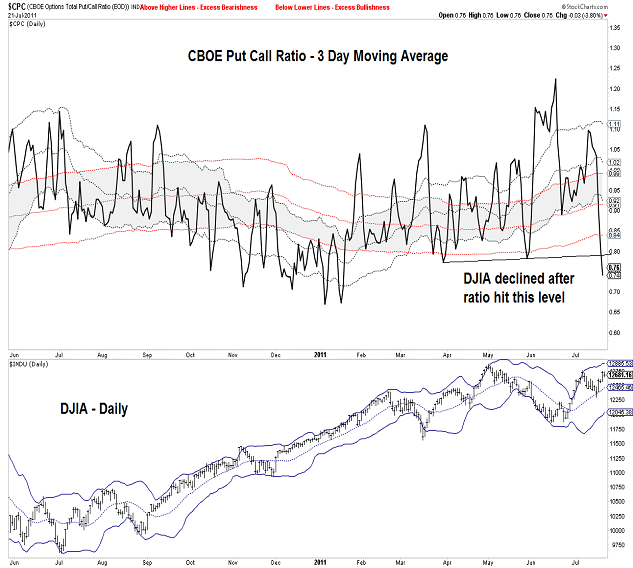
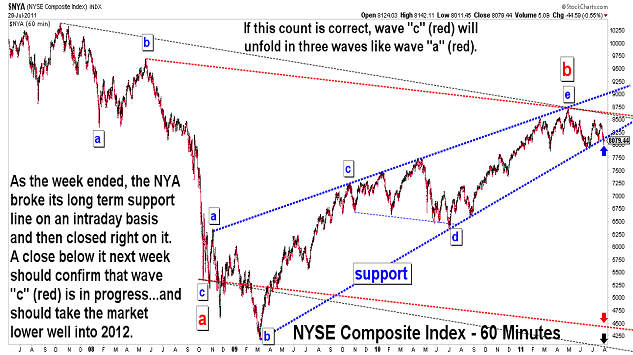
| July 22, 2011 update...This was a week for market divergences, which are common near important turning points. For example, the DJIA made new daily and weekly closing highs vs the average two weeks ago, but did not make a higher intraday high. One of the stronger indices this week was the NASDAQ 100 (thank you AAPL), which, unlike most other indices, surpassed its May high. That index now appears to have traced out a diagonal triangle top. If so, it would suggest a retracement is approaching that will take the index back to its June/August 2010 lows. Finally, the put/call ratio is getting back to a level that is associated with market highs. At this point, I don't think it really matters what the Congress and President do with the debt ceiling. The long term Elliott wave pattern says to me, at least, that a major decline is coming. |
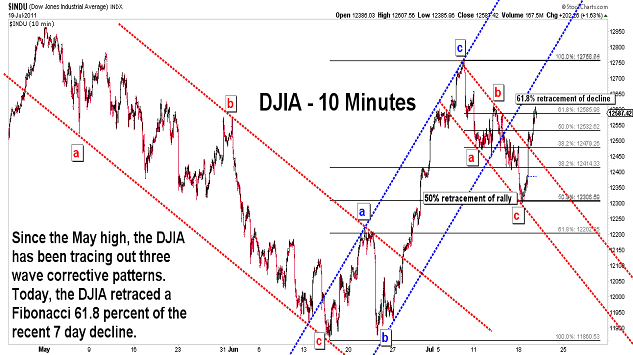
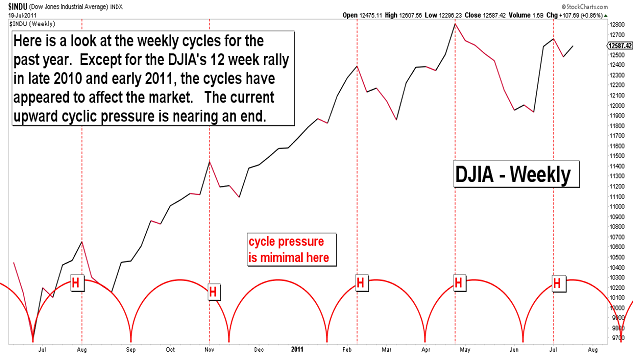
| July 19, 2011 update...The DJIA continues to trace out three wave corrective patterns at multiple degrees of trend. Today's upside surge carried the DJIA to a Fibonacci 61.8 percent retracement level of the recent 7 day decline. Everyone seems happy again with the market (primarily one stock - AAPL) as evidenced by today's .67 put/call ratio. This is a level not seen since late May...just before the market's June swoon. While the larger pattern still has a few options, the weekly cycles are peaking and will soon rollover again to the downside. The long term support line from the March 2009 low still is the key to the market's overall trend. |
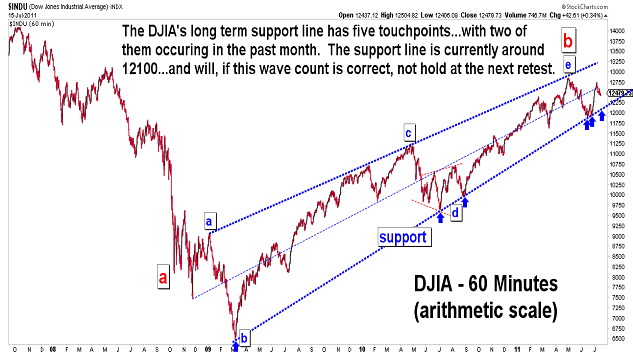
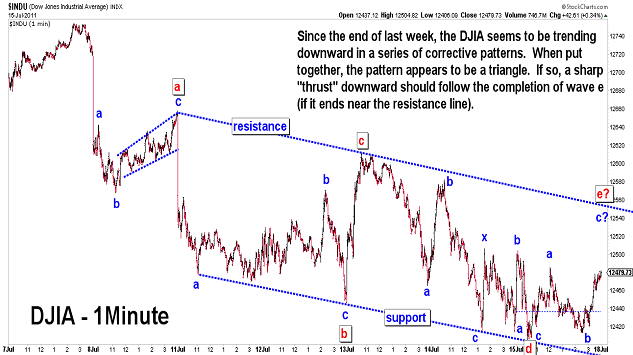
| July 15, 2011 update...I guess we will have to wait for the market to decline about 3 percent or so from here for things to get exciting. The DJIA's long term support line is now around 12100...and that is where we need to get to (and below) if a bear market from the May high is, in fact, underway. This week all of the significant action occurred Monday and Tuesday with the DJIA losing over 200 points. It then took three days for the DJIA to gain back around 33 points. The short term pattern at this point is anything but clear...however, a triangle pattern looks like the best fit. If so, next week the DJIA should rally early to complete the triangle...and then "thrust" sharply downward. I wouldn't be surprise if something else unfolds, but we'll see. |
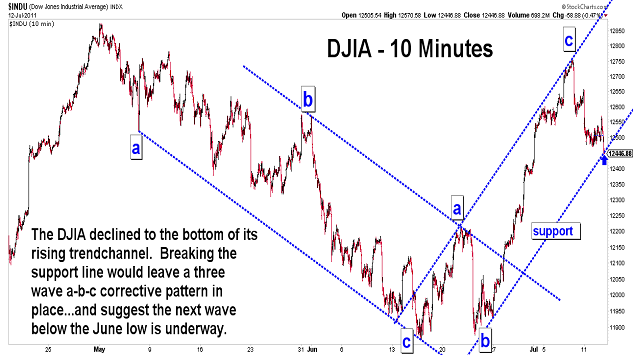
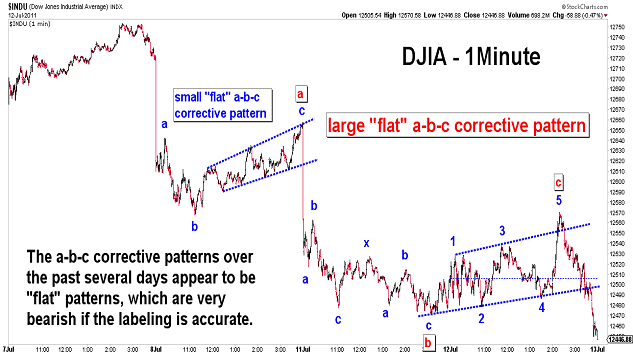
| July 12, 2011 update...The DJIA has declined sharply so far this week and appears to be on the verge of an even bigger decline if the labels are correct on the DJIA's 1 minute chart. As the DJIA's 10 minute chart indicates, however, the DJIA closed right on its rising trendchannel support line. Tomorrow's action should quickly indicate whether this support line has any strength. A sharp break of the line should confirm the validity of the bearish wave count. |
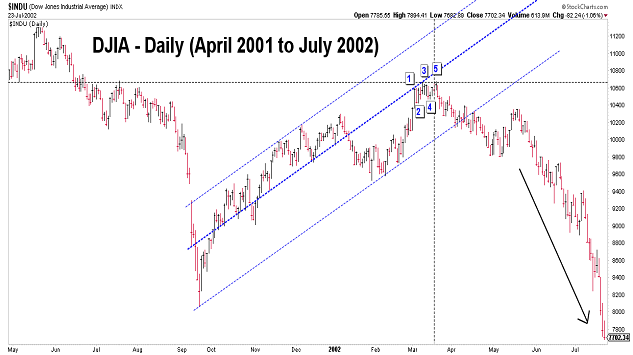
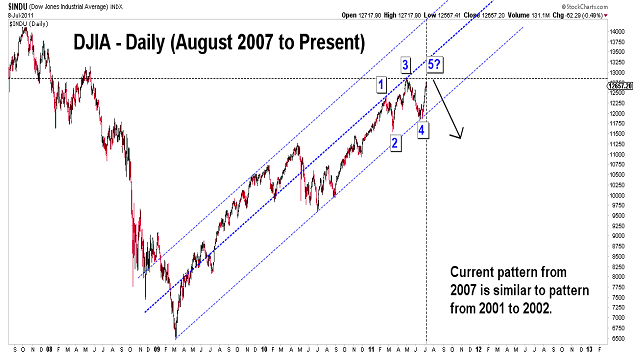
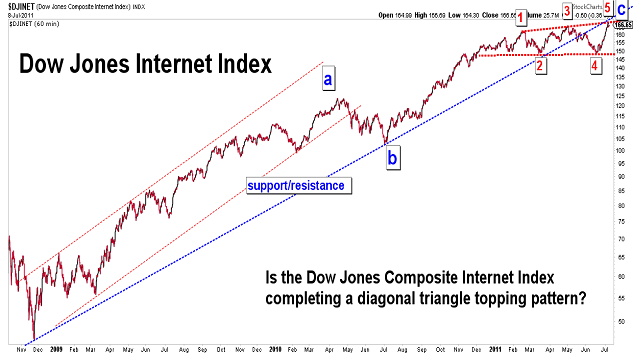
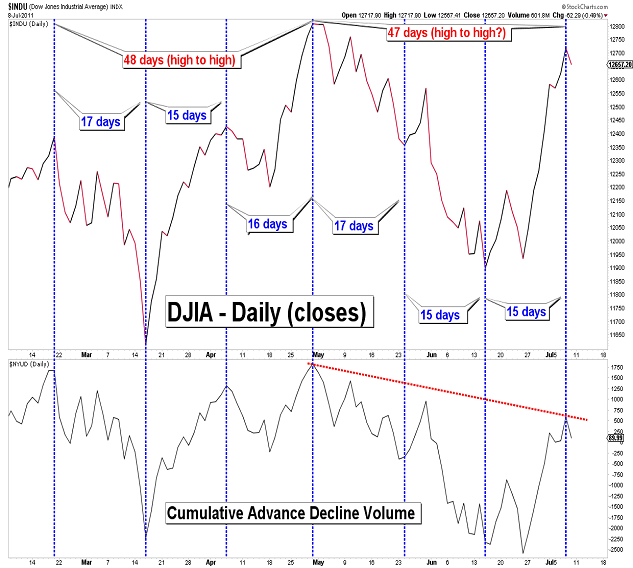
| July 8, 2011 update...Today's action had a strange feel to it. Horrible economic news on employment sent the market lower this morning...yet in the afternoon, buyers appeared helping the market to recover a good portion of its earlier losses. Is this a setup to take the market down hard next week...or, is there some good reason to buy stocks that simply eludes me? The one pattern that I see that allows for a new high (or not) is a diagonal triangle pattern. It has already formed on some charts (see third chart above). The 5th wave of a rising diagonal triangle usually makes a higher high...but, it can also fail. Timewise (see fourth chart above), the market was due for a reversal of some kind today. Confirmation that the market has, in fact, completed a diagonal triangle pattern will come when a decline of more than 2 percent unfolds. That should indicate that the larger declining pattern that began in May has resumed. |
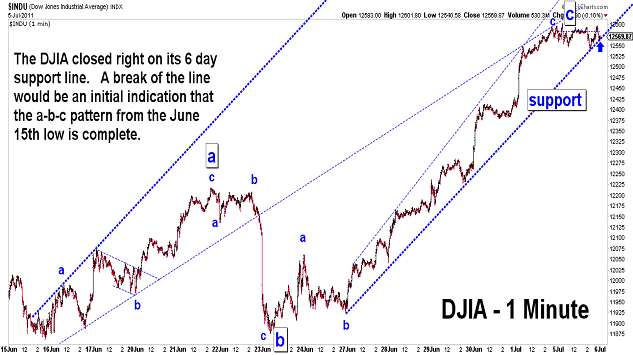
| July 5, 2011 update...The post holiday action was uneventful...with the DJIA limited to a 60 point trading range. The DJIA did, however, close right on its six day support line. Breaking this line would be the first indication that the a-b-c corrective pattern from the June 15th low is complete. A surge in downside volatility would be required to confirm it. |
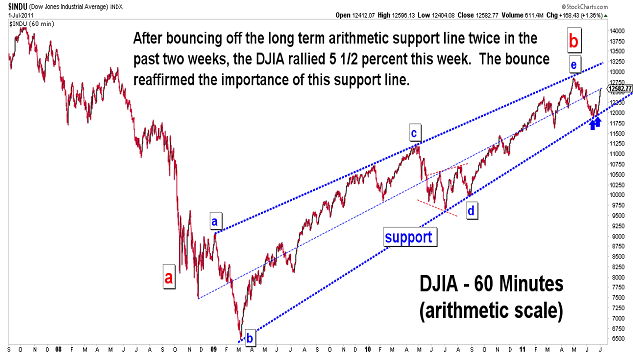
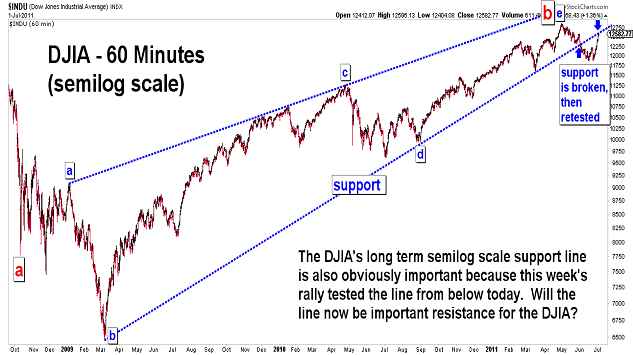
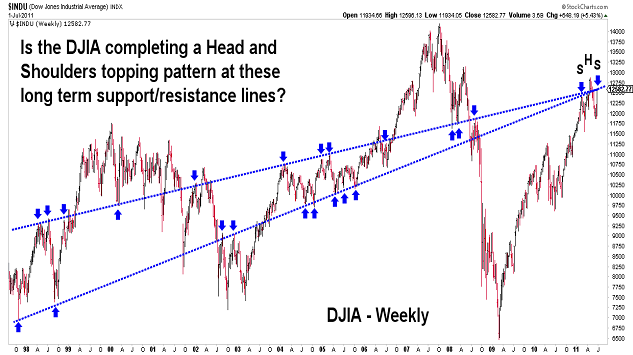
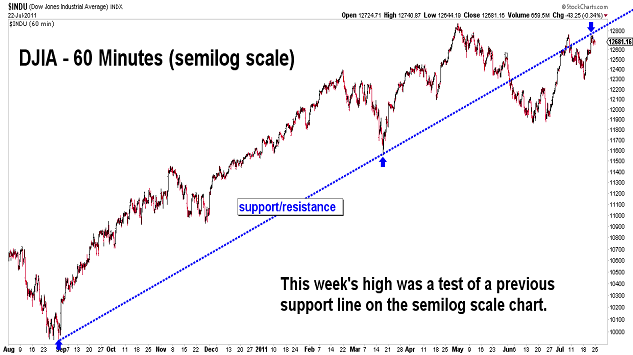
| July 1, 2011 update...What a week for the market! The DJIA gained about 5 1/2 percent...the NASDAQ about 6 1/2 percent. The successful testing of the DJIA's long term arithmetic scale support line over the past two weeks showed the importance of the line. Now this week's rally has brought the DJIA back to its long term semilog scale support line that was tested and broken one month ago. Typically, that line should now provide importance resistance. If I am right that an intermediate term decline began at the May high, the DJIA should reverse course in the coming days and begin the next phase of the decline. In the meantime, enjoy the weekend and the 4th of July holiday on Monday! |
Important: Information and chart access provided herein is limited to current subscribers only and shall not be forwarded or retransmitted without written authorization. It is educational in nature and shall not, directly or indirectly, be construed as investment advice. No guarantees are made with respect to the accuracy of the information, opinions, predictions,etc. offered here in. The username/password provided to a subscriber is unique and it is the sole responsibility of the subscriber to protect the confidentiality of said username/password and to further protect it from any unauthorized use.
Copyright © 1997 - 2013. The Elliott Wave Chart Blog. All rights reserved. Email
|