|
Charts
IMPORTANT: Chart buy/sell signals are helpful in determining market support and resistance levels...and probable turning points. However, they are only useful if the analyst has a handle on the larger trend. Experience and judgment play a vital role in that determination ...as does Elliott wave analysis.
If a chart does not not appear when you click on the link, you may need to (1) enable javascript, and/or (2) disable pop up blocking for this site, or (3) right click on your mouse and open the link in a new tab or window. Charts will generally appear when you use Internet Exploer or Firefox. Do not use Google Chrome to view charts.
Contact us at info@wavechart.com if you have a question or comment. |
|

Elliott Wave Chart Blog August 2010 Archive
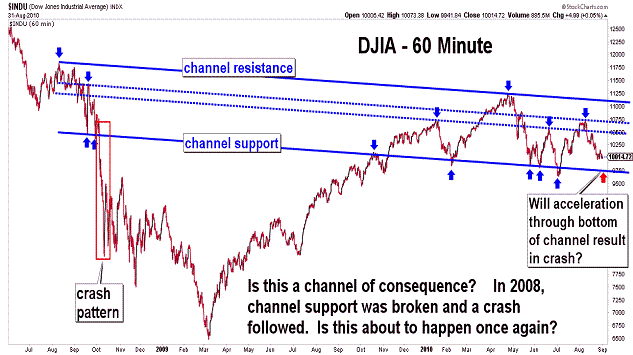
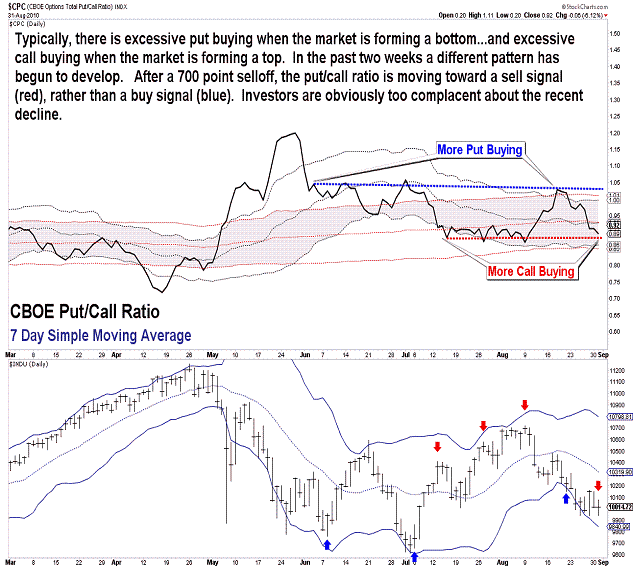
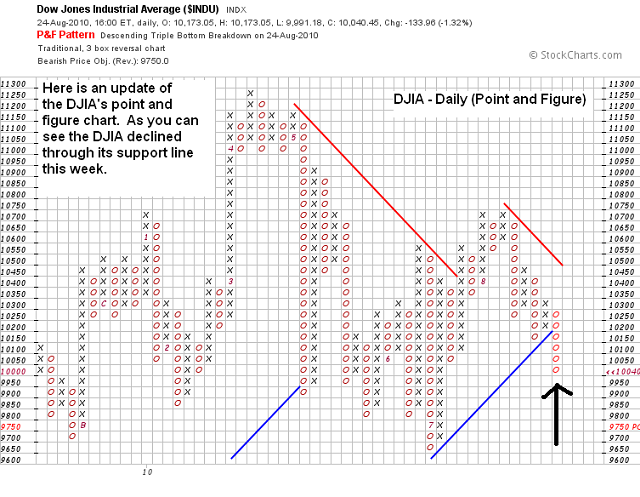
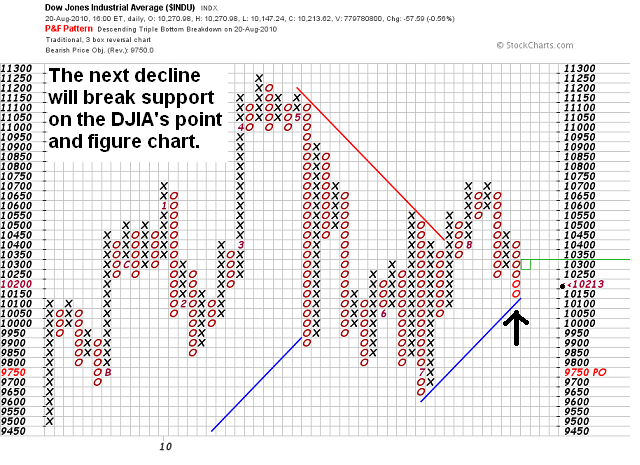
| August 31, 2010 update...Yesterday, the market gave back most of Friday's rally...indicating that cyclical and seasonal downward forces are in force and still developing. Today's early selloff and recovery was, I think, just a maneuver by the bears to provide a small bit of hope for the bulls. It is/was needed to set up the eventual "crash" pattern that will slice right through the four month lows (see third chart above). This can also be seen in market sentiment measurements, like the put/call ratio, which shows a complacency among investors toward the market going forward. The next important test should come when the DJIA drops another 2 to 3 percent from here. |
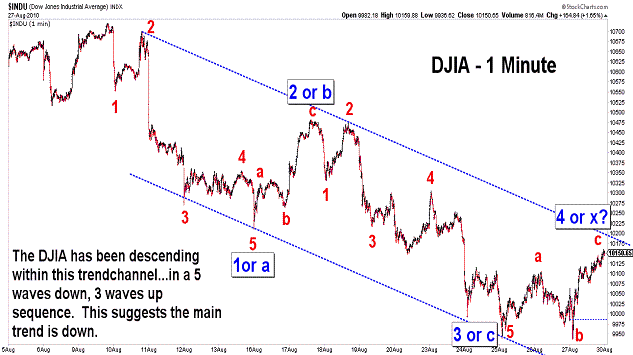
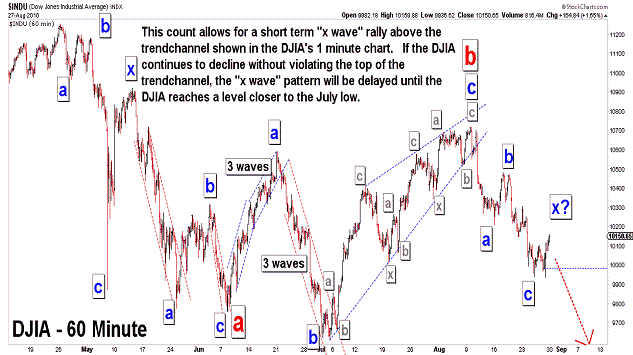
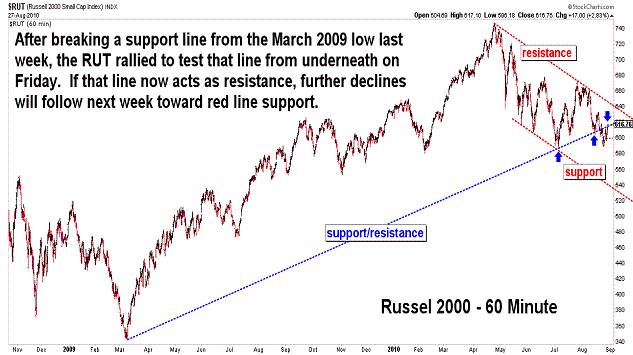
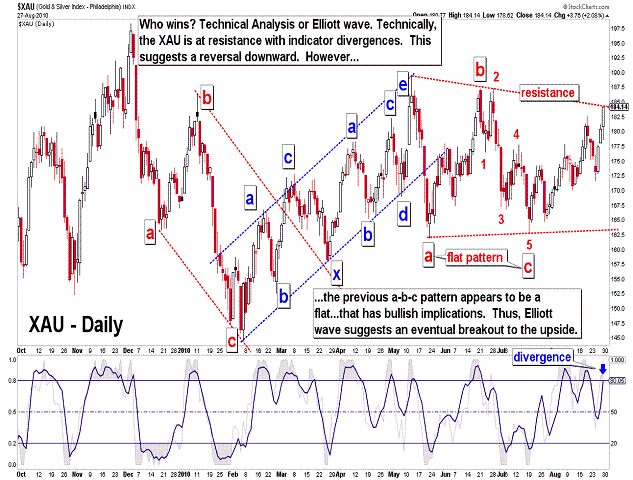
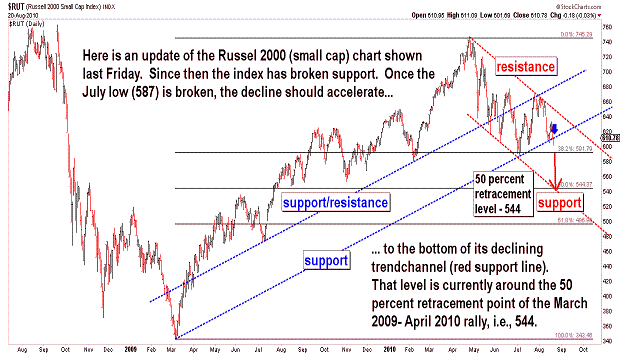
| August 28, 2010 update...Despite Friday's strong rally, the market was generally down for the week. One apparent expection was the small caps. They have been relatively weaker than the rest of the broad averages for the past month...so, I guess they were due for a good bounce. But, take a look at the Russell 2000 chart above. The RUT broke a support line from the March 2009 low last week...and yesterday it rallied to test that line from underneath. Whether or not that line is now strong resistance will be determined by what the index does next week. In terms of the DJIA, there are some short term options. The average has been declining perfectly within a trendchannel since the August 9th high. If the rally ends at the top of the channel, then a test of the July lows is next. If that line is exceeded, the wave count would suggest that some kind of "x" wave corrective pattern is underway that could last until the short term indicators return to an "overbought" condition. While I don't often post the XAU chart, I thought it posed an interesting technical analysis vs. Elliott wave analysis dilema. Techncially, the index appears ready for a reversal to the downside. However, from an Elliott wave viewpoint, its most recent downward corrective pattern was a bullish "flat" (3-3-5). That would imply that the current upward pattern should exceed its June high. We'll see. |
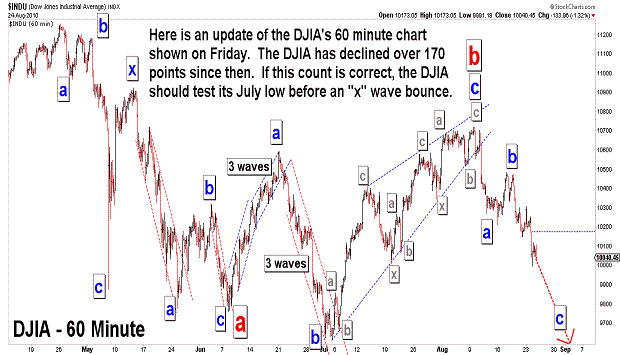
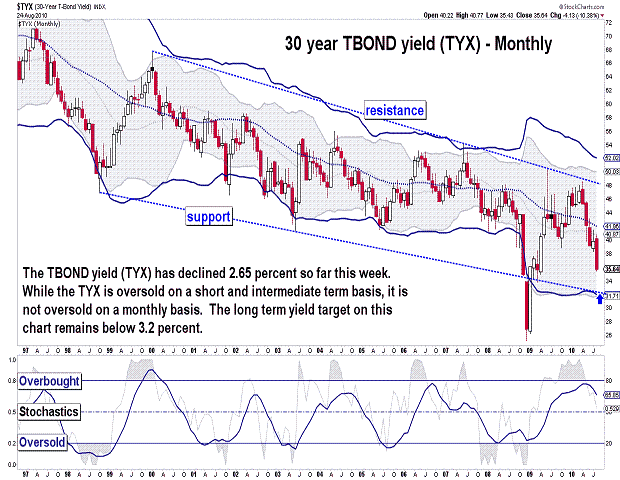
| August 24, 2010 update...The DJIA has lost 1.7 percent already this week; the NASDAQ even more...above 2.5 percent; all the while, long term bonds are soaring in price as yields continue to decline. Of late, each reported economic number disappoints...today it was housing. The DJIA's pattern suggests a test of the July low is coming...then a possible bounce...and finally a waterfall decline below 9000. No guaratees, of course. My work continues to suggest a declining pattern well into next year...with a test of the October 2008 lows, at a minimum...7800. If you missed this interview on CBNC today with Charles Nenner, take a look. |
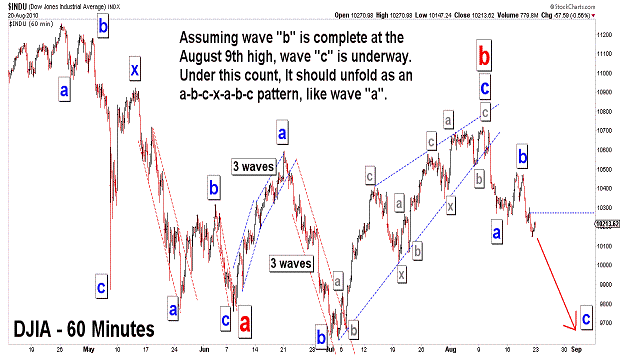
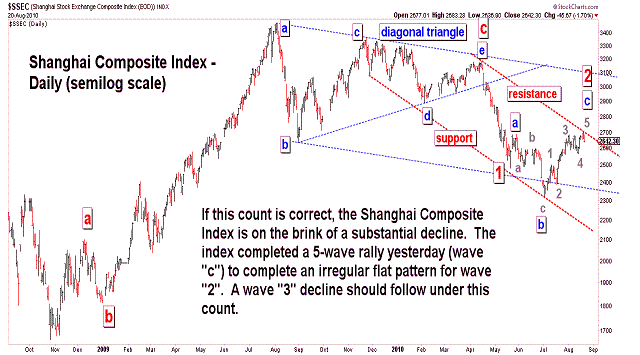
| August 20, 2010 update...The DJIA lost almost 1 percent for the week...while most of the other indices ended nominally higher or lower. The question now is this: are all of the upward corrective patterns complete and is the market finally ready to begin the next downward phase of its intermediate term decline? While most of the recent corrective patterns among the various indices can, arguably, be counted as complete...Elliott wave rules and guidelines allow for extensions and additional complexity. The fly in the ointment now (and my present concern) is that some of the short term indicators are oversold and the put/call ratios are in a range where, during the past year, rallies have occurred. So, the market is certainly not at a point where everything is one-sided and lined up for a sure-thing mega-decline. The one index that does show a complete classic Elliott wave corrective pattern is the Shanghai index (see last chart above). The recent rally was a 5 wave "c" wave ending at the top of a perfectly formed declining trendchannel. That "c" wave is part of a bearish irregular wave "2" flat pattern that developed in model fashion across the trendchannel. Wave 3 should be next...but, a sizeable down day is needed next week to confirm it. Check this index before the US markets open next week. It might just provide the signal that the bear market is back in full gear. |
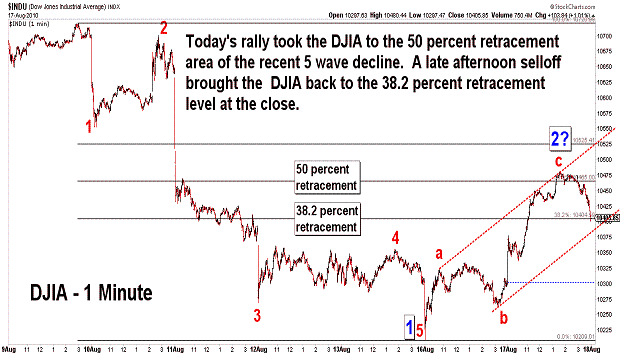
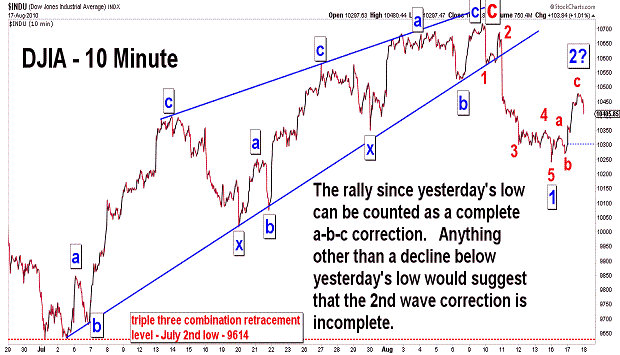
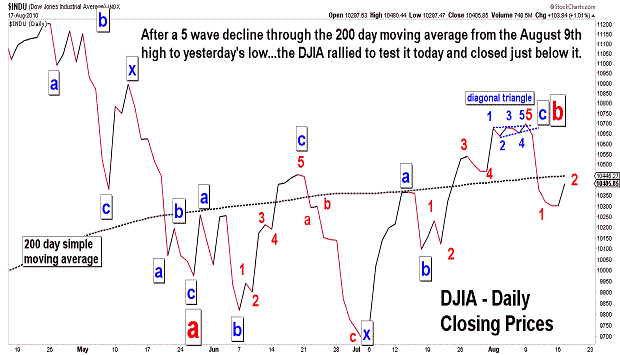
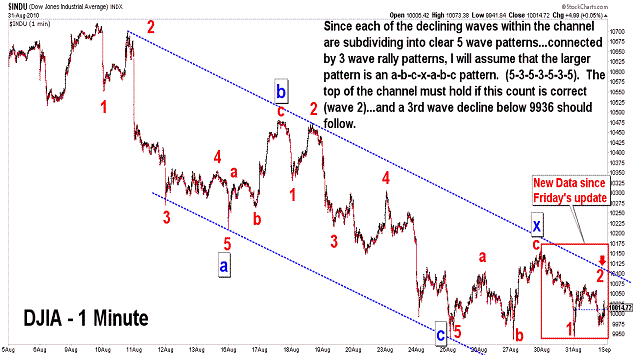
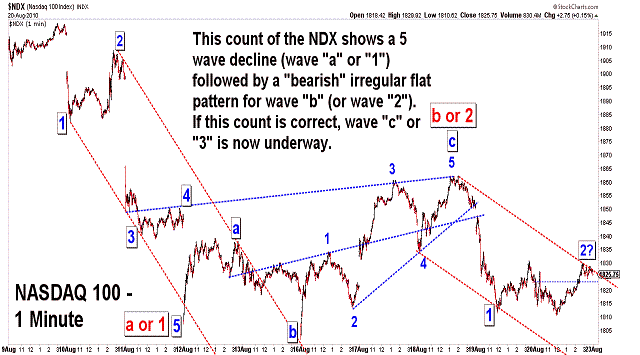
| August 17, 2010 update...Today I finished day 20 of 31 radiation treatments...and the treatments, combined with the medication I am taking, leaves me sleepy all day long. The market action this week has done nothing to energize me...yet (I think a powerful wave 3 decline pill would do it!). The DJIA completed a 5- wave decline yesterday morning (wave 1)...and has sinced traced out an a-b-c corrective pattern (wave 2?). Today's intraday high was in the vicinity of the 50 percent retracement point of the recent decline...and the DJIA' s closing price was right on the 38.2 percent retracement point. If the upward correction is complete, a wave 3 decline is next. Anything short of an immediate decline below yesterday's low would suggest that the wave 2 corrective action is not complete. I think we should know by tomorrow. |
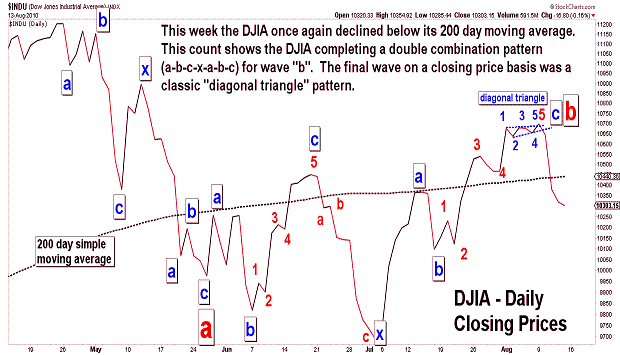
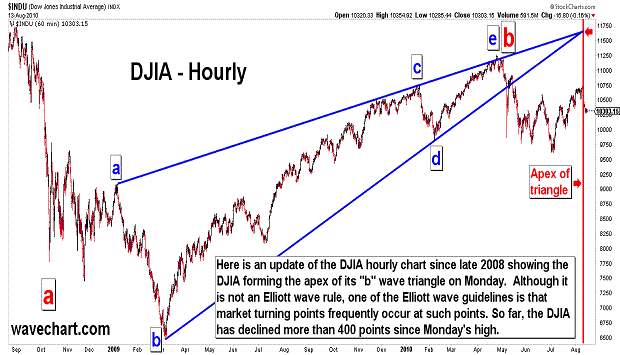
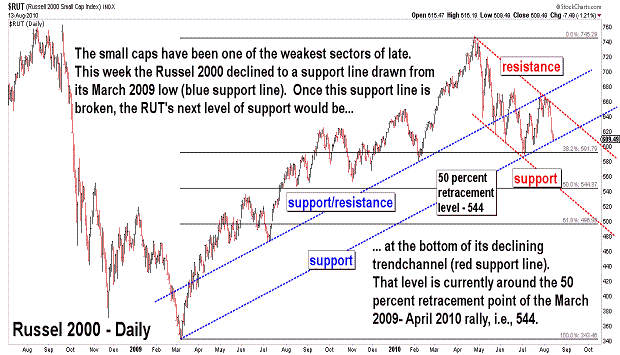
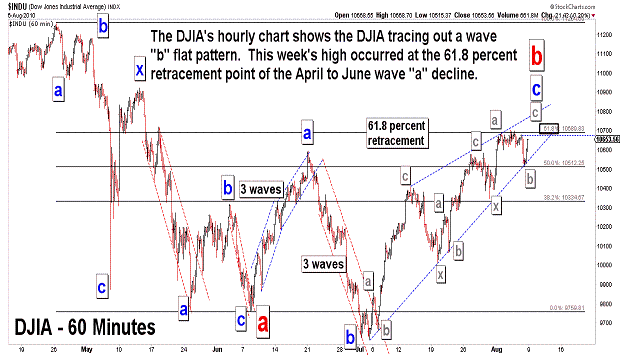
| August 13, 2010 update...My ideal scenario from Tuesday's update did not play out when the DJIA sliced right through the 10551 and 10515 levels on Wednesday...confirming the completion of the July-August rally (these confirmation levels were provided in Tuesday's charts). Both wave counts previously shown (see first and second charts above) remain valid...and have similar outcomes. If the intermediate term "c" wave decline is now, in fact, underway...the DJIA must continue to decline in the coming weeks. Taking out the July 20th low and then the July 2nd low are the next objectives. Two weeks ago in the July 30th upate, I showed a chart of the DJIA's "b" wave triangle pattern and suggested that the market was likely to turn when the triangle formed its apex. Argueably, the apex formed on Monday...and from there the market reversed course and headed south. For the week, the DJIA lost over 3 percent, the NASDAQ over 4 percent...and the extemely weak small caps (RUT) over 6 percent. As you can see in the Russell 2000 chart above, the RUT declined to a support line extending from the March 2009 low. Breaking that line will be another confirmation of much lower prices. For months now there has been much discussion in the press about the likelyhood of a double dip recession. I have long been in the camp that believes a double dip recession is a done deal given the extremely bearish stock market patterns that I see. Another reason for that is the high unemployment rate (see David Rosenberg: Forget The Unemployment Rate, Here's Some Ugly Jobs Data You Probably Missed This Week). I only have to look at my own family's experience with unemployment (two of my children have been trying to get jobs for more than one year)...to see that we are a long way off from the beginning of long term improvements in the economy. |
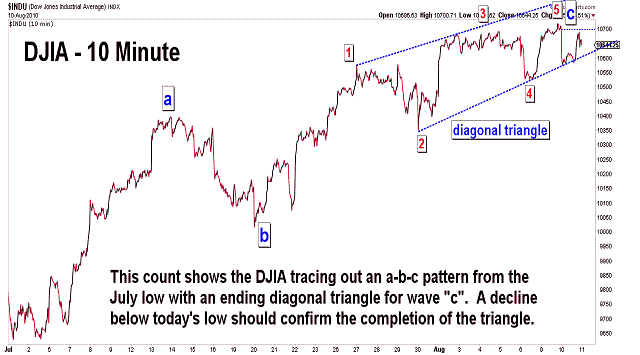
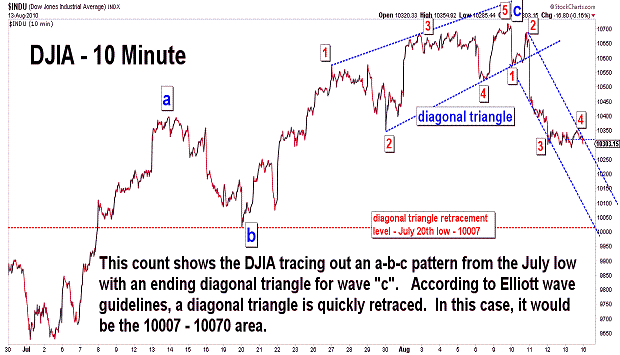
| August 10, 2010 update...As I stare at the DJIA's current pattern, the ideal scenario tomorrow (for me) would be a rally above 10719, then a reversal and a close below 10644. It does not have to happen that way for the rally from July 2nd to be complete and an intermediate term top to be in place...but, it would be very bearish both from a technical and Elliott wave standpoint. Key reversal patterns are frequently (but not always) seen at important market turning points. That has not happened yet. My scenario would produce one. It would also produce an ending Elliott wave "diagonal triangle" pattern at 2 different degrees of trend, i.e., (1) a "c" wave diagonal triangle from the July 2nd low, and (2) a 5th wave diagonal triangle from the July 30th low. What I don't want to see (since I am still bearish) is a powerful rally above the upper resistance lines on the above charts. |
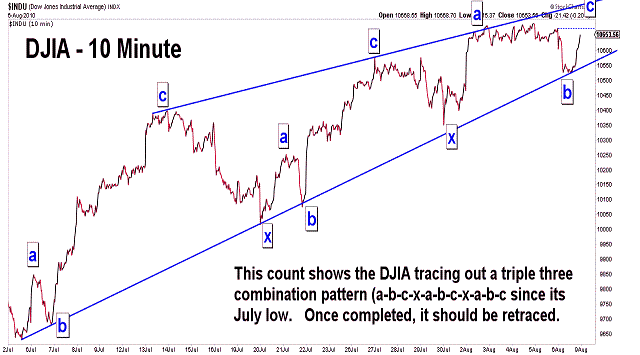
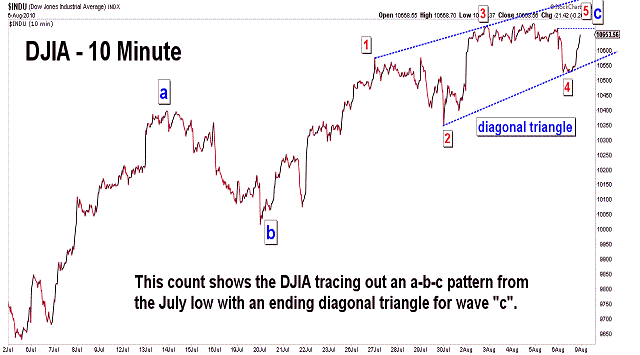
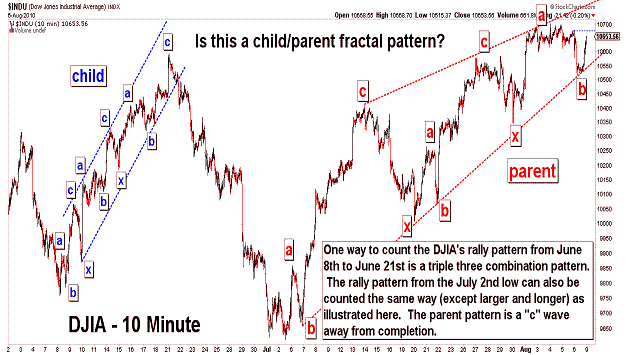
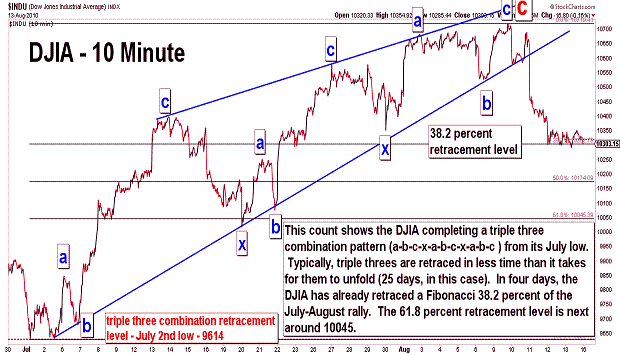
| August 6, 2010 update...Today's late day recovery left most broad market indices higher for the week. The small caps were a notable exception. After worse than expected job numbers this morning, the market sold off...but, it held around 11:00 am at a rising support line from the July low. Given the market'a recovery from this support line, I now think it is likely that a final "c" wave (or 5th wave) rally is underway to complete the entire pattern from the beginning of July. There are a few different ways to count the pattern as I show in the charts above...but, the eventual outcome is the same once the rally pattern is complete, i.e., a decline toward 8700-9400 and eventually lower. An immediate decline below today's low would mean that the final "c" or 5th wave was a "failure"...and the next phase of the intermediate term decline was most likely underway. |
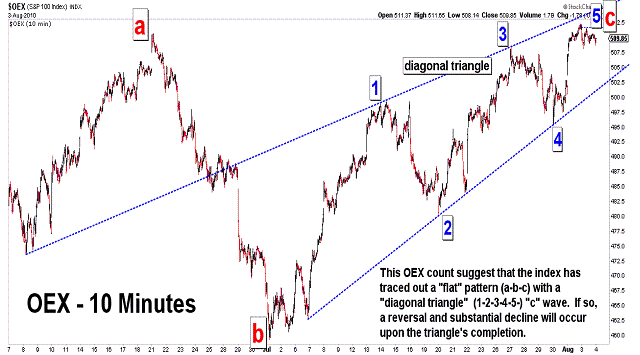
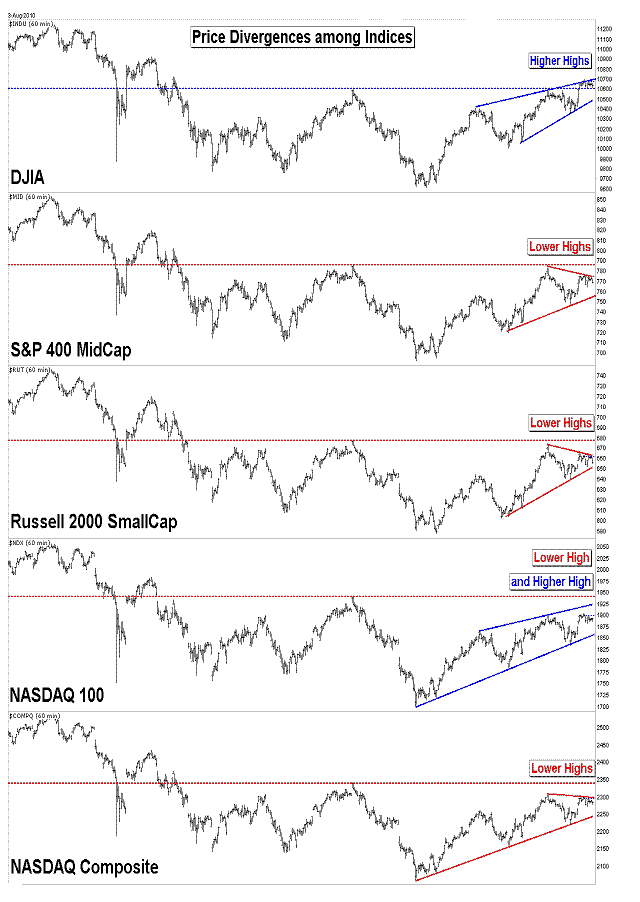
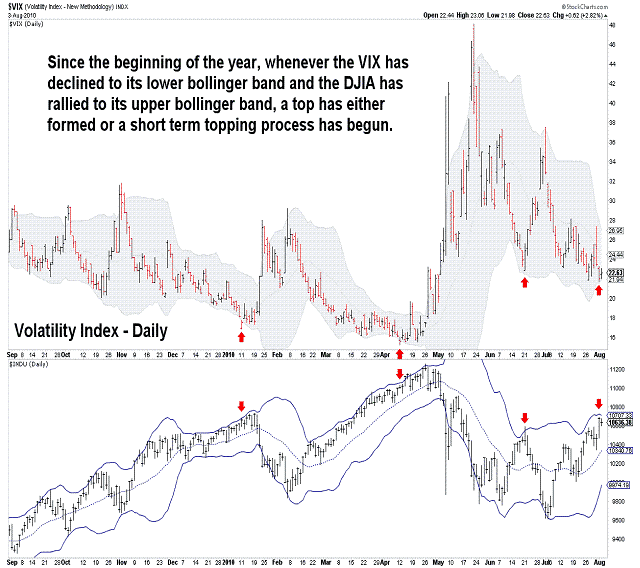
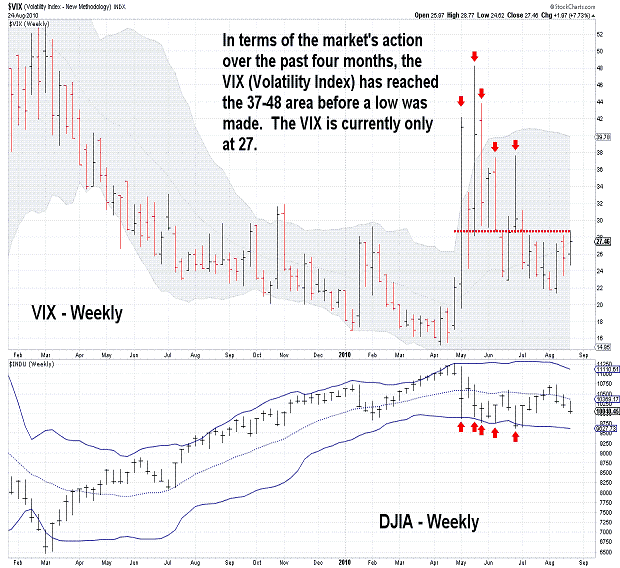
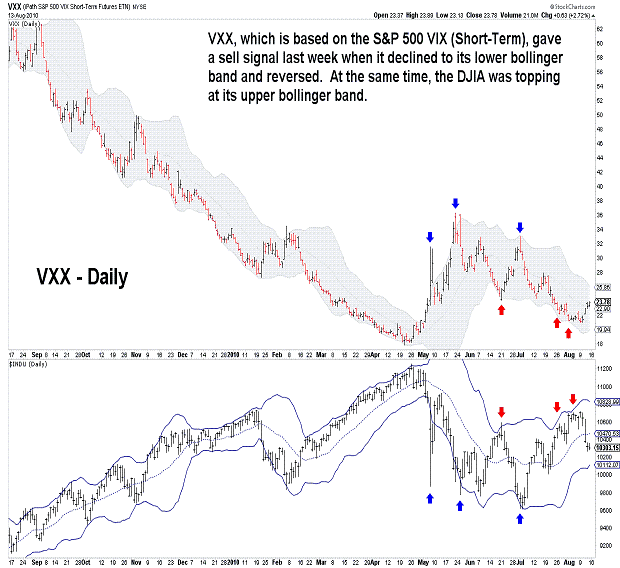
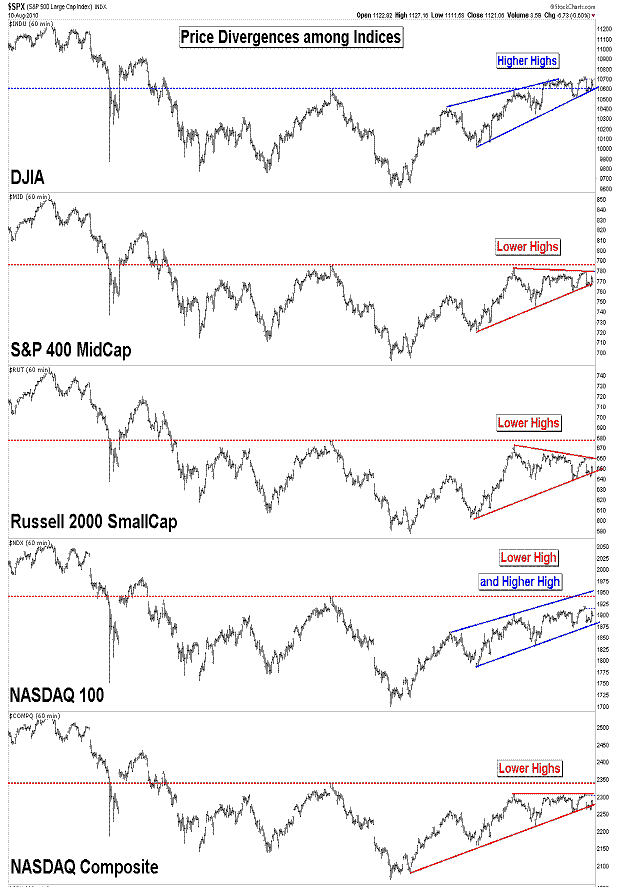
| August 3, 2010 update...Last Friday, I suggested that the door was left "open for one more rally following the current pullback." The rally started immediately at the open yesterday and, according to the wave count I have discussed here in recent updates, should be the 5th wave of an ending "diagonal triangle" pattern that began at the early July low (see second chart above). Cycles suggest that the ideal date for a top is Thursday (see first chart above)...but, several days on either side of that date is good enough given that the pattern already looks complete. Additional subdivisions and complexities are possible to extend the top until Thursday (or abit later)...but, a rally that continues significantly higher from here would cast doubt on the wave count's validity. As you see in the third chart, the broad market indices are diverging pricewise...and that is a common occurence at important turning points. Technicals, like the VIX indicator (see fourth chart above), are also flashing sell signals as they have done previously since the beginning of the year. |
Important: Information and chart access provided herein is educational in nature and shall not, directly or indirectly, be construed as investment advice. No guarantees are made with respect to the accuracy of the information, opinions, predictions, etc. offered here in.
Copyright © 1997 - 2012. The Elliott Wave Chart Blog. All rights reserved. Email
|