|
Charts
IMPORTANT: Chart buy/sell signals are helpful in determining market support and resistance levels...and probable turning points. However, they are only useful if the analyst has a handle on the larger trend. Experience and judgment play a vital role in that determination ...as does Elliott wave analysis.
If a chart does not not appear when you click on the link, you may need to (1) enable javascript, and/or (2) disable pop up blocking for this site, or (3) right click on your mouse and open the link in a new tab or window. Charts will generally appear when you use Internet Exploer or Firefox. Do not use Google Chrome to view charts.
Contact us at info@wavechart.com if you have a question or comment. |
|

Elliott Wave Chart Blog August 2011 Archive
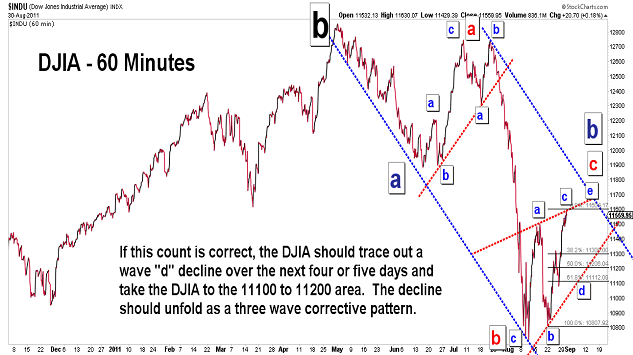
| August 30, 2011 update...There is not much to add to Friday's update. On Friday, I suggested that the DJIA was tracing out a horizontal triangle pattern...with wave "c" in progress. Wave "c" may have ended late today...but, that determination will be confirmed only by a sharp decline tomorrow. Once wave "d" has begun (if it hasn't already done so), it should unfold as a three wave corrective pattern...and take the DJIA toward the 11100 to 11200 area over the next four to five days. |
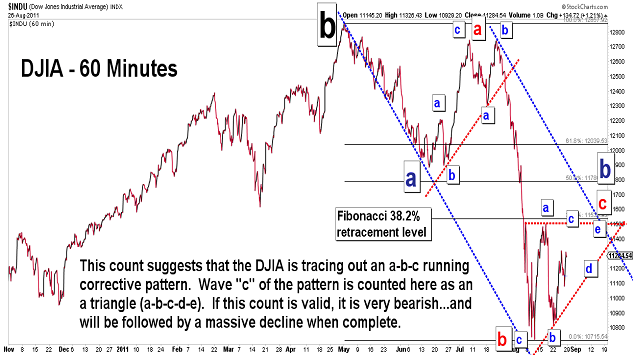
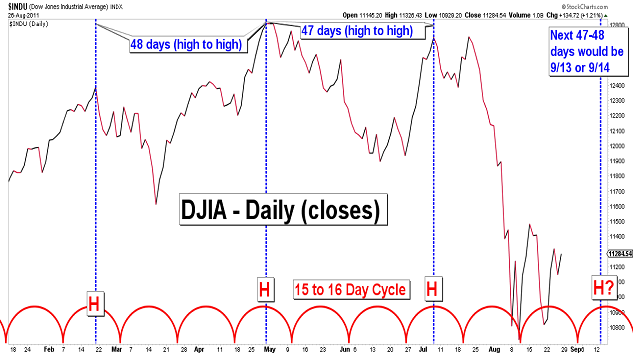
| August 26, 2011 update...The market ended the week in strong fashion...and it appears we may be headed back to test last week's highs. Since the current pattern appears to be taking shape in the form of a series of three-wave corrective patterns up and down, there is an increasing likelyhood that a horizontal triangle (a-b-c-d-e) is unfolding. If so, we are currently in wave "c"...with waves "d" and "e" yet to come. Once complete, the next phase of the decline from the May highs would begin...and, if the the wave count I used in the first chart above is correct, it would be massive. The next cycle high is due around September 13th or 14th...so, we'll see if the market is completing a corrective wave pattern at that time. |
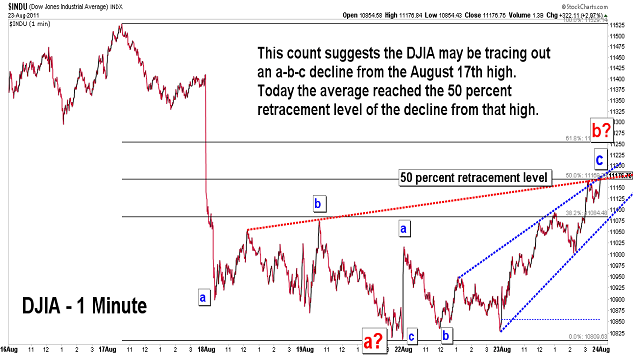
| August 23, 2011 update...The earth shakes and the market rallies more than 3 percent. Who knew? Anyway, the market appears to be tracing out some type of corrective pattern, either up or down. Today's rally carried the DJIA to the 50 percent retracement level of its recent decline from the August 17th high. The rally from the low last Friday counts best as an a-b-c zigzag pattern...and could be the "b" wave of a larger a-b-c declining pattern. We could also be in the "c" wave of an even larger a-b-c pattern from the August 9th low. This latter wave pattern becomes more likely if the market does not reverse to the downside tomorrow. |
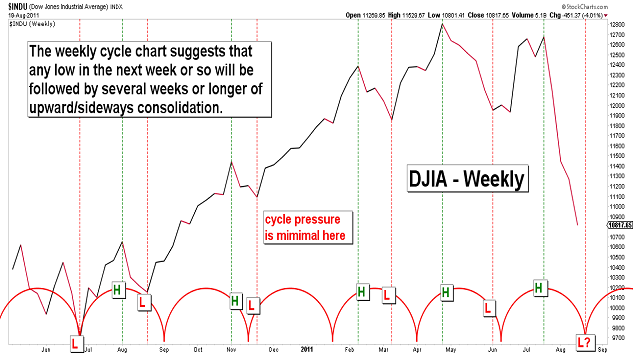
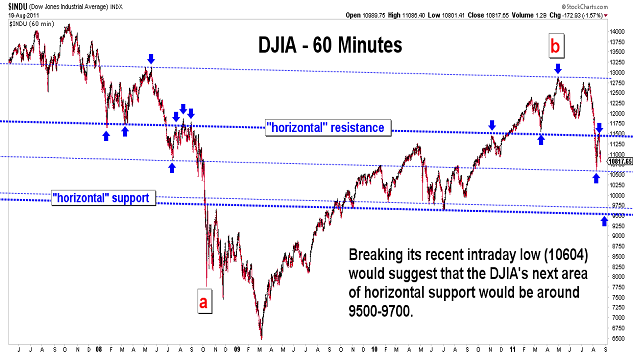
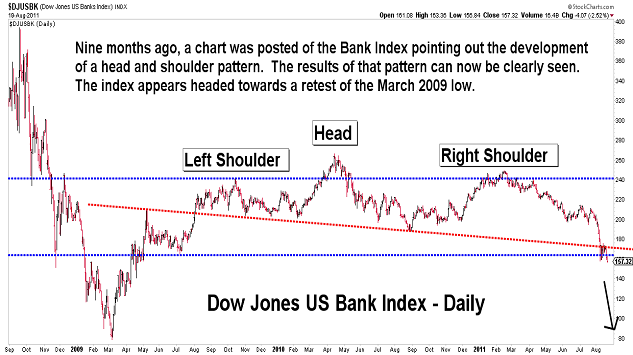
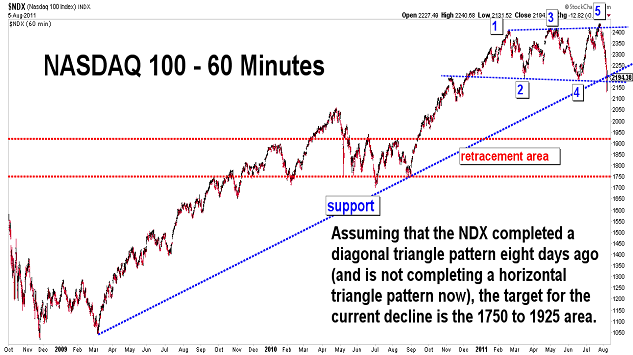
| August 20, 2011 update...The DJIA lost another 4 percent this week; the NASDAQ lost more than 6 percent. If the end of week decline accelerates, next week could be much worse. As you can see on the charts above, the next area of major support for the market is the area of the June/July 2010 lows. Cycles suggest that we are headed for some type of low in the next week or so. When we get there it will undoubtedly be a tradeable bottom (i.e., the start of a countertrend rally lasting more than a few days)...but, we are in a bear market and there are many months yet to go before it will be over. |
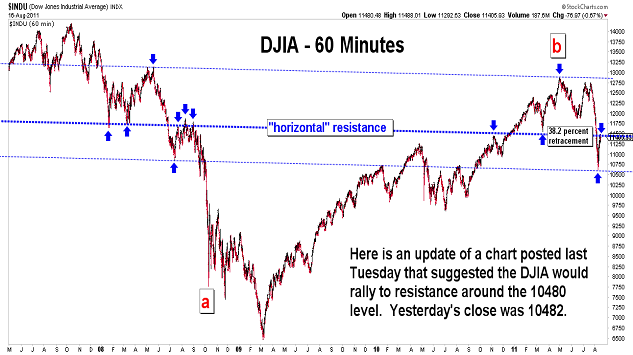
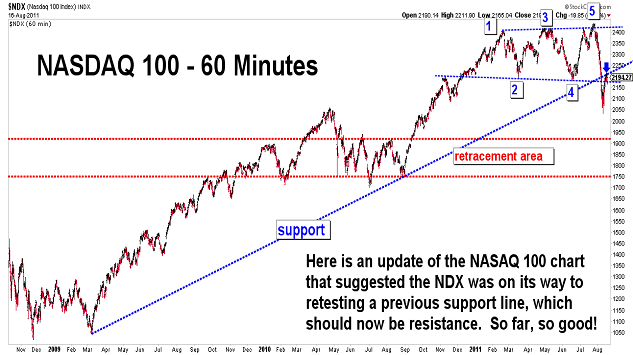
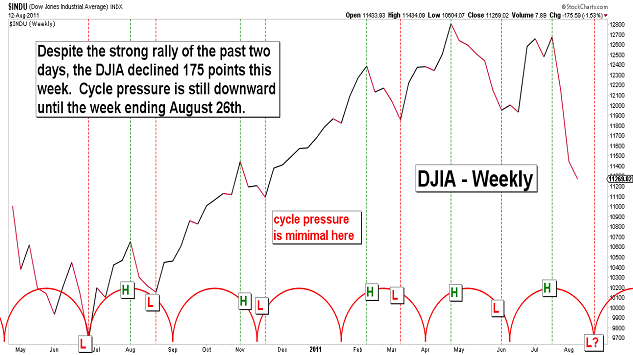
| August 16, 2011 update...Yesterday, the market rallied to the target areas I suggested last week. Unless the corrective pattern from last week's low extends and becomes more complex, the next phase of the intermediate decline should now be getting underway. The weekly chart pattern of the DJIA (using theoretical highs and lows) suggests that the decline from the July 21st high should unfold in three waves (a-b-c)...to match the three wave declining pattern from May 2nd to June 15th. If the timing between the waves is also similar, the next low should be reached in about two weeks. |
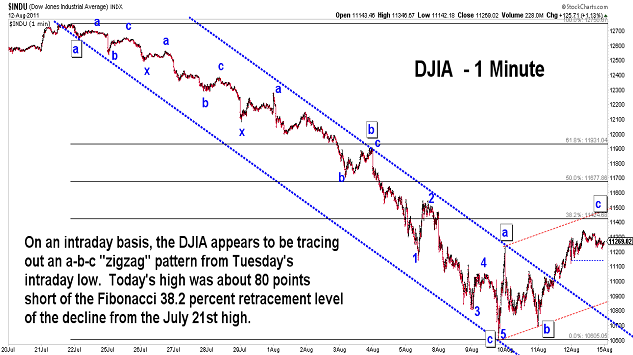
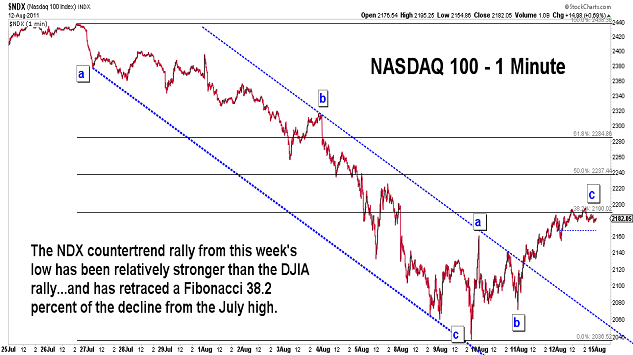
| August 12, 2011 update...On Tuesday I said that a "rally above the trendchannel would suggest that the market has begun a short term countertrend "rally" (consolidation) to correct the decline of the past few weeks." With yesterday's and today's rally through the top of the declining trendchannel, it appears that an a-b-c "zigzag" pattern is unfolding to correct the (three-wave) decline from the July high. With weekly cycles still exerting pressure on the downside for two more weeks, it is unlikely that this corrective pattern will last very long. The next phase of the decline should then begin...and take the market back toward the area of the June/July 2010 lows. |
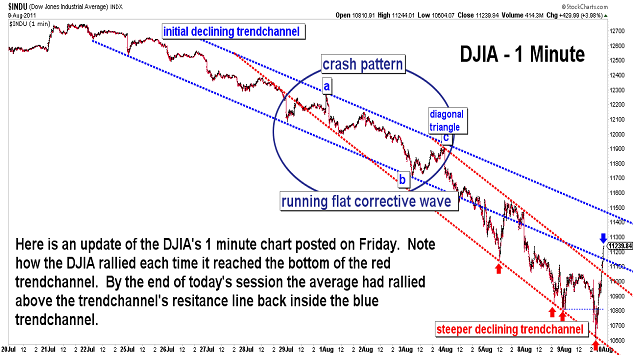
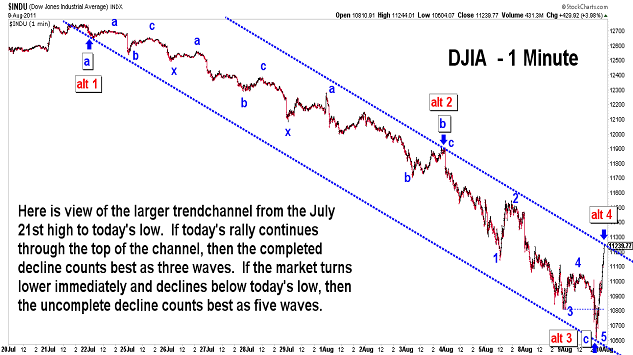
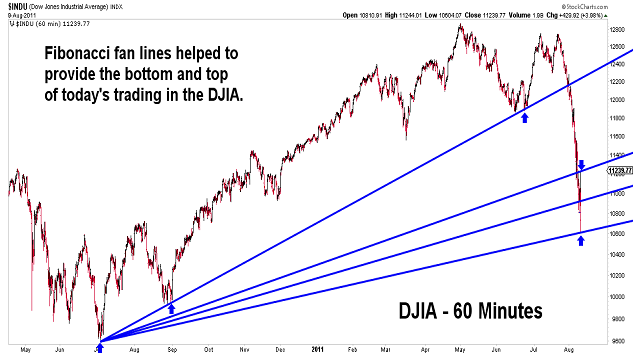
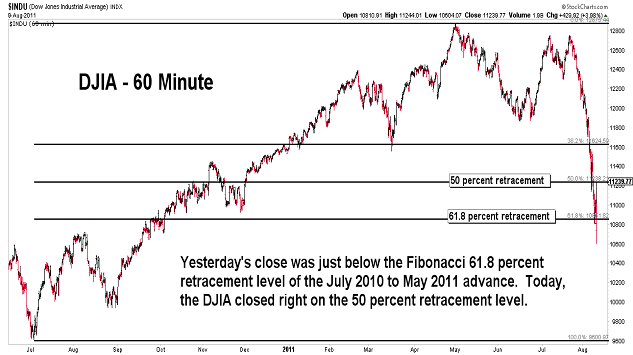
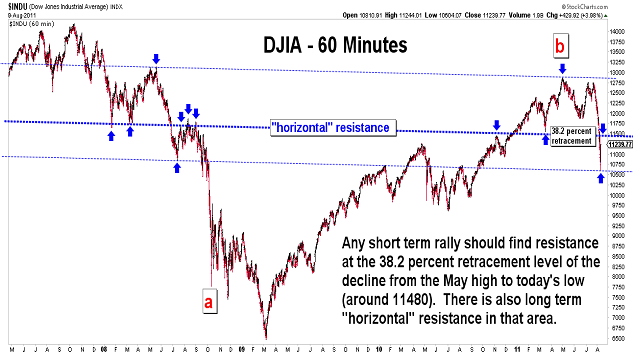
| August 9, 2011 update...The DJIA moved over 1000 points...down then up...during the last two hours of trading today. It closed right at the top of a trendchannel from the July 21st high (see second chart)...and is now at a critical near term juncture. A rally above the trendchannel would suggest that the market has begun a short term countertrend "rally" (consolidation) to correct the decline of the past few weeks. That would leave a three wave pattern in place from the July 21st top. A resumption of the decline right from here (below today's low) would change the pattern to five waves. While the larger long term trend is down, the shorter term pattern, i.e., three waves or five waves, would indicate a slightly different path on the journey downward. There is still a long way to go before the eventual low...in 2012 (my preferred count), or possibly later. |
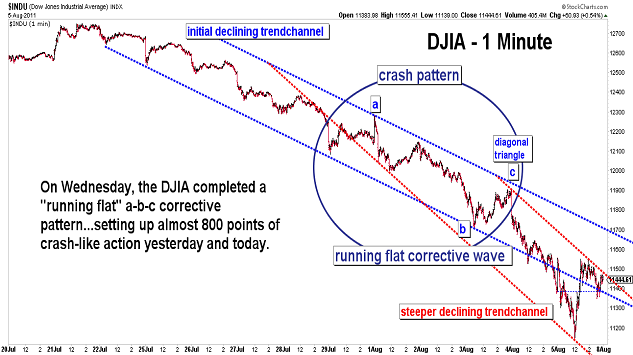
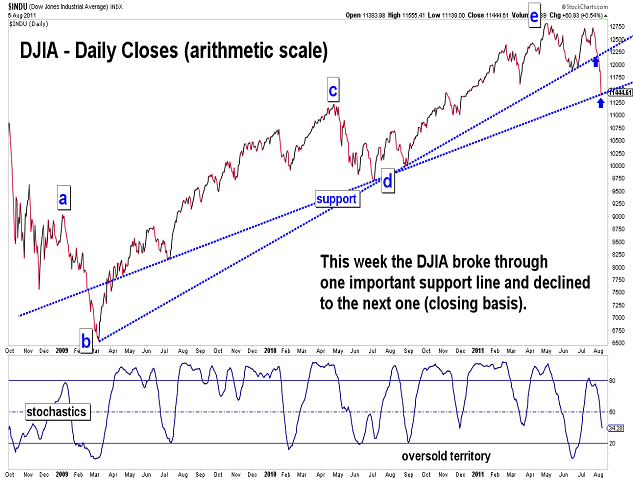
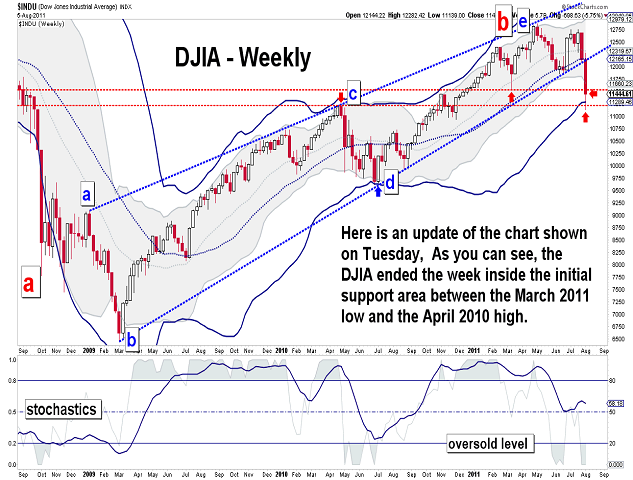
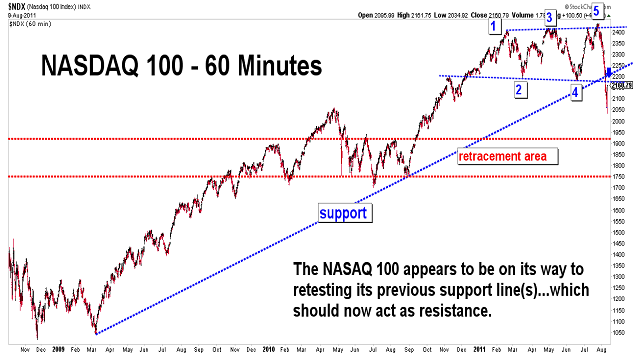
| August 5, 2011 update...The market suffered its worst week since 2008...but, that was not unexpected. In recent updates, I suggested that crash-like action would follow once the DJIA declined below its long term support line. That happened this week and the result was just as predicted. Today's reversal occurred just below the April 2010 high, a level of support I pointed out on Tuesday. I don't think the current decline is over yet. The May/June decline lasted for 32 days...and this one is only 11 days old. Weekly cycles do not bottom out for a few more weeks. Two Fibonacci targets for the decline are around 10870 and then 10230. A complete retracement of wave "e" would take the DJIA below 10,000. But, maybe that's asking too much too soon! |
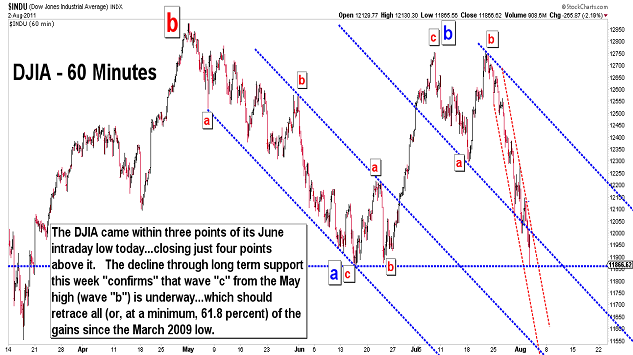
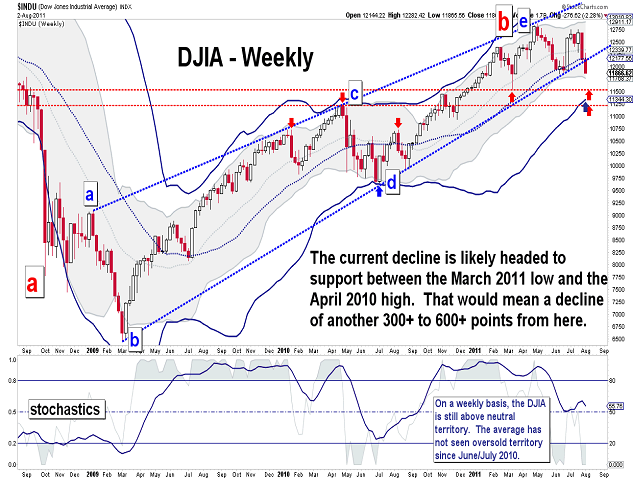
| August 2, 2011 update...On Friday, I said "(i)f the Congress acts this weekend, there could be a relief rally early in the week...postponing (for a short time only) a collapse next week." Well, we did get a relief rally first thing yesterday morning...but, even I must admit that I was surprised that the collapse postponement lasted only a matter of minutes. Long term support was broken yesterday...then retested yesterday afternoon. Today's substanital decline followed...with much more to come. The next support area for the DJIA occurs between the February 2010 highs and the March 2011 lows. Given the Elliott wave pattern from the June/July 2010 lows (as I count it), I think a decline all the way back to the 10000 area is not out of question in the coming weeks. Of course, it could take longer than that...but, even that area should not hold as the low during the coming year. |
Important: Information and chart access provided herein is limited to current subscribers only and shall not be forwarded or retransmitted without written authorization. It is educational in nature and shall not, directly or indirectly, be construed as investment advice. No guarantees are made with respect to the accuracy of the information, opinions, predictions,etc. offered here in. The username/password provided to a subscriber is unique and it is the sole responsibility of the subscriber to protect the confidentiality of said username/password and to further protect it from any unauthorized use.
Copyright © 1997 - 2013. The Elliott Wave Chart Blog. All rights reserved. Email
|