|
Charts
IMPORTANT: Chart buy/sell signals are helpful in determining market support and resistance levels...and probable turning points. However, they are only useful if the analyst has a handle on the larger trend. Experience and judgment play a vital role in that determination ...as does Elliott wave analysis.
If a chart does not not appear when you click on the link, you may need to (1) enable javascript, and/or (2) disable pop up blocking for this site, or (3) right click on your mouse and open the link in a new tab or window. Charts will generally appear when you use Internet Exploer or Firefox. Do not use Google Chrome to view charts.
Contact us at info@wavechart.com if you have a question or comment. |
|

Elliott Wave Chart Blog September 2010 Archive
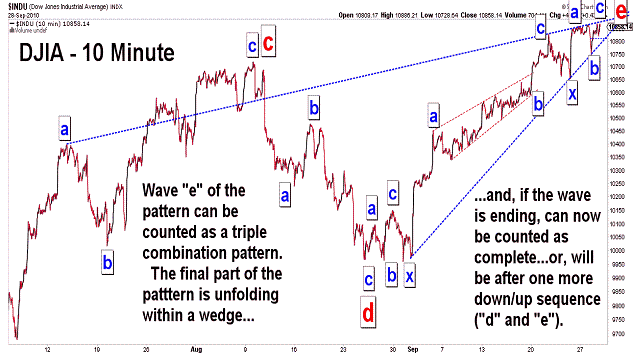
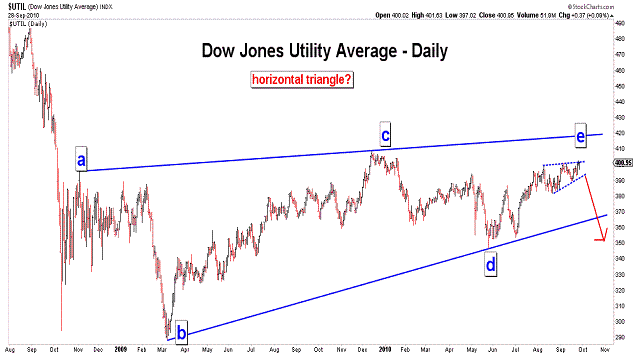
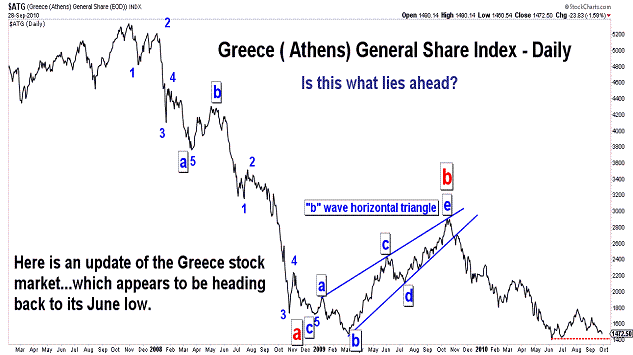
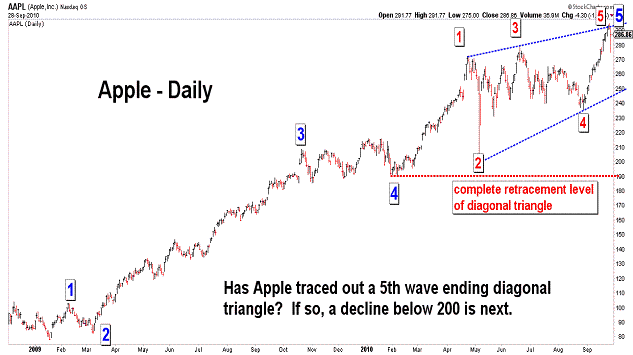
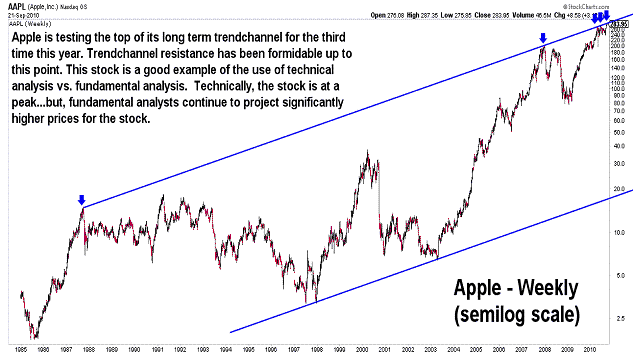
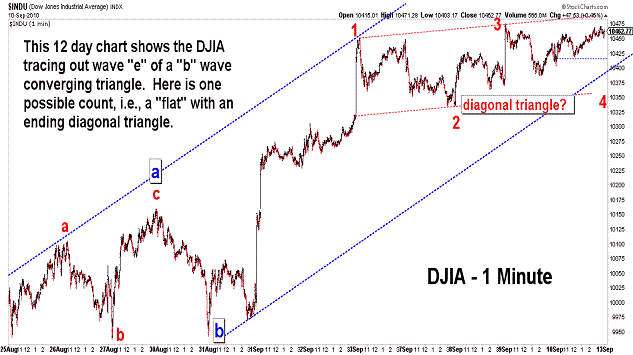
| September 28, 2010 update...Today the DJIA closed 2 points below Friday's high...after making a new intraday high for the third consecutive day. I discussed the possibility of a diagonal triangle top in the last few updates...and, as you can see in the DJIA's 10 minute chart, it may indeed be taking place (note the clear wedge shape of the pattern). A powerful move should emerge at the conclusion of this pattern. The technicals and wave count I am using suggest it will be downward. A resolution of this pattern one way or another should be imminent (barring an extension and added complexity). Tonight, I also posted charts of the Dow Jones Utility Average, Greece's Athens General Share Index and Apple. A case can be made that each of these charts can now be viewed as supporting a signficant decline. We'll see. |
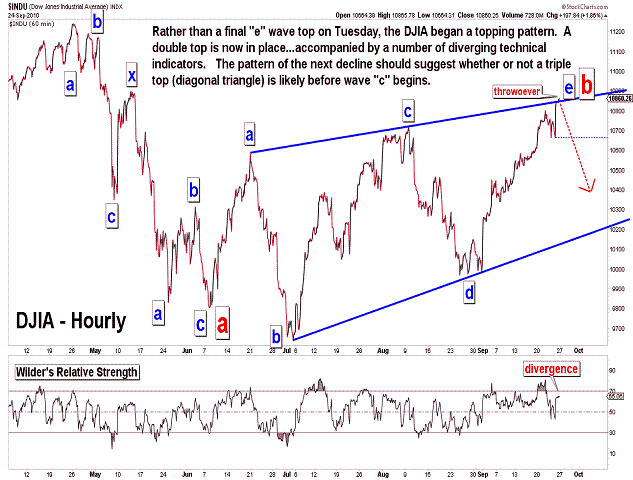
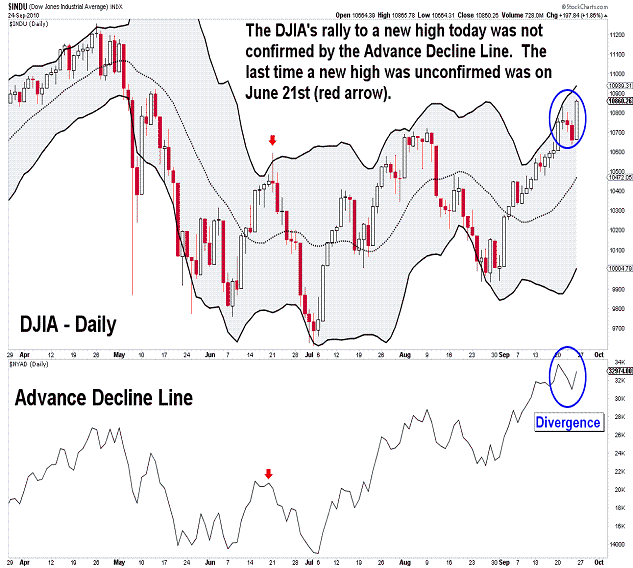
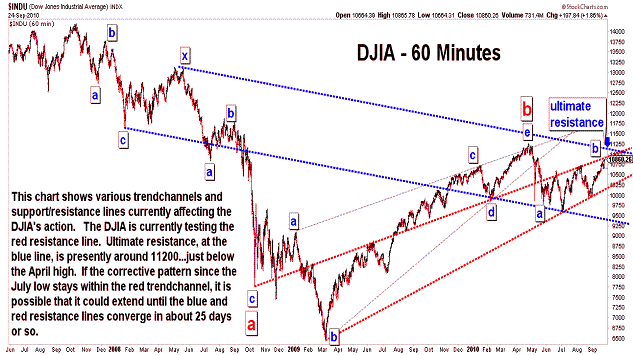
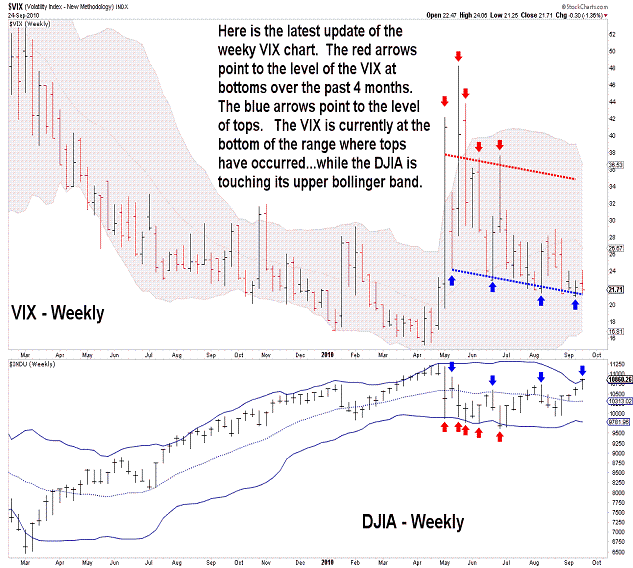
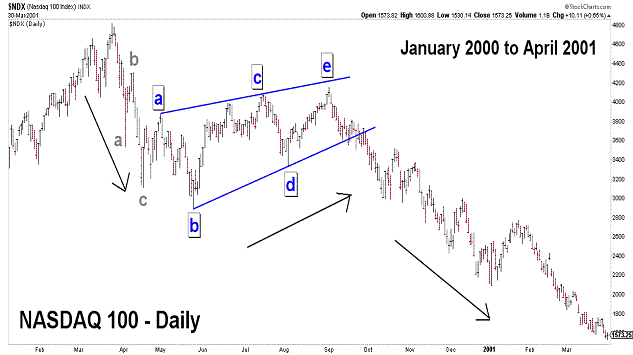
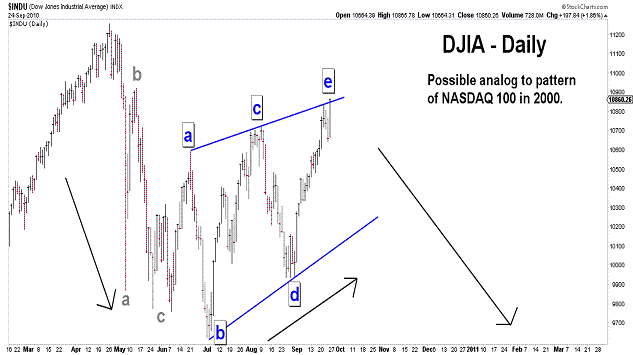
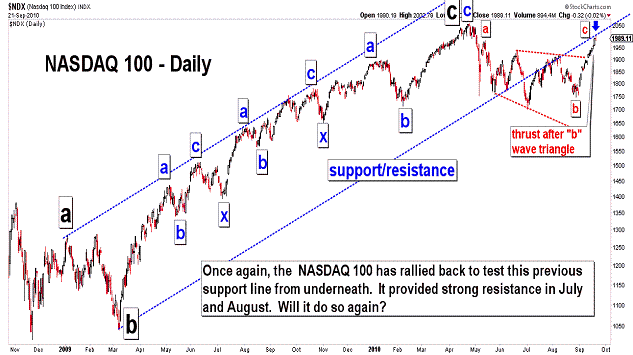
| September 24, 2010 update...After Tuesday's update, the market reversed to the downside...not enough, however, to confirm a trend reversal. Instead of a final top, it was merely the beginning (I believe) of a topping pattern. Most indices today exceeded their earlier week highs...but, there were exceptions (OEX, XMI, RUT, XII, NYSE Advance Decline Line). Price divergences like this are often seen at important turning points. In this case, possibly, it could prove short-lived because it will only require a tiny rally next week to cure the problem. Still, more technical evidence is accumulating than an important top is near. In addition to price divergences among the indices, there are many technical indicators that are not confirming the higher prices. In any event, a short term double top is in place. It will now be necessary to examine the character of the next selloff to determine whether or not it will take a triple top (or diagonal triangle pattern) to complete the topping process. Yesterday's low of 10640 is the key. Finally, I posted a chart of the NASDAQ 100 from January 2000 to April 2001. The pattern of that decline in the NDX from its all time high bears a very strong resemblance to the pattern of the DJIA since its April high this year. If the analog continues, a major multi-month "c" wave decline will soon begin. We'll see. |
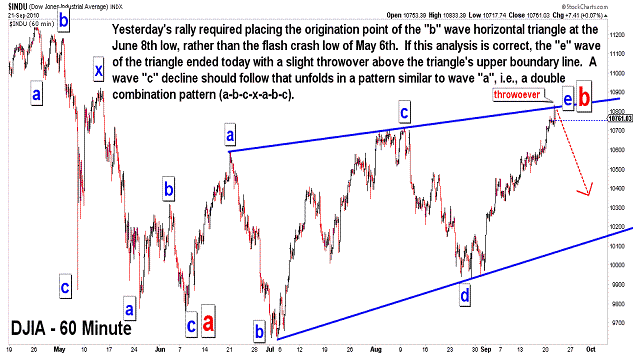
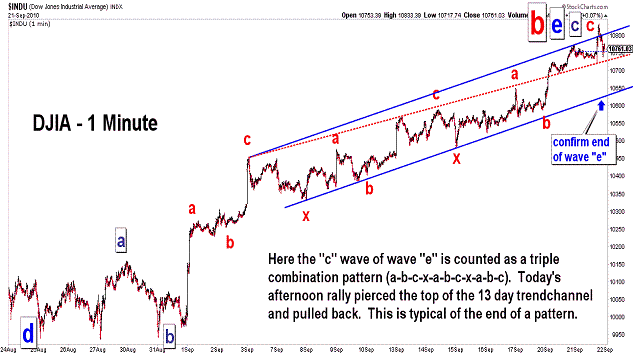
| September 21, 2010 update...As I pointed out on Friday, there is a Fibonacci turn window in play for the first part of this week. That particular time cycle may have had an effect on today's action...which had many characteristics of a reversal day...with many of the broad indices forming "key reversal" patterns (the DJIA was one exception). Please note that there is a slight change in the wave count from Friday's update. Yesterday's strong rally above 10719 required me to relabel the subwaves of the "b" wave horizontal triangle pattern that has been discussed here for a few weeks. Instead of originating after the flash crash of May 6th, the count works best now from the June 8th low. Of course, in order for the count to be valid, the market must reverse lower from here (or, alternatively at a minimum, trace out a small diagonal triangle topping pattern). If the market holds up much beyond next week, I would have serious doubts about this count. Initial confirmation that a significant selloff is underway will be a decline below last Friday's close of 10607. |
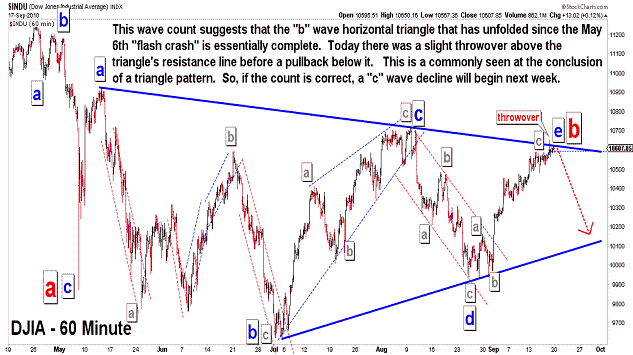
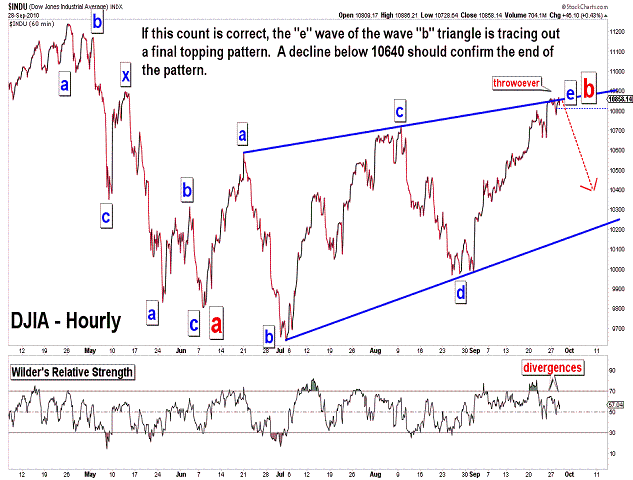
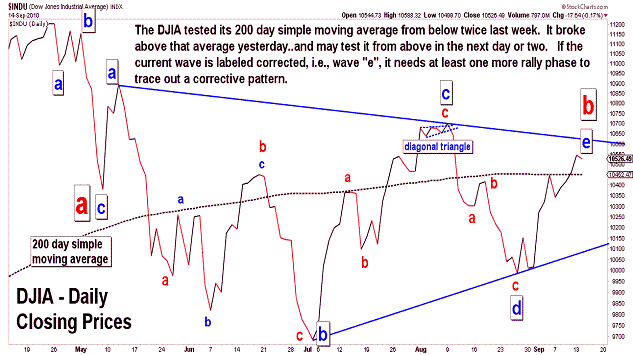
| September 17, 2010 update...In recent updates, I have discussed the formation of a "b" wave converging triangle since the May 6th "flash crash". Well, the validity of that wave count will now be put to the test. The three most important elements of Elliott wave analysis, i.e, price, pattern and time, are now aligned. Pattern: the horizonal triangle pattern appears to be complete (or nearly so). There was an "e" wave throwover this morning...which is very common at the end of a triangle pattern. Price: the 61.8 percent retracement area (106130) of the April 26th high to July 2nd low range was successfully tested. Time: on the Fibonacci daily chart, Monday will be the 144th day since the April 26th high (also 89th day since June 21st high). Interestingly, there was a 144 day period that preceeded the March 2009 low...which began at the October 2008 "crash" low. If there is some type of "symbiotic" relationship between these periods, can we expect "crash" type action to follow the current 144 day period? We'll see! |
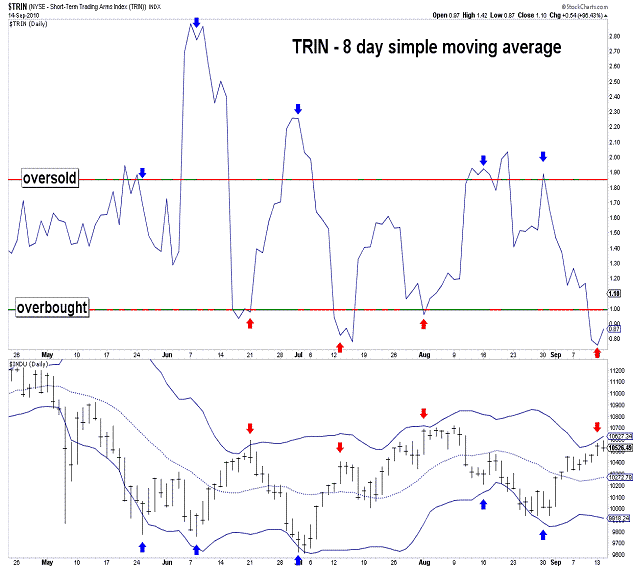
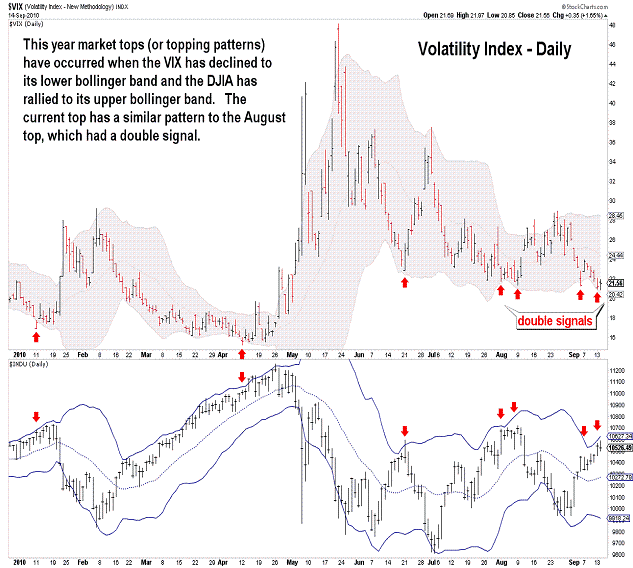
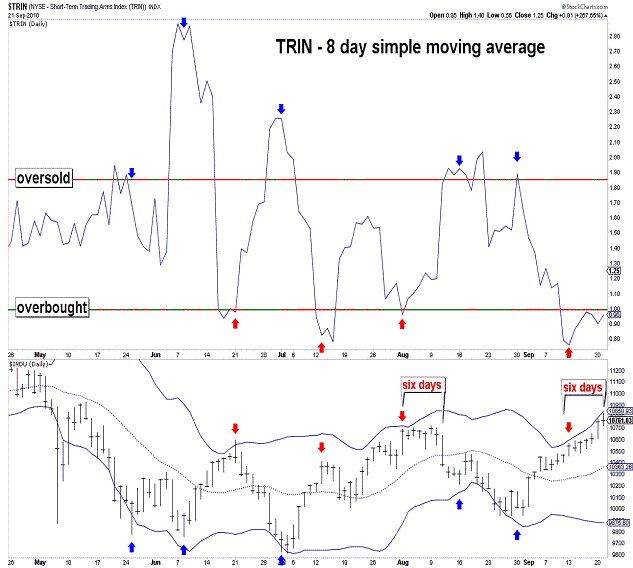
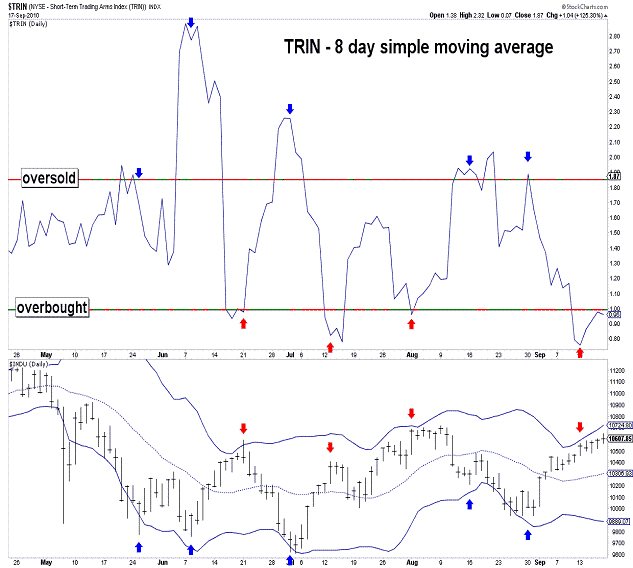
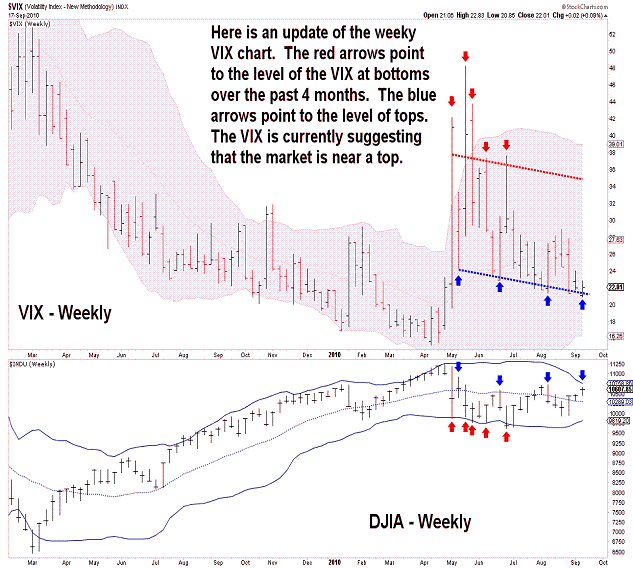
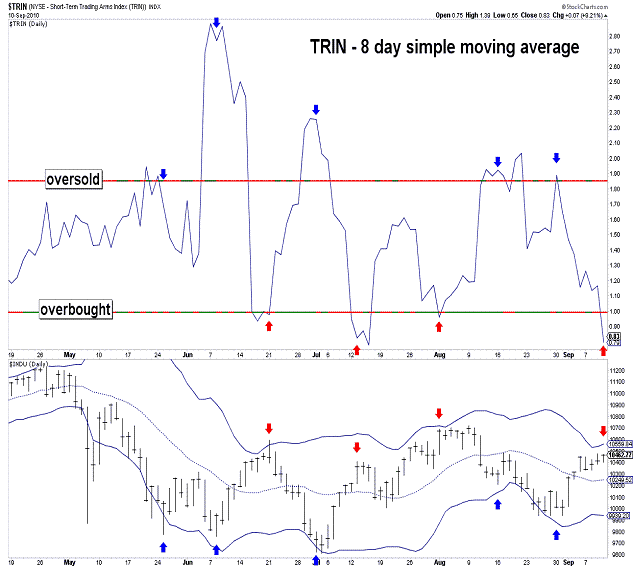
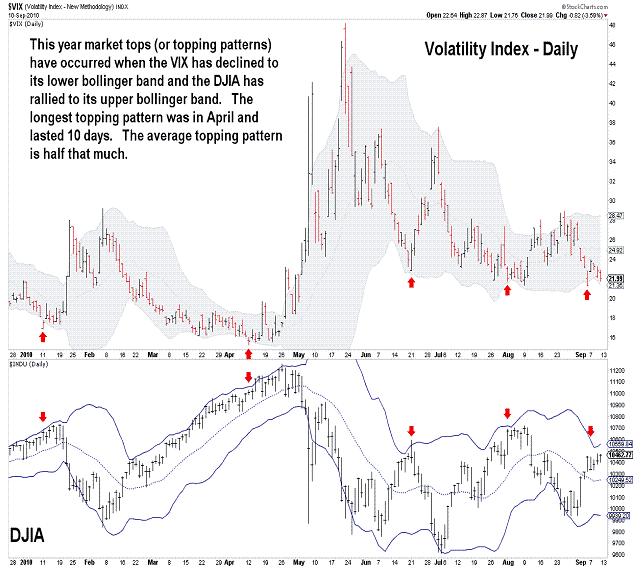
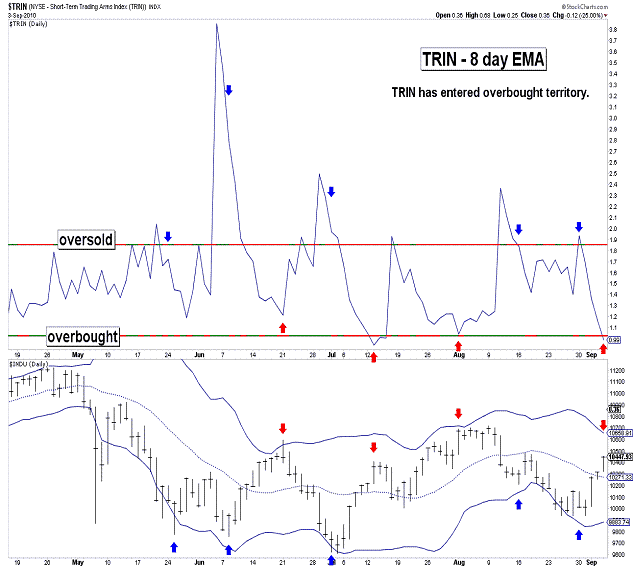
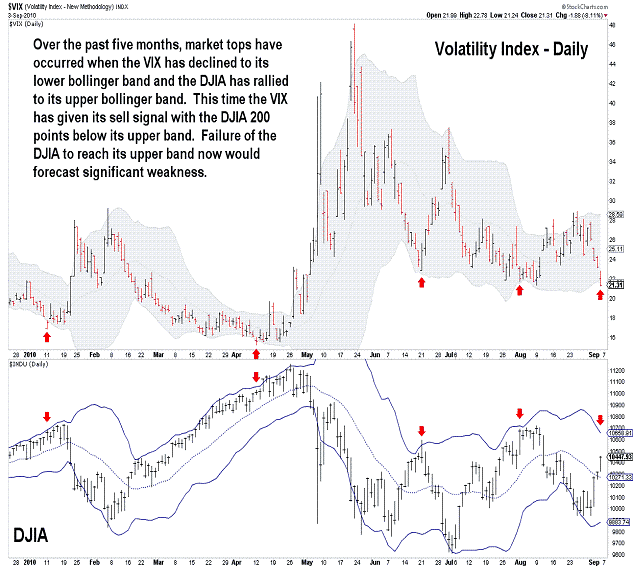
| September 13, 2010 update...There is not much to say since Friday's update. Tonight's charts simply update the charts that were posted on Friday. As you can see, the "b" wave triangle wave count remains the same (although wave "e" is slightly altered). The two technical indicators (TRIN and VIX) are still in "sell" territory, perhaps even more so. With respect to Friday's comment about the put/call ratios...the CBOE equity put/call ratio has moved to a level that has coincided with some recent tops...but, not so for the CBOE total put/call ratio. This could be an indication of some near term weakness before a final rally and top soon thereafter. We'll see. |
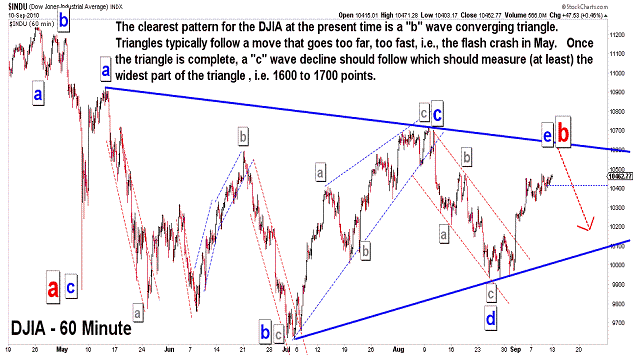
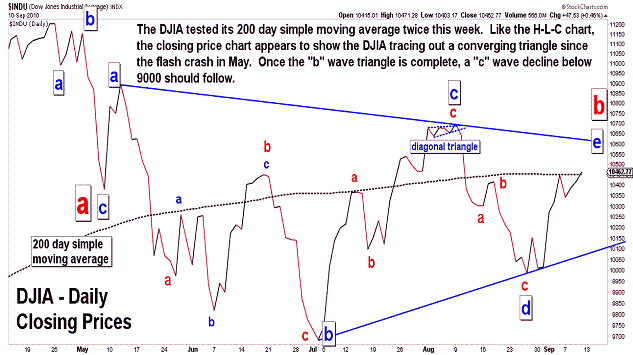
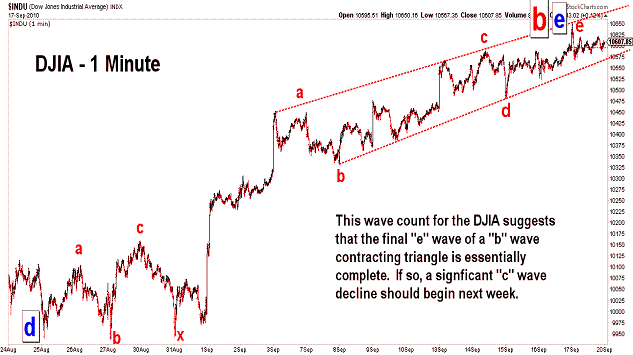
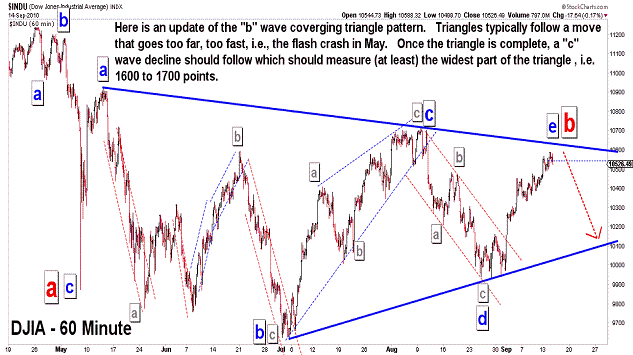
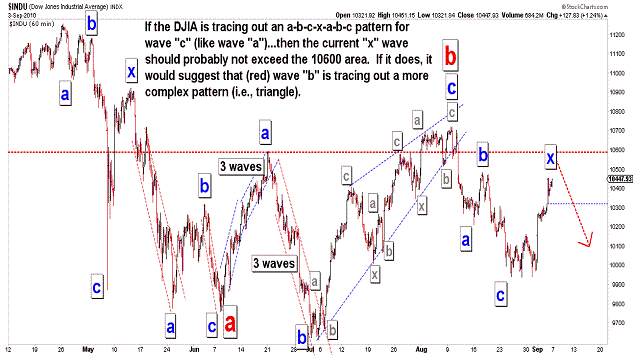
| September 10, 2010 update...Last week's strong gain in the DJIA was followed this week by a nominal 15 point gain. The NASDAQ provided relatively stronger gains for most of the week. Last week, in one of my charts, I speculated about the possibility of a triangle wave count if wave "b" was not complete at the August 9th high. I think the time has finally come to consider that count the best fit to the market's action since the flash crash on May 6th. And, actually there is some logic to this count. Triangles typically follow market action that moves too far...too fast. That certainly happened on May 6th. But, who would have guessed that it would take more than four months of sideways action to correct that one day of immense volatility? If this "b" wave horizontal triangle count is correct, then the final "e" wave is unfolding...and it should be complete shortly. Once complete, wave "c" will unfold...and it should take the DJIA (at least) 1600 to 1700 points lower (the approximate distance of the widest part of the triangle). More technical indicators this week moved toward an overbought condition...setting up (or confirming) the likelihood of a near term top. One exception is the put/call ratio. I am not sure why, but the put/call ratio has been giving some poor signals lately. We won't have to wait too long to find out if this another one! |
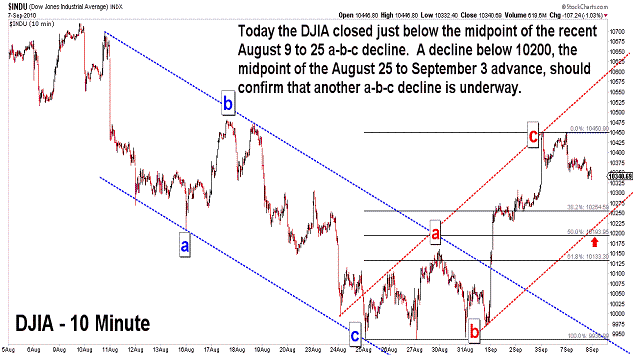
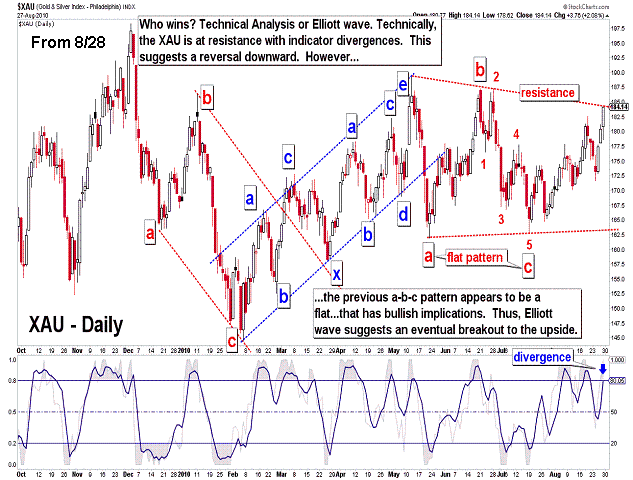
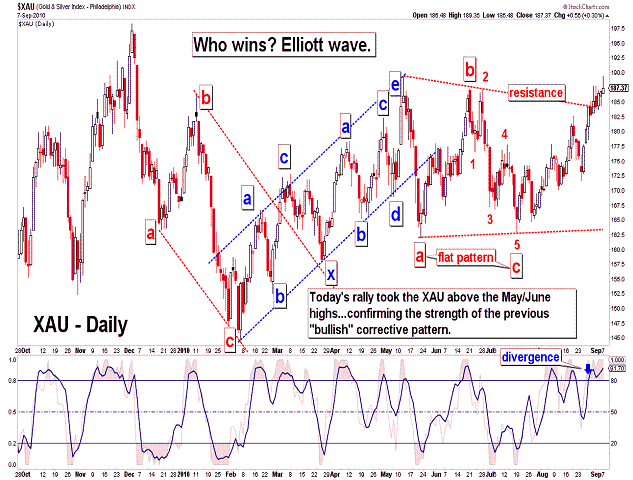
| September 7, 2010 update...Today's triple digit decline brought the DJIA back to the midpoint of its recent August 9th to August 25th a-b-c decline. The rally of August 25th to September 3rd can be counted as a complete countertrend a-b-c pattern. A close below 10200 would likely confirm that another a-b-c decline is underway...and it should challenge the July lows around 9600. XAU update: I posted a chart of the XAU on August 28th that illustrated an interesting "conflict" between technical analysis and Elliott wave analysis (second chart above)...regarding the index's near term direction, i.e., reversal or breakout. We now have a "winner"...it is Elliott wave (third chart above). |
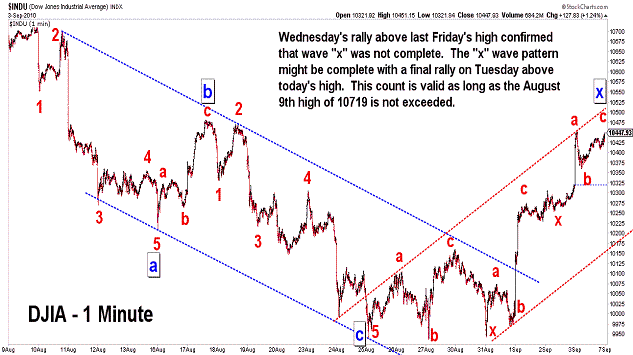
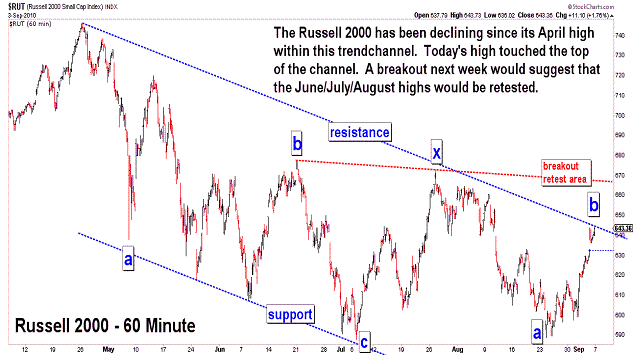
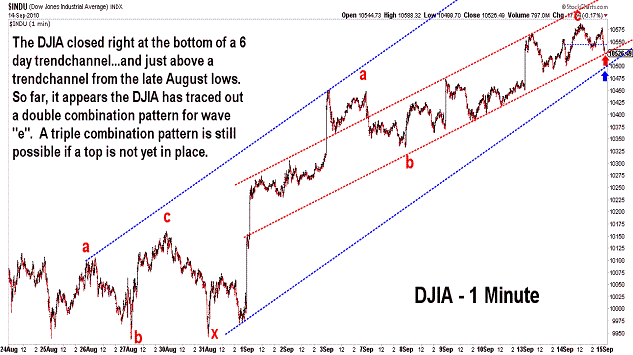
| September 3, 2010 update...Market declines on Monday and Tuesday proved to be a false indication of short term weakness...as the the DJIA closed up each day thereafter...ending 3 percent higher for the week. Wednesday morning's rally cut right through last Friday's high indicating that my wave "x" count was incomplete (see first chart above)...and that the wave "x" pattern continued to unfold today. The strength of the rally has opened the door for some alternate wave counts, especially if the 10600 area is exceeded. Technically, the market is not yet overbought (also there are no serious divergences to report)...but some of the short term technicals are suggesting that, at a minimum, a topping pattern could begin from here. Sepember is typically one of the weakest months of the year...so, we'll see if history weighs in the holday-shortened action next week. Personal Note: I appolgize for the lateness of today's update. I finished my radiation treatments on Wednesday...so that, at least, is one thing off of my plate...hopefully...for the rest of my life (unending doctor visits are another story). Completely unrelated to that, a former colleague of mine in the legal profession recently asked me to assist him with some time sensitive legal work...so, I have been getting back to my office rather late. I am keeping my eye on the market during the day...but, I will have to do my stock market analysis later in the evening. As a result, some updates may, from time to time, be posted closer to 10-11pm. Thanks for your understanding. |
Important: Information and chart access provided herein is educational in nature and shall not, directly or indirectly, be construed as investment advice. No guarantees are made with respect to the accuracy of the information, opinions, predictions, etc. offered here in.
Copyright © 1997 - 2012. The Elliott Wave Chart Blog. All rights reserved. Email
|