|
Charts
IMPORTANT: Chart buy/sell signals are helpful in determining market support and resistance levels...and probable turning points. However, they are only useful if the analyst has a handle on the larger trend. Experience and judgment play a vital role in that determination ...as does Elliott wave analysis.
If a chart does not not appear when you click on the link, you may need to (1) enable javascript, and/or (2) disable pop up blocking for this site, or (3) right click on your mouse and open the link in a new tab or window. Charts will generally appear when you use Internet Exploer or Firefox. Do not use Google Chrome to view charts.
Contact us at info@wavechart.com if you have a question or comment. |
|

Elliott Wave Chart Blog September 2011 Archive
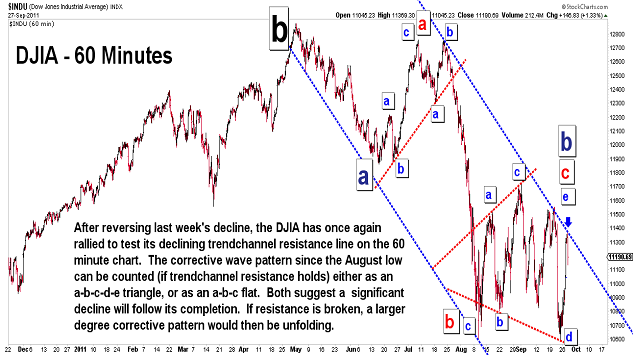
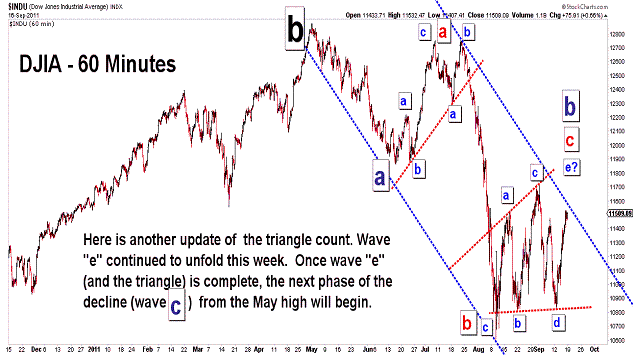
| September 27, 2011 update...The DJIA rallied to its declining trendchannel resistance line today before reversing and giving back more than half of its gains. The question now is...will this resistance line hold or will the DJIA break through it and complicate the corrective pattern that has unfolded from the August low? Right now that corrective pattern can be counted as a "triangle"...or a "flat". If it is a "flat", however, the current "c" wave probably needs more development...since it does not count well as a 5-wave pattern. But, if the "c" wave pattern is anything other than a "diagonal triangle", the trendchannel resistance line is likely to be broken...and this would probably lead to a continuation of the short term rally. In any event, the long term decline will resume once the pattern is complete. |
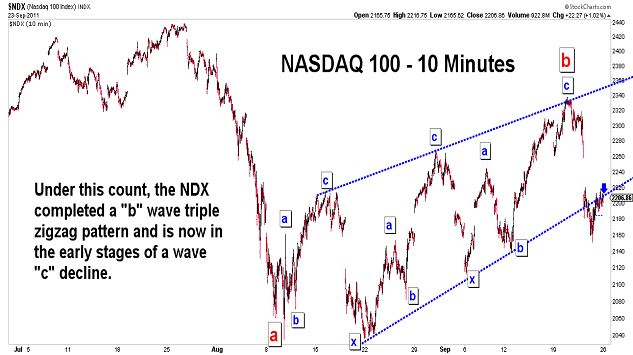
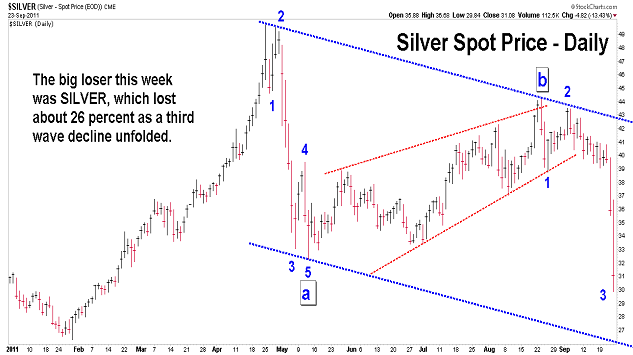
| September 23, 2011 update...It's nice to be home and back to a normal routine. On Tuesday, I commented that the indices (DJIA and NDX) had reached trendchannel resistance and now had the potential for "something big on the downside". Well, that certainly did happen. Assuming my preferred wave count is valid, more downside action should follow in the coming week(s), with further declines potentially extending more than 1000 points (if long term support lines are tested). We'll see. By the way, how about SILVER this week! (I sold my ZSL position today...maybe too soon.) |
| September 19, 2011 update...Here is a quick chart update from California. The DJIA's action continues to support my preferred triangle wave count, so far. I would expect a top to form some time this coming week. |
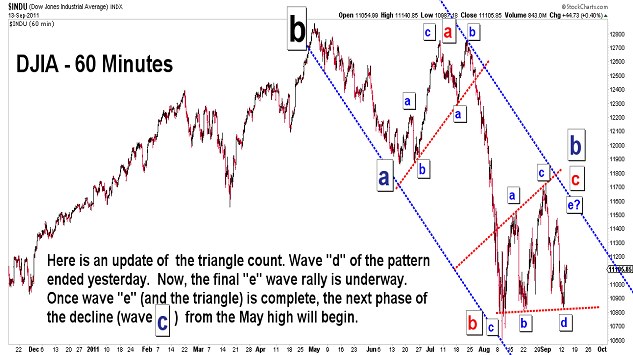
| September 13, 2011 update...So far, my preferred triangle wave count seems to be working. If so, the current (and final) "e" wave rally will trace out three waves to complete the pattern. Assuming that happens, a major wave "c" collapse will follow. But, one step at a time! I am heading to California tomorrow for a week. If I have access to a computer I will try to post an update sometime this weekend. |
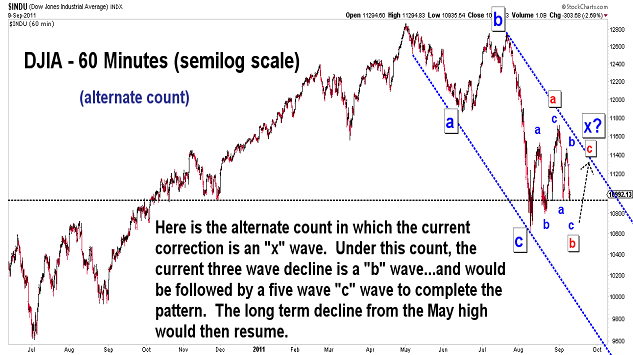
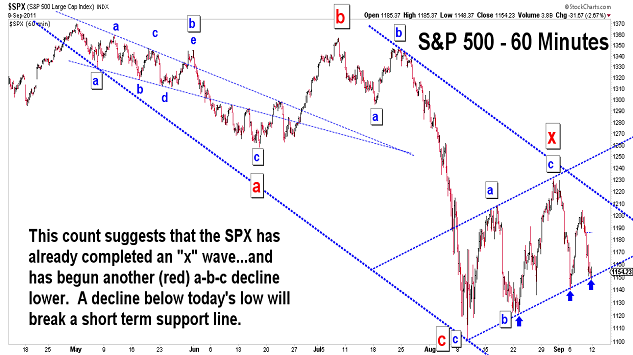
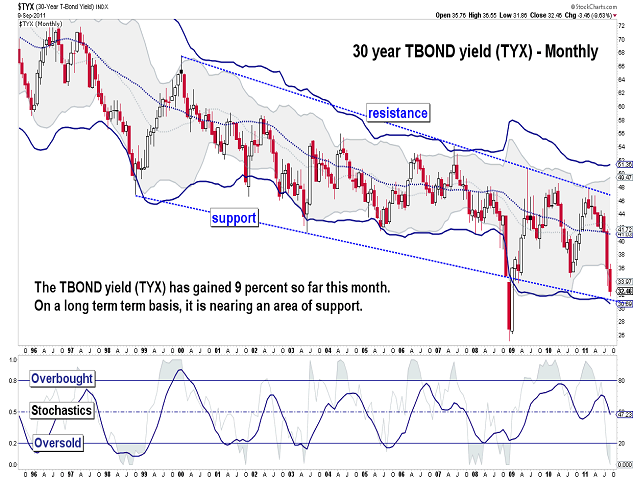
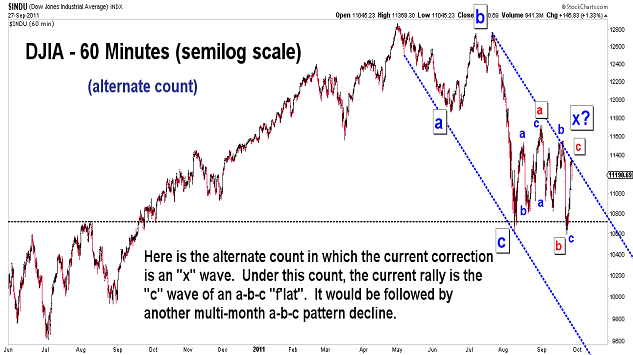
| September 9, 2011 update...The market tested a short term support area today (see S&P 500 chart) and held. If this level is broken next week, a test of the August lows should follow. The current pattern still suggests that the market is consolidating/correcting the July/August decline...with several different wave count possibilities still being available, depending on how low we go next week. The first three charts above suggest three of the market's options, i.e., alternate counts. Although I would personally like to see the market collapse sooner than later, given the market's oversold condition and high put/call ratio, I think one more rally pattern is very likely before we complete the current corrective pattern from the August low. We'll see. |
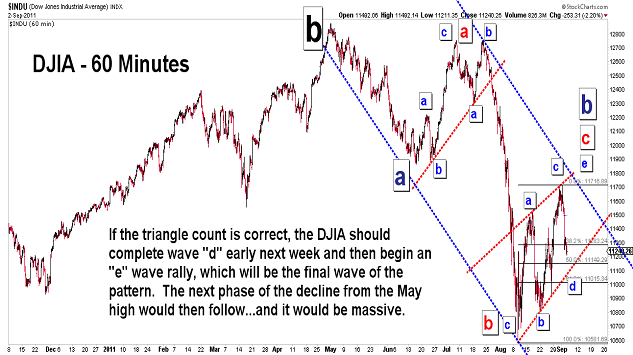
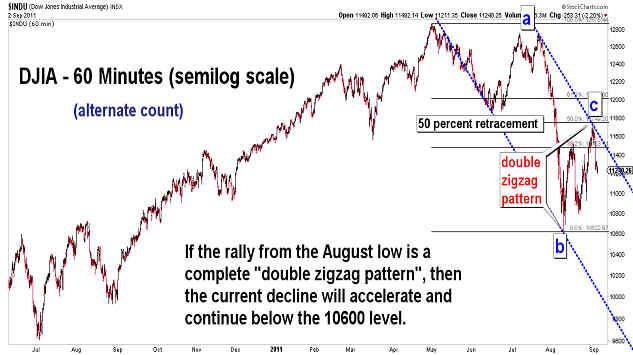
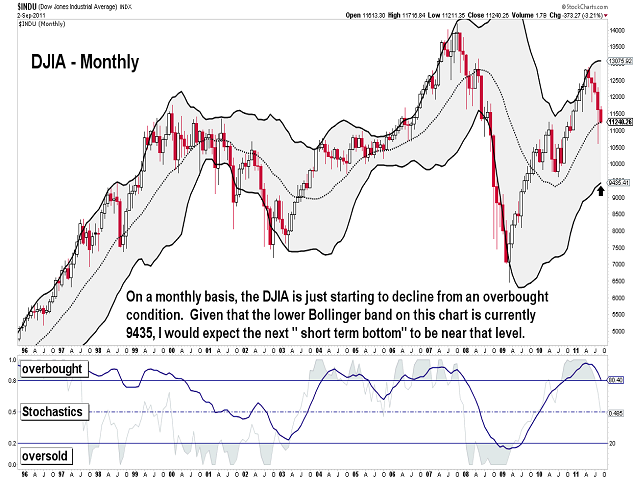
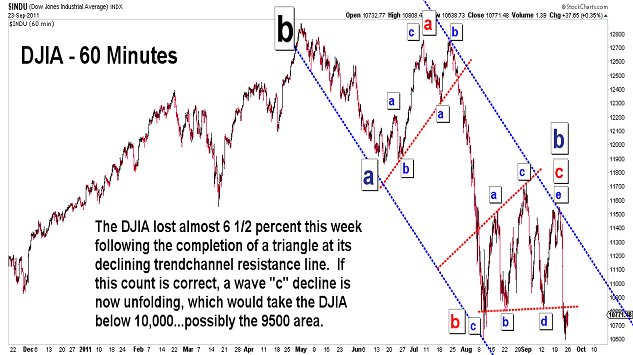
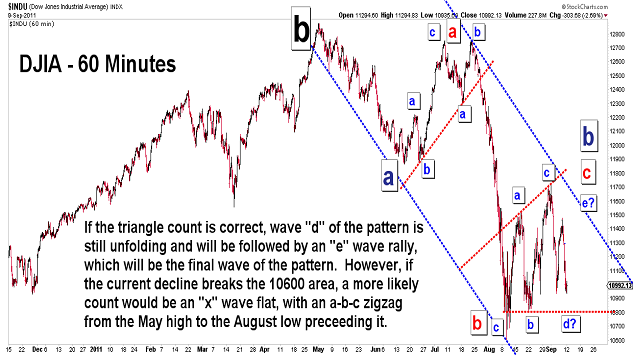
| September 2, 2011 update...Historically, the month of September is the worst month of the year for the market...and, if the first two days are any indication, this year may be one of the all time worst. The DJIA closed the week near the bottom of its 500 point range...forming a weekly key reversal pattern. I have suggested in recent updates that the DJIA may be forming a horizontal triangle pattern...and, if so, wave "d" is now in progress. This count, of course, requires a wave "e" rally to follow to complete the pattern...with a major decline to follow it. However, should the market decline accelerate next week and take out the August low, the triangle pattern will be negated...and the next phase of the decline from the May high toward the 9500-10,000 area will already be underway. Bottom line...a substantial decline is coming...now or after one more rally. |
Important: Information and chart access provided herein is limited to current subscribers only and shall not be forwarded or retransmitted without written authorization. It is educational in nature and shall not, directly or indirectly, be construed as investment advice. No guarantees are made with respect to the accuracy of the information, opinions, predictions,etc. offered here in. The username/password provided to a subscriber is unique and it is the sole responsibility of the subscriber to protect the confidentiality of said username/password and to further protect it from any unauthorized use.
Copyright © 1997 - 2013. The Elliott Wave Chart Blog. All rights reserved. Email
|