|
Charts
IMPORTANT: Chart buy/sell signals are helpful in determining market support and resistance levels...and probable turning points. However, they are only useful if the analyst has a handle on the larger trend. Experience and judgment play a vital role in that determination ...as does Elliott wave analysis.
If a chart does not not appear when you click on the link, you may need to (1) enable javascript, and/or (2) disable pop up blocking for this site, or (3) right click on your mouse and open the link in a new tab or window. Charts will generally appear when you use Internet Exploer or Firefox. Do not use Google Chrome to view charts.
Contact us at info@wavechart.com if you have a question or comment. |
|

Elliott Wave Chart Blog October 2010 Archive
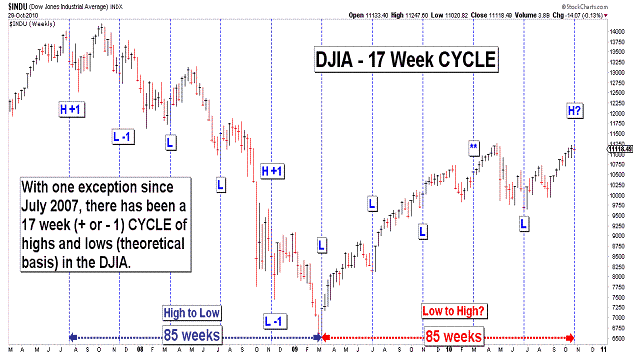
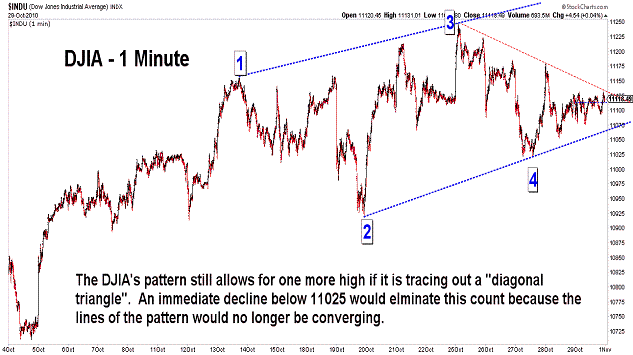
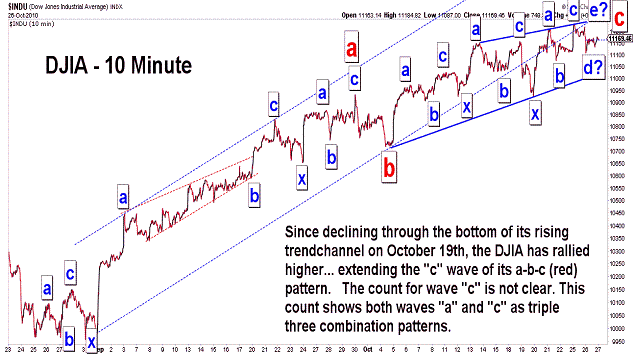
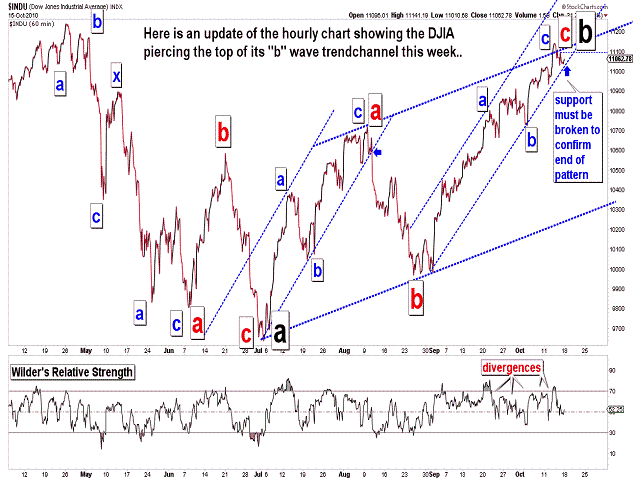
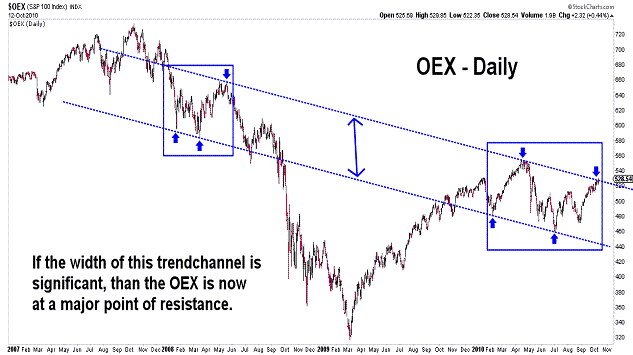
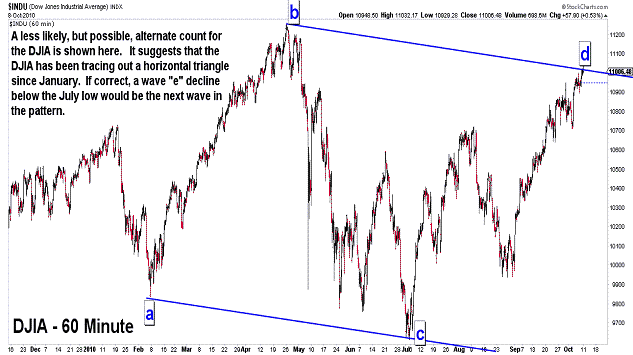
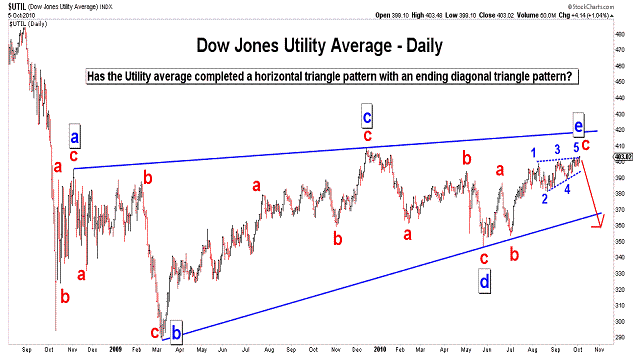
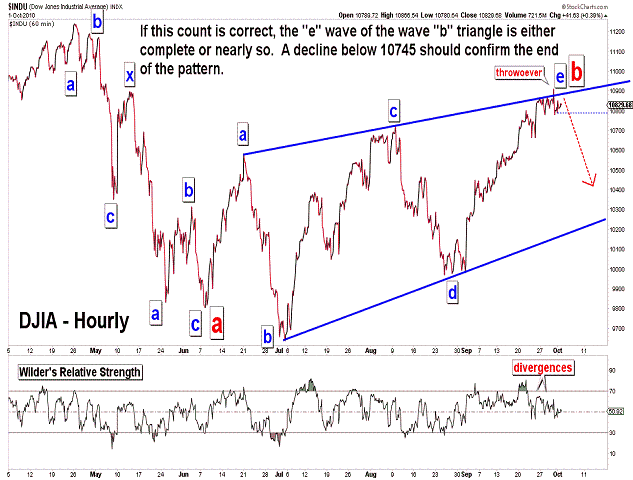
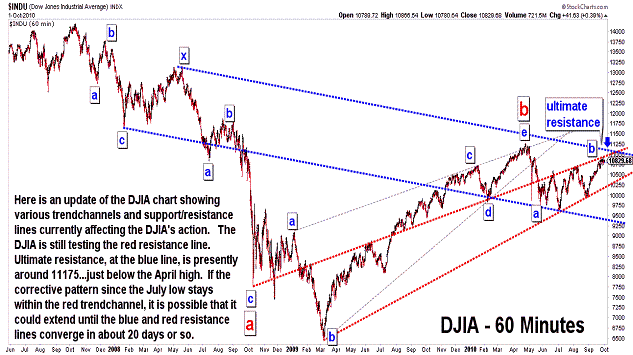
| October 29, 2010 update...On Tuesday I said that "this week is...the 17th week since the early July low...(and it) suggests a turning point this week, especially if the DJIA closes down for the week." (See first chart above.) Well, the DJIA did close down for the week...only the second time since the late August low. Thus, in terms of time, the market should now turn down. Patternwise, however, the DJIA could still rally higher to complete a diagonal triangle pattern. (See second chart above.) The 11025 area is the first key level for this count. It is the point where the lines of the diagonal triangle would start to expand, rather than converge (which is typical for this pattern). On a closing basis, the key level is 10978 (the DJIA's close on October 19th). This lower level would be the better confirmation that a top is in place. How low we would go next depends on the proper wave count for the pattern since July 2nd. If it is an a-b-c corrective pattern, it should be completely retraced...and more. If it is not an a-b-c pattern, and some doubt has been created by today's close on the monthly chart, then the decline will be less. The month of October ended slighly more than 100 points higher than the April closing high. Although there are times when all of the various charts don't line up with each other, if the daily and weekly charts follow the monthly chart, then there will be a rally at some point above 11258, either next week or later. We'll see. |
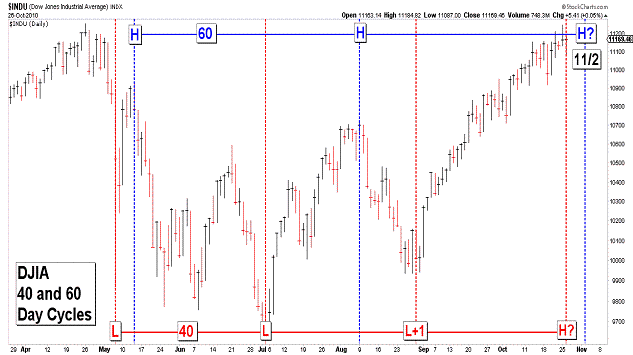
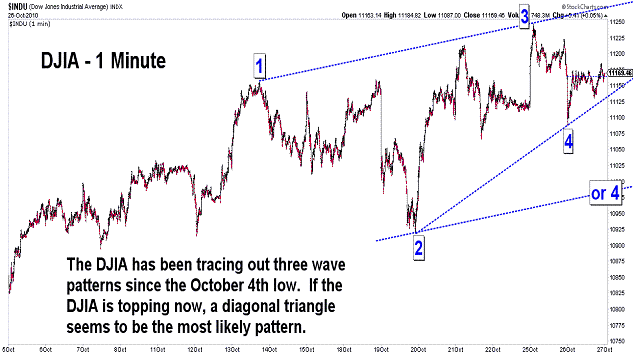
| October 26, 2010 update...It has been fruitless attempting to pick a top for the rally since late August using technical indicators, as well as Elliott wave pattern analysis. It seems when momentum takes hold of the market, you just have to bide your time. And time, in fact, may finally be running out for this rally if recent cycles have anything to do with it. Since the flash crash low on May 6th, there have been two prominent cycles in terms of trading days. Three important lows have occurred at 40 day intervals...and two important highs have occurred at a 60 day inteveral (a Fibonacci 2:3 ratio). We have entered a window beginning today where the two cycles are very close together. Today was the 40th day since the previous low...and next Tuesday will be the 60th day since the previous high. This week is also the 17th week since the early July low. It suggests a turning point this week, especially if the DJIA closes down for the week. I believe I last posted a chart of the 17 week cycle of highs and low in March...I'll post an update of it on Friday. |
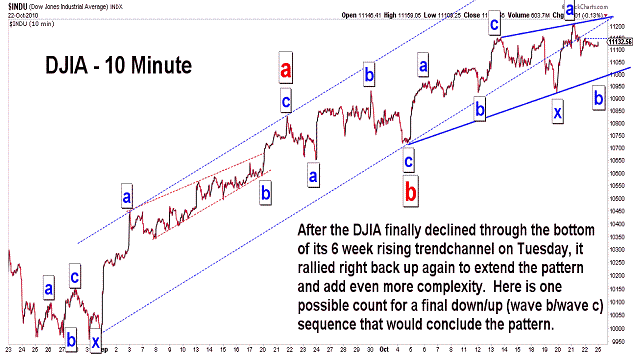
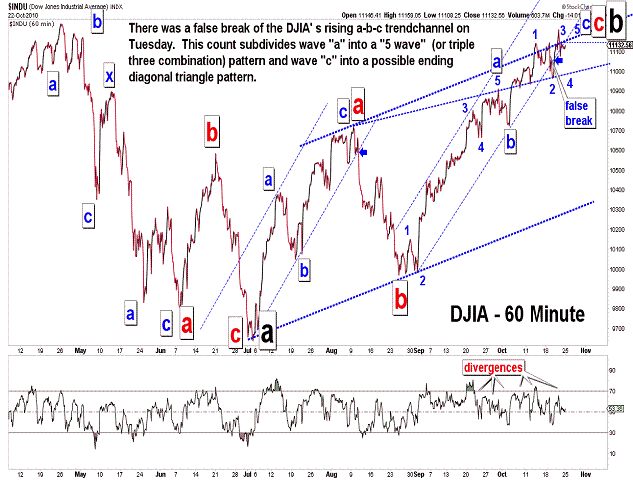
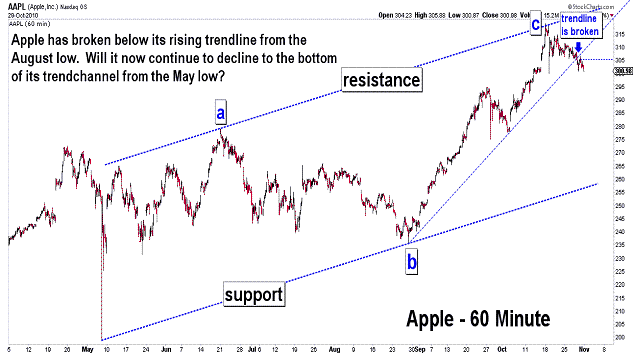
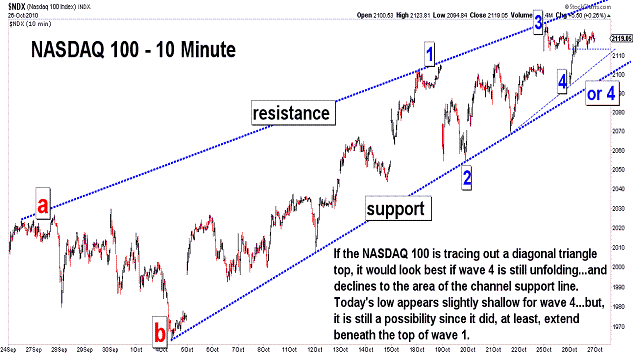
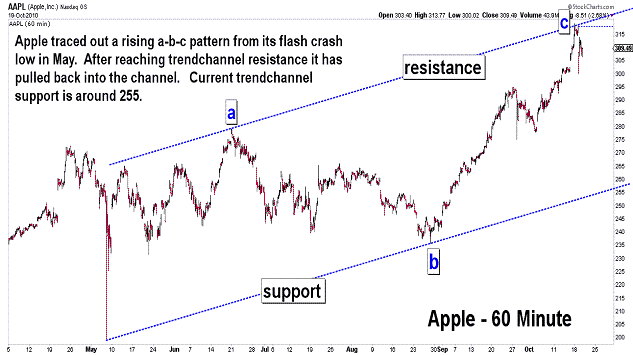
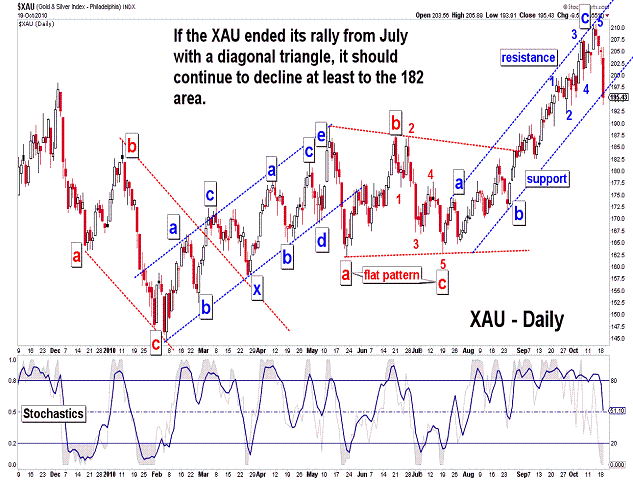
| October 22, 2010 update...Most of the broad market indices were up about 1/2 percent or so for the week. One of the most prominent losers of the week was the precious metals...the XAU lost more than 4 percent. Could this be an early indication of what is about to come for the rest of the market? We'll see. Thursday's high was 77 days from the July 2nd low. The April 26th high was 48 days before that low. So, that leaves a nice 1: 1.618 Fibonacci ratio in place between the two a-b-c corrective patterns...assuming, of course, the market does not move higher next week. The only problem I see with it is that the current wave pattern allows for an additional high...if, as the second chart above suggests as one possibility, a diagonal triangle top is unfolding. There is no question that this market has been stronger than its technical underpinnings for weeks. The market has frustrated everyone (including me) that has called for an imminent top in the pattern since August 27th. Unlike the trendchannel break that produced the 3-week decline after the August 9th high, this week's trendchannel break (an initial "false" confirmation of a top) was followed immediately by a rally to a new high. I guess we just have to be patient waiting for a final top here. What I don't want to see is all of the market indices together exceeding their April 2010 highs. |
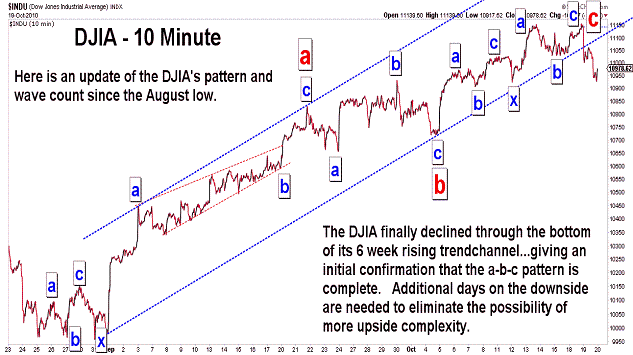
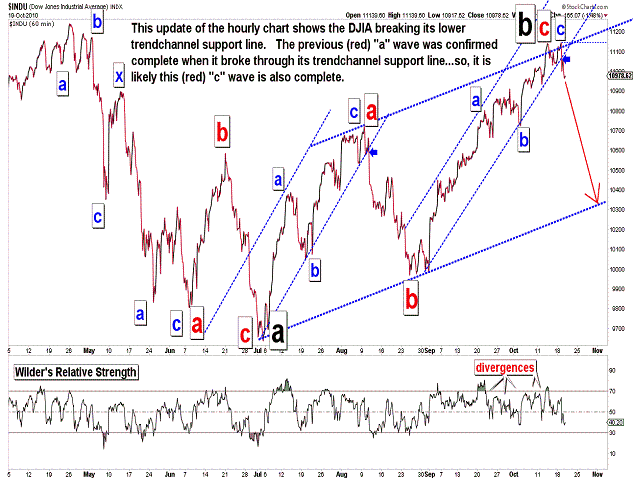
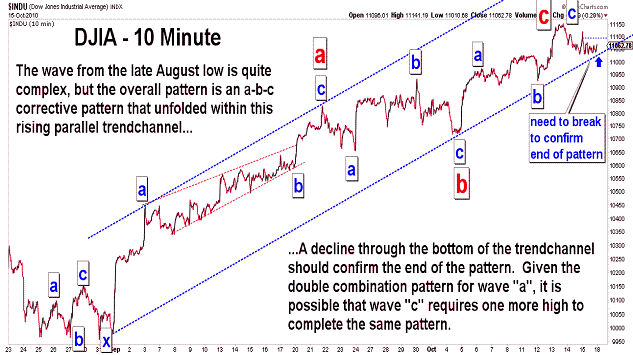
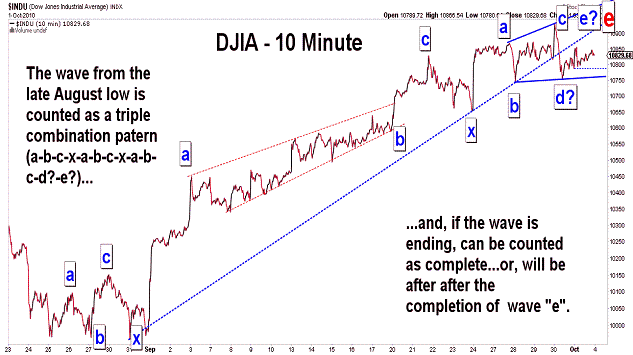
| October 19, 2010 update...Yesterday's new high allowed the DJIA to complete a double combination pattern (a-b-c-x-a-b-c) from the October 4th low. As I said on the DJIA's 10 minute chart last Friday, one more high would allow this "c" wave pattern (as I labeled it) to match up with the double combination pattern for wave "a" (8/25 to 9/21). The entire a-b-c pattern from the August low...as well as the larger a-b-c pattern from the July low can now be counted as complete. Assuming it is complete, a wave "c" (it would be a black "c'" on second chart above) decline should now be getting underway. If this count from the April 2010 high is correct, the decline should eventually take the DJIA well below the July low of 9614. |
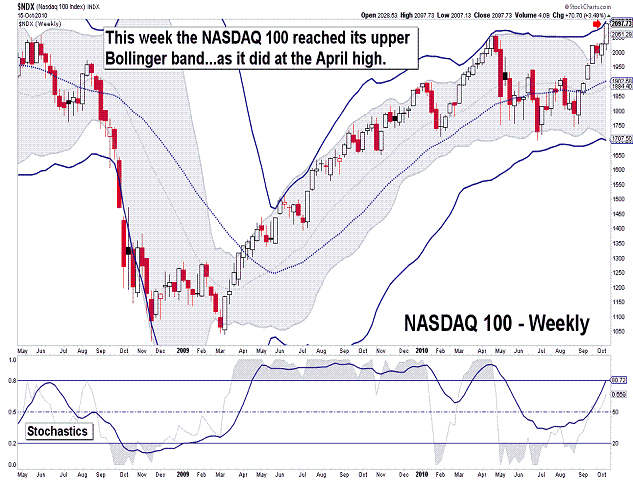
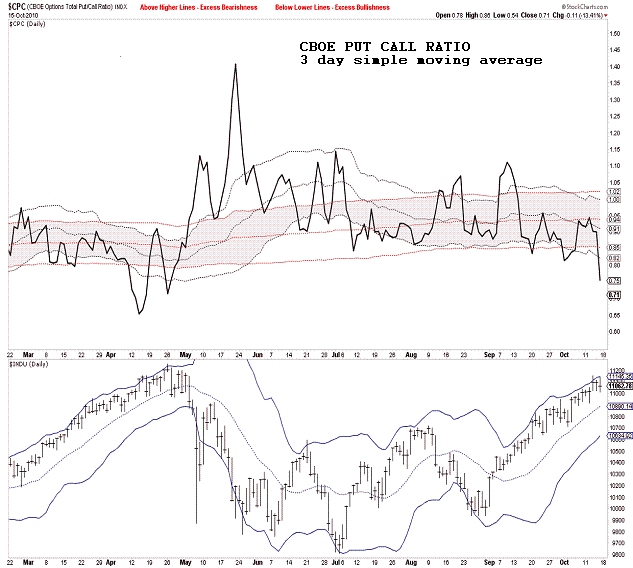
| October 15, 2010 update...On a day when the NASDAQ Composite was up 33 points and the NASDAQ 100 was up even more...43 points, there were almost 100 more declining NASDAQ stocks than advancing stocks. Are the troops finally abandoning the generals? It's no wonder the indices were higher...with GOOG up 11 percent and AAPL up 4 percent. These two stocks alone account for about a quarter of the NDX. I don't know about you, but these 2 stocks don't affect 25 percent of my life. I do use Google's search engine daily, but I have never bought a single Apple product. Obviously, the market doesn't care. So, where are we? As you can see from the charts, the market is at a top using all kinds of traditional technical tools. Market sentiment is finally reaching a point where market tops have occurred in the past. Ten days ago I said in connection with a top that "...I would still like to see at least one day where the put/call ratio falls to .71 or lower (the level on August 23rd)..." because it would give me "...more confidence about the extent of the next decline." Well, today that finally happend (the CBOE put call ratio was excactly .71). Finally, with respect to Fibonacci time cycles, we are entering a period from here to next Friday (it depends on which time interval chart you use) where the length of time from the July low until the current high is 1.618x the length of time from the April high to the July low. If I am right about the wave count labeling, i.e, a "b" wave up following an "a" wave down...that is a common time relationship. We'll see if it works this time. |
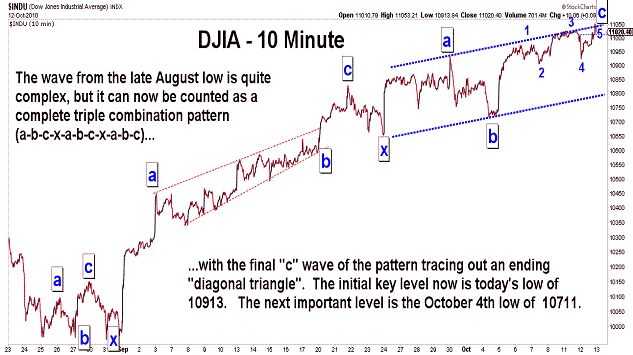
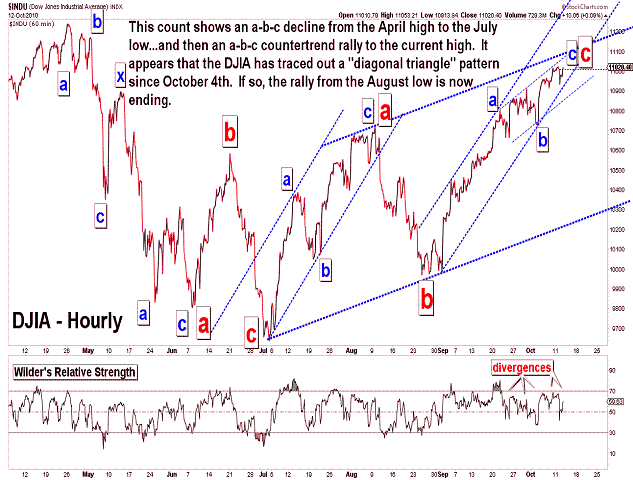
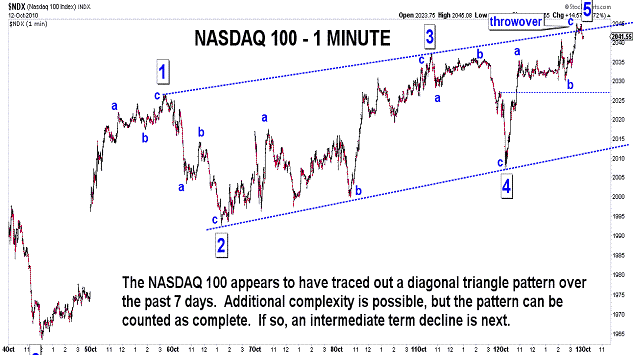
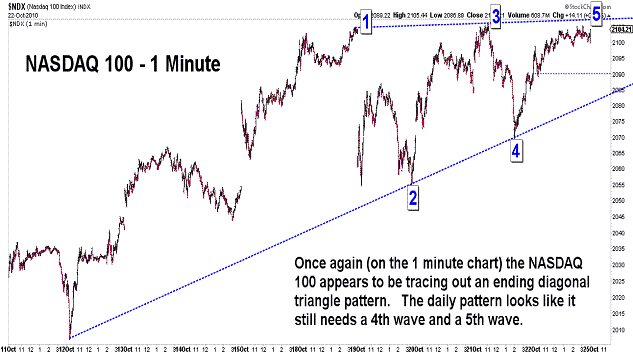
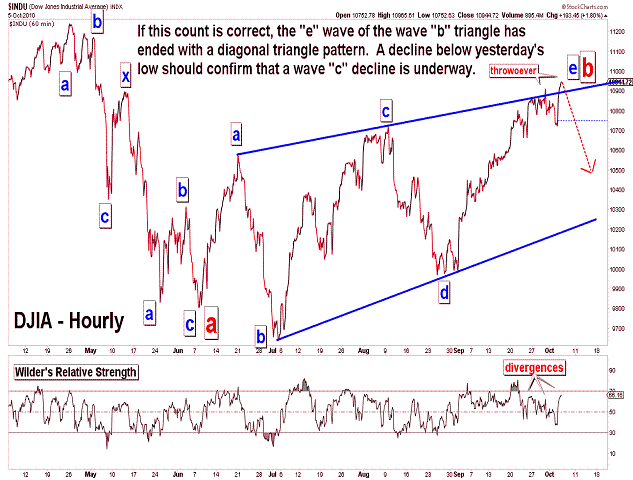
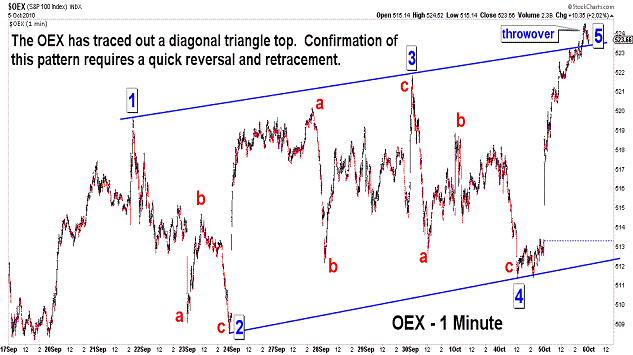
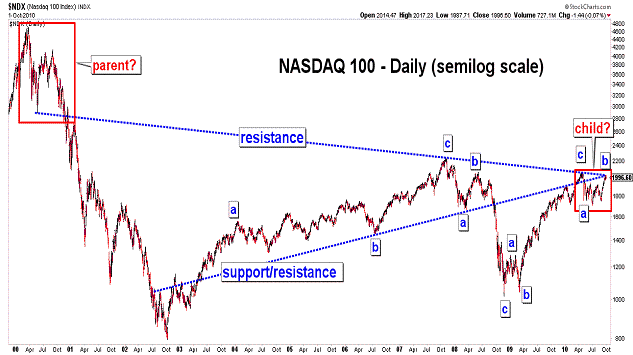
| October 12, 2010 update...The DJIA gained ground the first two days of this week...but, only by a combined total of 13.92 points. For several weeks now, I have discussed the market's weakening technical condition...and that has continued this week. The market's pattern, on the other hand, has unfortunately developed in a way that has left room for various options, extensions and complexities. To date, the market has yet to confirm a top by breaking below the critical levels that I have noted as the rally from the August low has unfolded. But maybe, with this week's action, the market is finally providing a clue that the rally is ending. As you can see in the NDX and DJIA charts above, a clear diagonal triangle topping pattern has formed. Today's low is now the key to this pattern. If that low is quickly broken, then the diagonal triangle pattern is left in place as a top...and an intermediate term decline should be underway. Of course, if the market continues to meander higher, something else is going on...and the pattern will be nullified. Anyway, we should know the outcome of this wave pattern very quickly. |
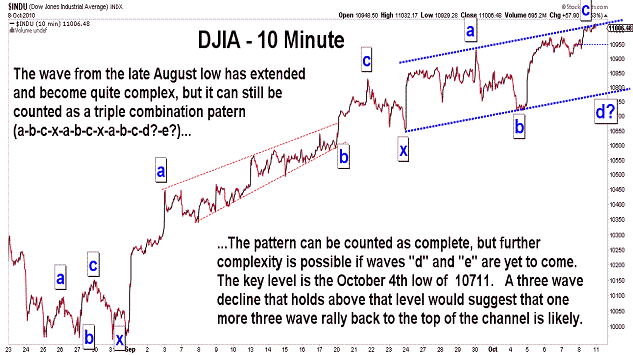
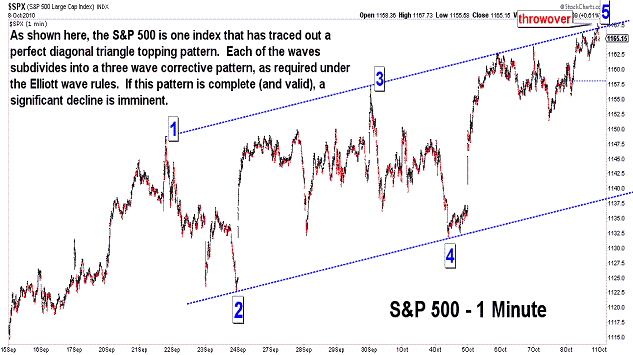
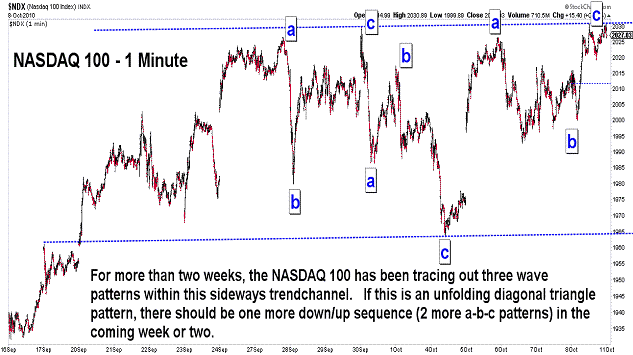
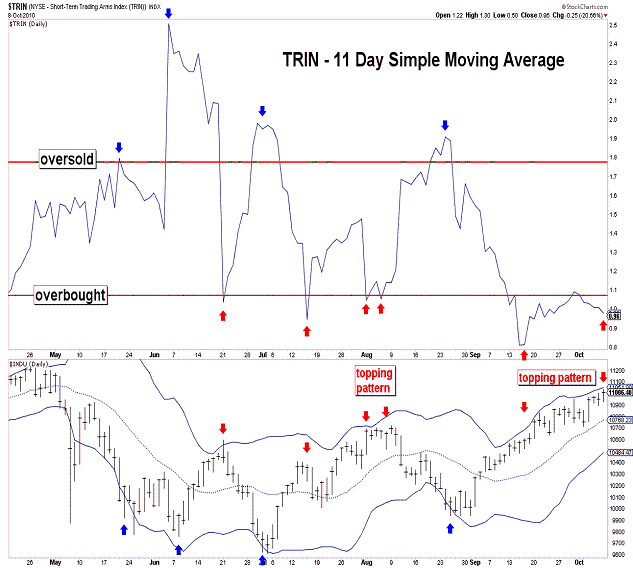
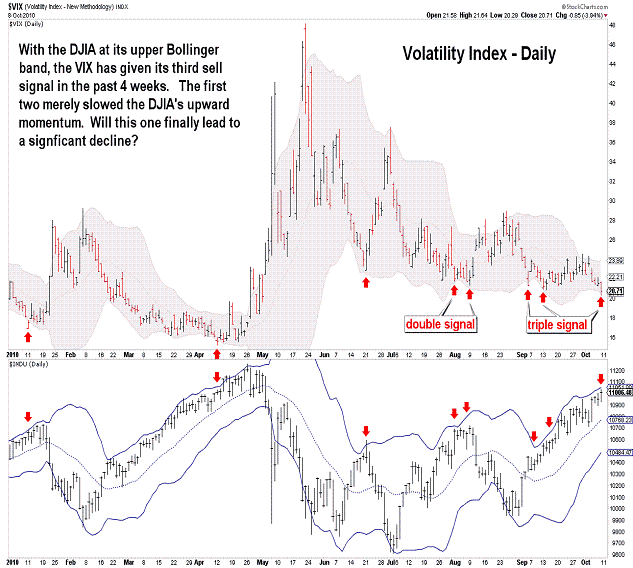
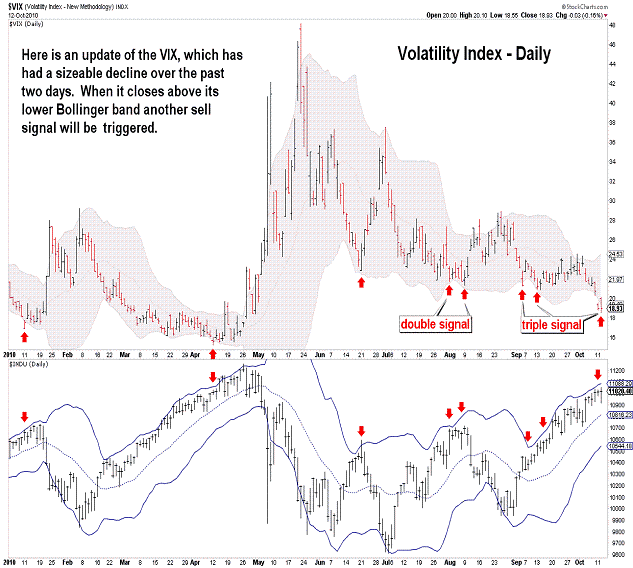
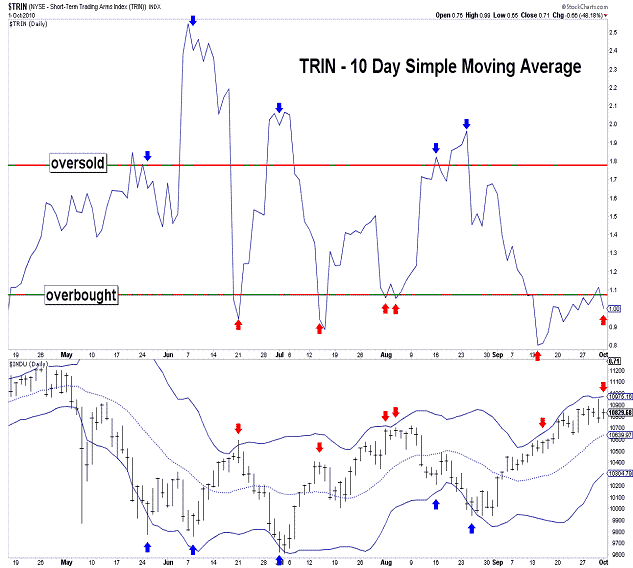
| October 8, 2010 update...After reporting poor employment news, the market did the opposite of what everyone expected...it rallied. It has indeed been frustrating waiting for the market to complete the pattern from the August low...but, the pattern, as I have counted it (a triple combination pattern), has options in terms of extensions and complexity. Comparing the short term patterns of the DJIA, SPX and NDX, a case can be made either: (1) that a top is virutally in place (SPX and DJIA), or (2) that the topping pattern has another week or so to go before completion (NDX and DJIA). The vast majority of technical indicators are in place for a top and various sell signals have previously been triggered (see TRIN and VIX). Market sentiment indicators, however, are a mixed bag and have only given a weak confirmation of the sell signals in effect. So, all we can really do now is wait for the market to tip its hand (the October 4th low is the key). |
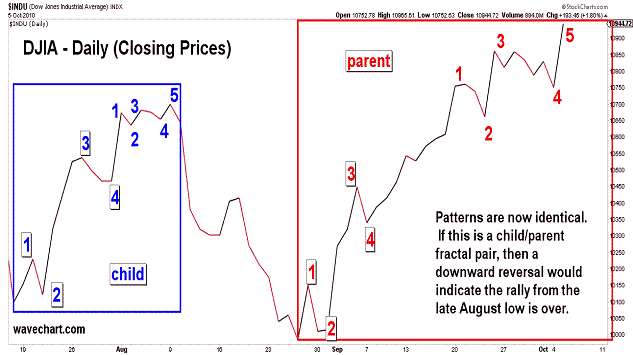
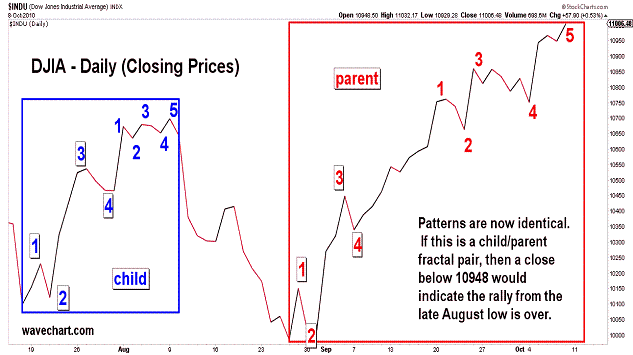
| October 5, 2010 update...Last Friday, I posted the first chart above...showing the unfolding of child/parent fractal pattern since the July low. I said that if "the pattern continues to follow suit, there will be one more closing high above 10860.26 next week". Well, the DJIA fulfilled that requirement today...closing at 10944.72. So, the next step...if the pattern and my wave count are valid...should be a reversal and the start of a wave "c" decline below 10900. The market's technical condition certainly suggests a likely top is in place...but, it is not completely one sided. I would still like to see at least one day where the put/call ratio falls to .71 or lower (the level on August 23rd). It would give me more confidence about the extent of the next decline...but, it is not a requirement. |
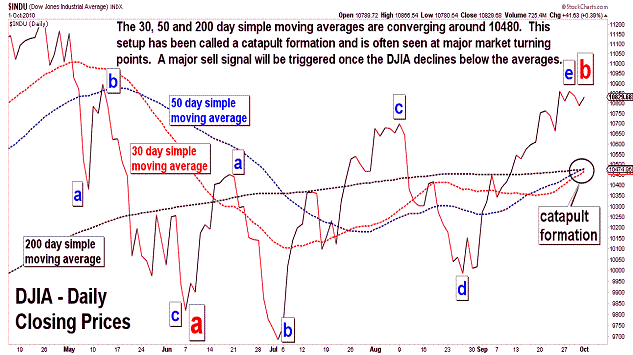
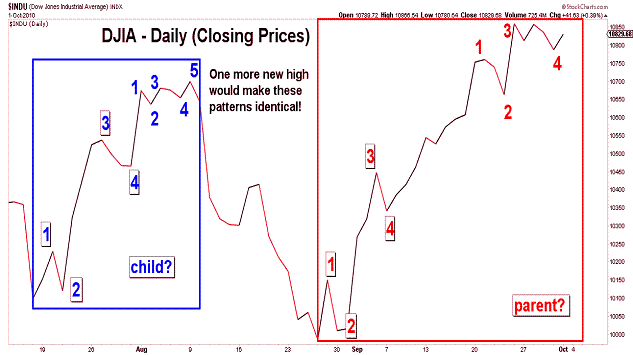
| October 1, 2010 update...Most of the broad indices ended the week modestly lower. The Midcaps and Smallcaps were the notable exceptions. The NASDAQ 100, the strongest indice since the late August lows, was the weakest this week. As you can see in the fourth chart above, the DJIA's pattern (closing basis) since the late August lows is very similar to the DJIA's pattern (closing basis) from July 16th to August 9th. If the pattern continues to follow suit, there will be one more closing high above 10860.26 next week. The July pattern was quickly retraced...with some additional loss beyond that. A similar decline in the DJIA would take it below 9968...and because it would complete the "b" wave triangle pattern since June 8th...it would eventually lead to much lower prices over the weeks/months that follow. One thing that I would like to see in conjuction with a new closing high next week is a very low CBOE put/call ratio...it isn't necessary to confirm a top, but it would be a significant piece "sentimentwise" to add to the other technical indicators suggesting a top. |
Important: Information and chart access provided herein is educational in nature and shall not, directly or indirectly, be construed as investment advice. No guarantees are made with respect to the accuracy of the information, opinions, predictions, etc. offered here in.
Copyright © 1997 - 2012. The Elliott Wave Chart Blog. All rights reserved. Email
|