|
Charts
IMPORTANT: Chart buy/sell signals are helpful in determining market support and resistance levels...and probable turning points. However, they are only useful if the analyst has a handle on the larger trend. Experience and judgment play a vital role in that determination ...as does Elliott wave analysis.
If a chart does not not appear when you click on the link, you may need to (1) enable javascript, and/or (2) disable pop up blocking for this site, or (3) right click on your mouse and open the link in a new tab or window. Charts will generally appear when you use Internet Exploer or Firefox. Do not use Google Chrome to view charts.
Contact us at info@wavechart.com if you have a question or comment. |
|

Elliott Wave Chart Blog October 2011 Archive
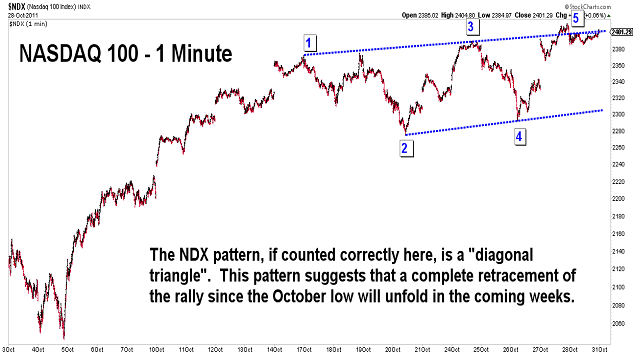
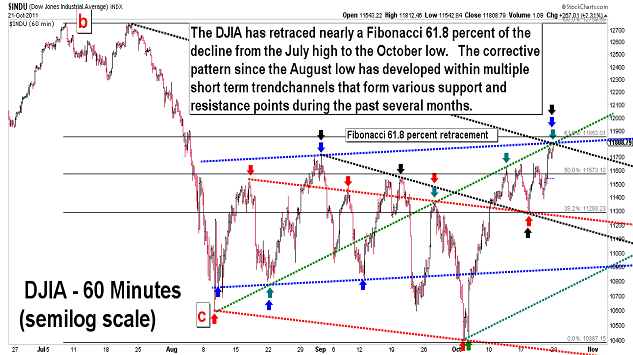
| October 28, 2011 update...On Tuesday I said that "...anything other than a steady accelerating downward pattern (as in a 3rd wave decline) would suggest that something else is going on." Well, Wednesday and Thursday something else did go on (in Europe) and bullishly affected the market. But, if my long term view of the market is correct, this week's rally is likely to be the last part of the entire rally from the October lows. I thought the Fibonacci 61.8 percent retracement point of the May to October slide would be the limit for this month's wave 2 rally, but at the open yesterday we gapped right through it. Still, there are some resistance lines at yesterday's high (which, by the way, was not reached today). There is a lot of momentum behind the current rally, but I do see some identical patterns from the past that suggest a top is in (or nearly so). If we do turn down next week, I'll post one of them. |
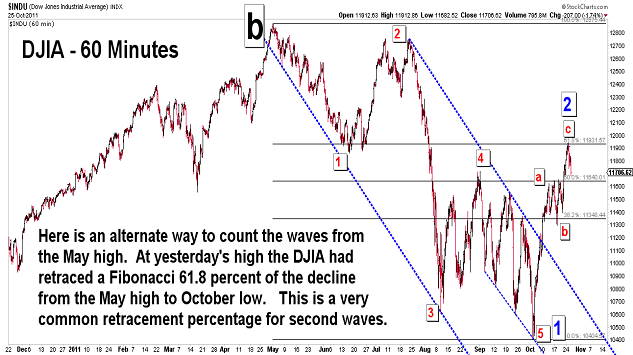
| October 25, 2011 update...Yesterday, the DJIA tested the area near its 200 day simple moving average, as well as the Fibonacci 61.8 percent retracement point of the May high to October low decline. It was an important level for a reversal to occur. The rally from the October low looks like a three wave corrective pattern at this point...and can be counted as a second wave under the wave count shown in the second chart above. If so, a major third wave decline is now getting underway. Anything other than a steady accelerating downward pattern would suggest that something else is going on. We'll see. |
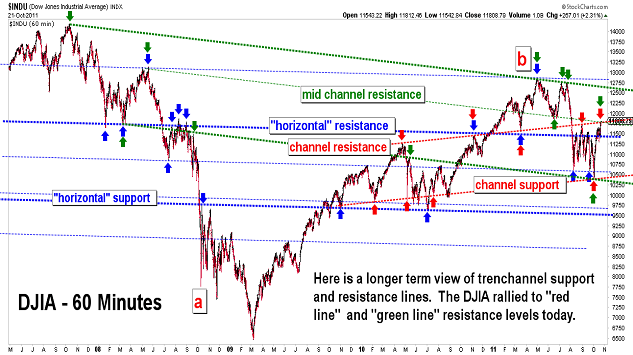
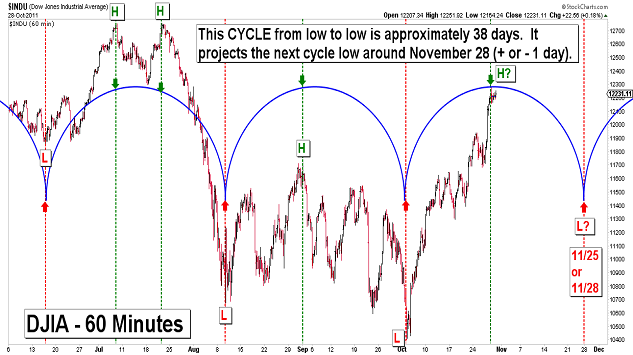
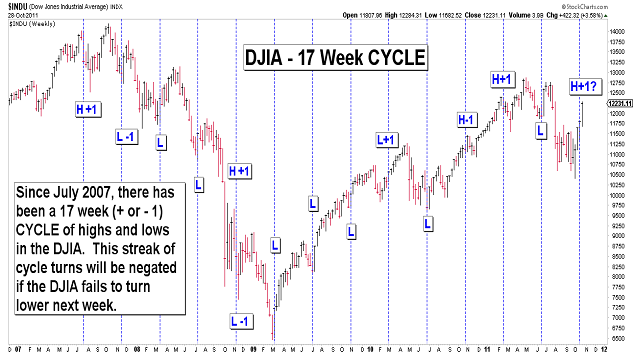
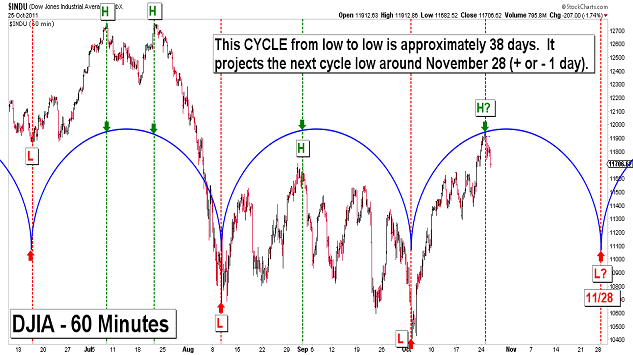
| October 21, 2011 update...It was a strange week to say the least. Divergences are popping up everywhere you look. The DJIA closed up about 1 1/2 percent this week; while the NASDAQ lost a similar amount. The wave count I speculated about on Tuesday was negated. Yet, some type of top may have formed today...with the DJIA touching a number of short and long term resistance lines. The 17/34 week Cycle could also have produced its regular turning point...but, it's possible that it may just be short term. While it appears that the bulk of the current rally is complete, more time (and complexity) may be needed to to put the final touch on the corrective pattern from the August low. We should get some important clues early next week. |
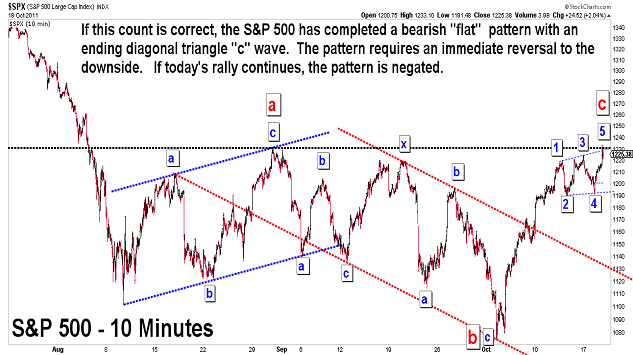
| October 17, 2011 update...Today's rally to an intraday high above last week's high was in line with the 17/34 week Cycle's call for a turn in the market this week. Many of the indices now sport the look of an ending diagonal triangle topping pattern for wave "c" of a bearish "flat" pattern since the August low. If this wave count is correct, the market should now begin a decline that will take it toward the 9500 area...retracing all of the rally from the June 2010 low to May 2011 high. Any thing else will probably negate this wave count. |
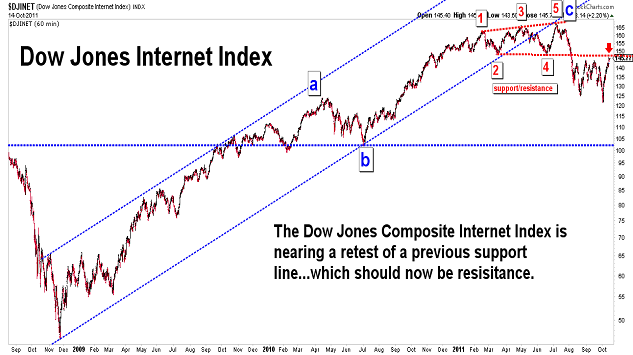
| October 14, 2011 update...As a result of various cycles peaking and turning next week, I think an important top is very likely within the next few days. Various indices are at a Fibonacci 50 percent retracement point since the May high and the waves can now be counted as a (nearly) complete corrective pattern. If I am right, we are on the verge of resuming the long term decline from the May top...and the next stop should be 2000+ points or so lower. |
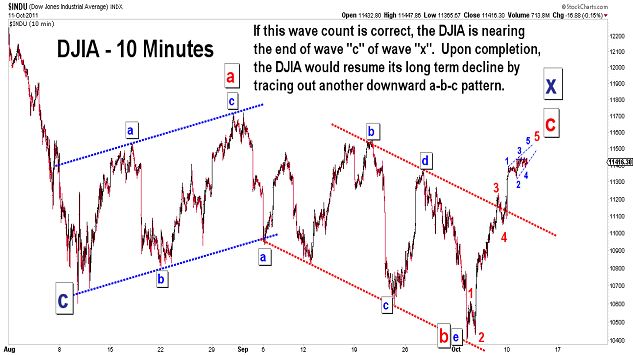
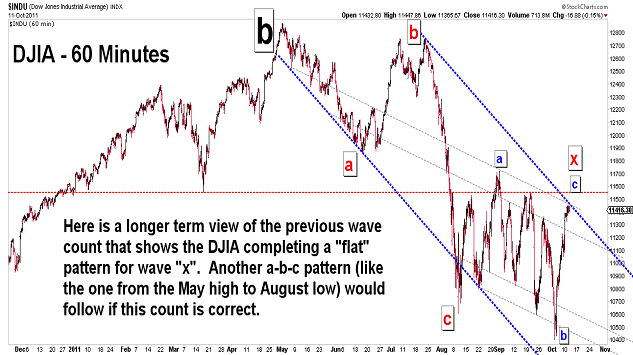
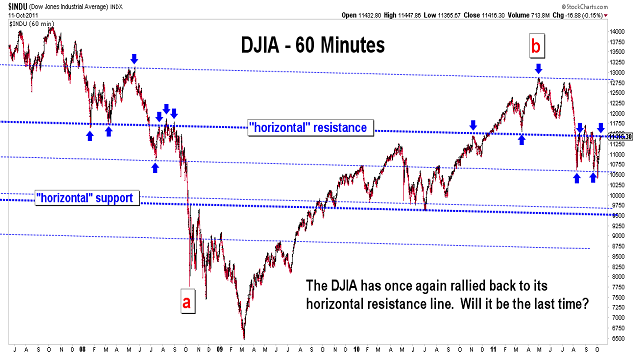
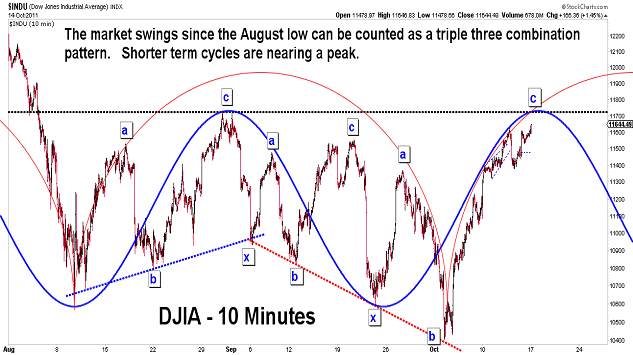
| October 11, 2011 update...Next week is the 17 (or 34) Week Cycle turning point. Reversals have sometimes been a week early or late with this cycle since 2007...but, more often than not, a turn has occurred during that week. If that is to happen now, the market will have to mark time moving sideways in the coming days until a final top is place. The current "c" wave rally already counts well as a "five". So, maybe, this is one of those times when the market reverses a week early. We'll see. |
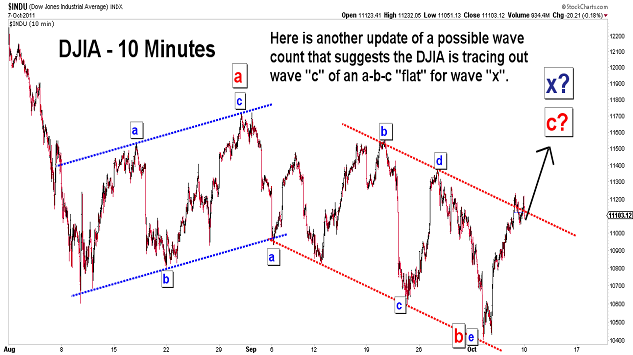
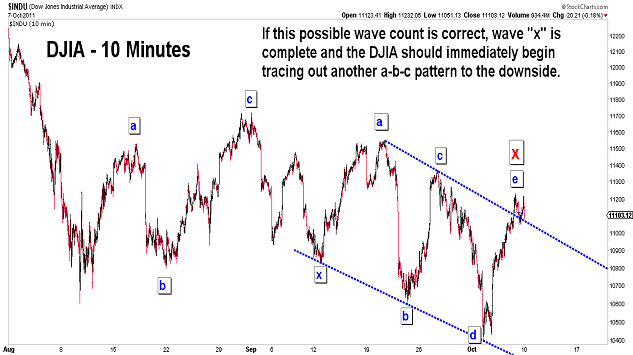
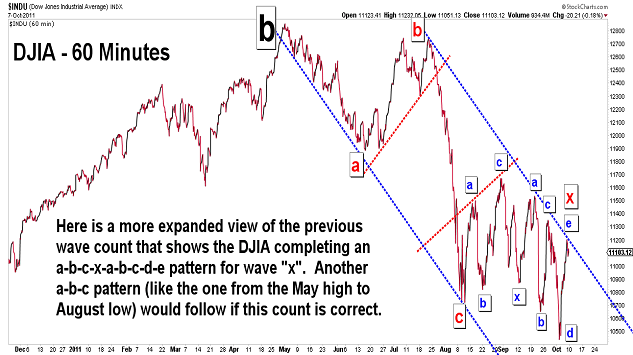
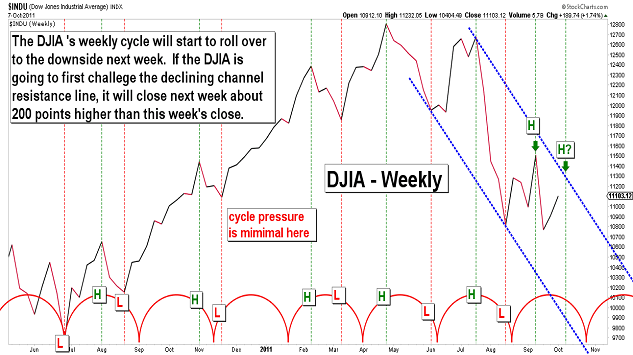
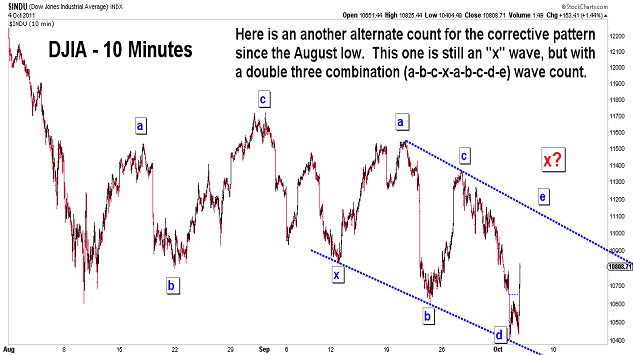
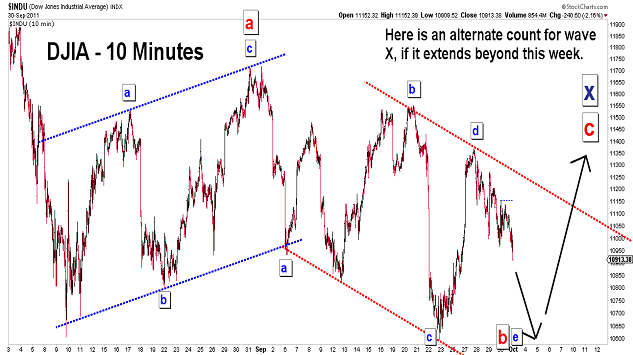
| October 7, 2011 update...One of the possible wave counts that I pointed out in the last update, if correct, suggests that the market is now on the verge of resuming its long term decline. Under this count, wave "x" is complete and the DJIA will now begin another a-b-c decline (similar in form to the decline from the May high to August low). Should the market instead rally, there is room under an alternate count (see first chart and weekly chart) for the DJIA to end next week about 200 points above today's close. In the meantime, go Phillies! |
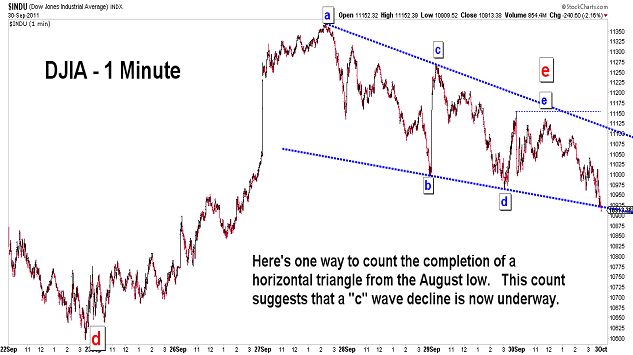
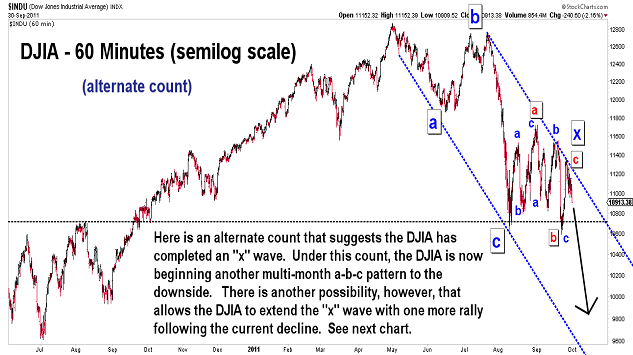
| October 4, 2011 update...The market reversed course and rallied almost 400 points in the last hour. Should it continue through the end of the week, my alternate count(s) comes into play. Two of the counts are shown above, with the former allowing a more significant rally than the latter. One other count (not shown) considers the decline from the May high to be a complete five wave decline...with an a-b-c rally/consolidation about to begin. Of course, the last hour rally could also just have been a brief fake out by the bears vs. the bulls, with a quick resumption of the decline tomorrow. |
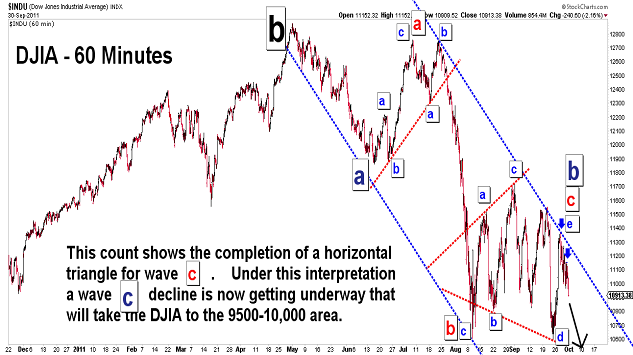
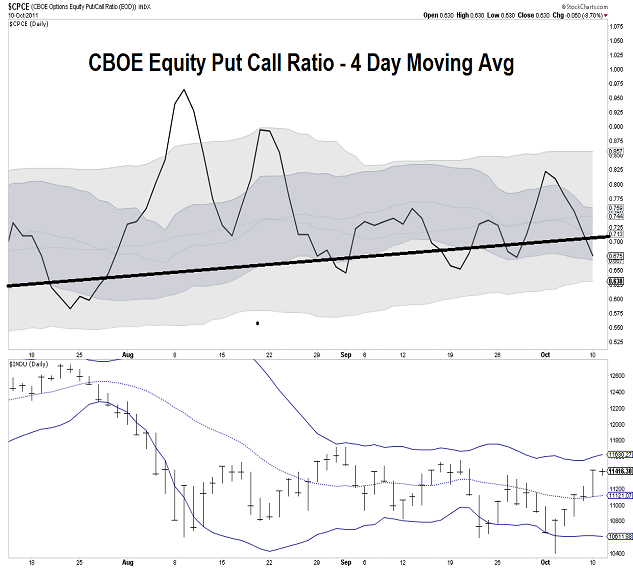
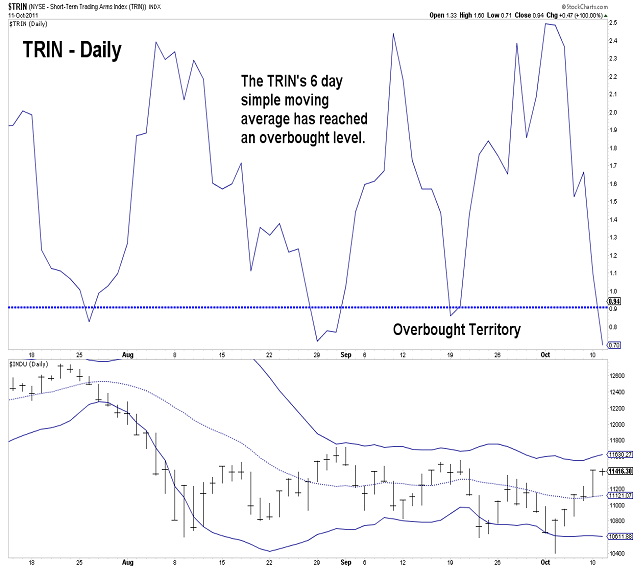
| October 1, 2011 update...It was a mixed week for the market...the NASDAQ lost almost 3 percent...the DJIA gained over 1 percent, but ended weakly. The bearish interpretation of the market's current pattern suggests we have begun the next phase of the decline from the May 2011 top...which means that a decline to the 9500-10,000 area is now underway. A less bearish/more neutral interpretation of the current pattern suggests that the sideways pattern since the August lows is not yet complete. The market's action next week should tell us which interpretation is correct. A large opening gap to the downside on Monday would convince me that DJIA 9000's will quickly be attained. A more orderly decline or rally would suggest otherwise. Market sentiment is moving toward an overly pessimistic level...but, that doesn't mean that "crash" type action won't happen before the next short term bottom. We'll see. |
Important: Information and chart access provided herein is limited to current subscribers only and shall not be forwarded or retransmitted without written authorization. It is educational in nature and shall not, directly or indirectly, be construed as investment advice. No guarantees are made with respect to the accuracy of the information, opinions, predictions,etc. offered here in. The username/password provided to a subscriber is unique and it is the sole responsibility of the subscriber to protect the confidentiality of said username/password and to further protect it from any unauthorized use.
Copyright © 1997 - 2013. The Elliott Wave Chart Blog. All rights reserved. Email
|