|
Charts
IMPORTANT: Chart buy/sell signals are helpful in determining market support and resistance levels...and probable turning points. However, they are only useful if the analyst has a handle on the larger trend. Experience and judgment play a vital role in that determination ...as does Elliott wave analysis.
If a chart does not not appear when you click on the link, you may need to (1) enable javascript, and/or (2) disable pop up blocking for this site, or (3) right click on your mouse and open the link in a new tab or window. Charts will generally appear when you use Internet Exploer or Firefox. Do not use Google Chrome to view charts.
Contact us at info@wavechart.com if you have a question or comment. |
|

Elliott Wave Chart Blog November 2010 Archive
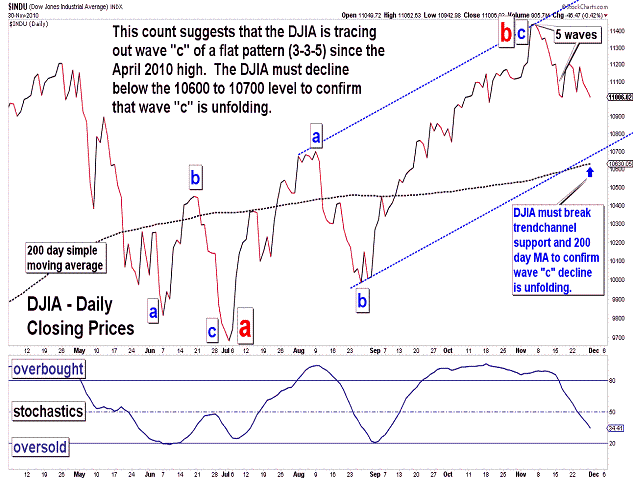
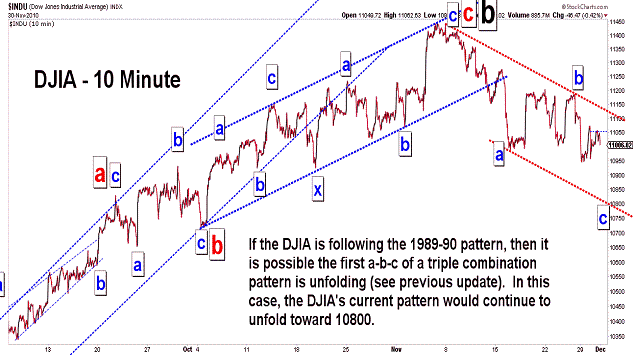
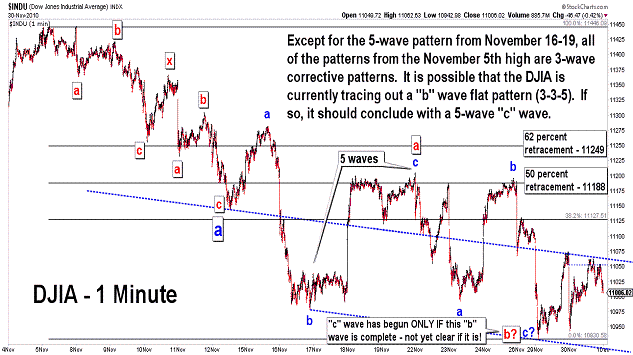
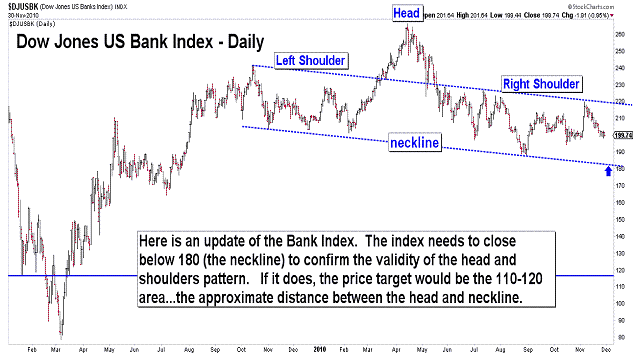
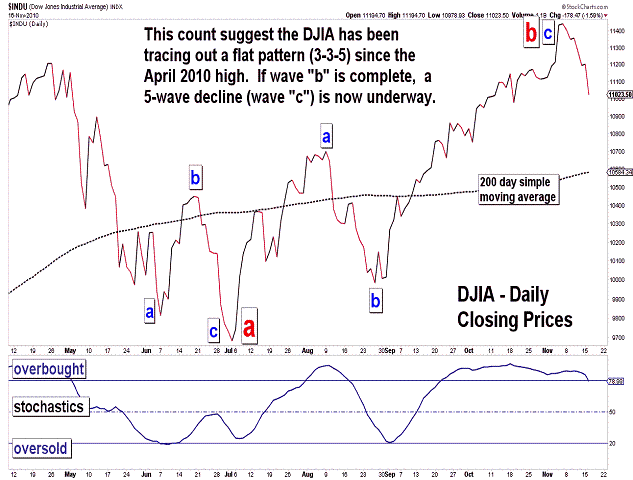
| November 30, 2010 update...The DJIA ended the month of November with a 1 percent loss...leaving the monthly chart (on a closing basis) with a 3 wave pattern in place since the June closing low. The monthly decline lends support to my primary wave count that a "b" wave pattern has unfolded since the July intraday low...and is part of a "flat" (3-3-5) pattern from the April high. Assuming that a "c" wave decline is now unfolding from the November 5th high, it is still early in terms of the pattern's development to determine how long the pattern will last and how low it will eventually go. The second and third charts above show two possibilites for the short term. The next two or three days should reveal which of the two (or possibly more) patterns is correct. Finally, I updated the Bank index chart...which continues to show the validity of the head and shoulders pattern formation. In the coming days, the action of the index at the neckline should reveal the index's intermediate term direction. Volume should expand as the neckline is approached and broken if a downward trend is unfolding. |
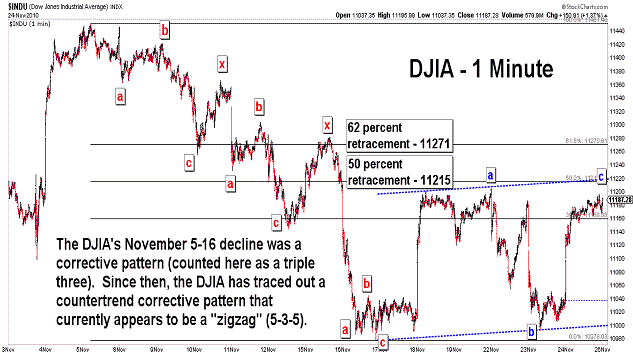
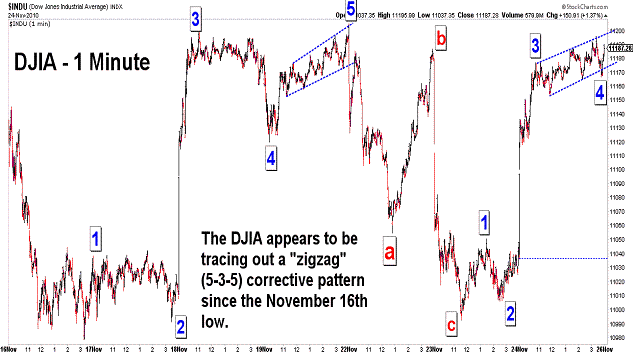
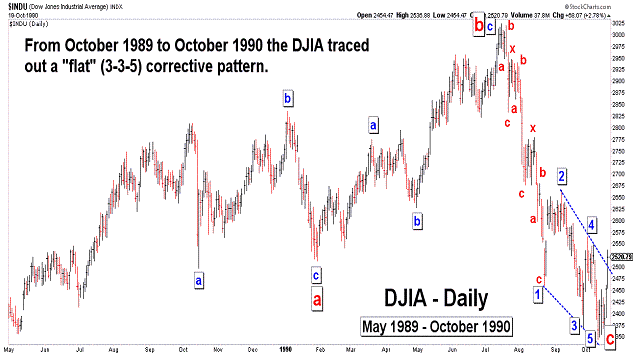
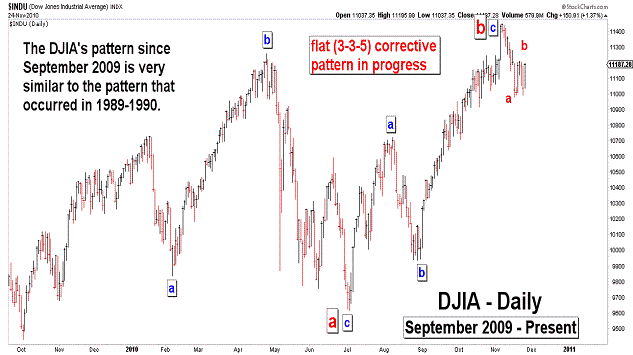
| November 24, 2010 update...The market has been tracing out a countertrend corrective pattern since the November 5th to November 16th decline. As of today, that pattern counts best as a "zigzag" (5-3-5). Possible Fibonacci retracement levels for the current upward correction are shown in the first chart above. The third and fourth charts above illustrate an interesting comparison between the DJIA's 1989-90 pattern and the current pattern since September 2009. The 1989-90 chart shows a completed "flat" pattern...and the current chart shows a (likely) "flat" pattern that is still unfolding. If wave "c" of the pattern is, in fact, underway, the market will stairstep its way lower in the coming months...with an ultimate target below the lows of July. Any rally above the November 5th high (obviously) means that wave "b" is not yet complete. A decline below last week's low should IMO confirm that wave "c" has begun. I don't expect either to occur during the half-day session on Friday. In the meantime, have a happy Thanksgiving holiday! |
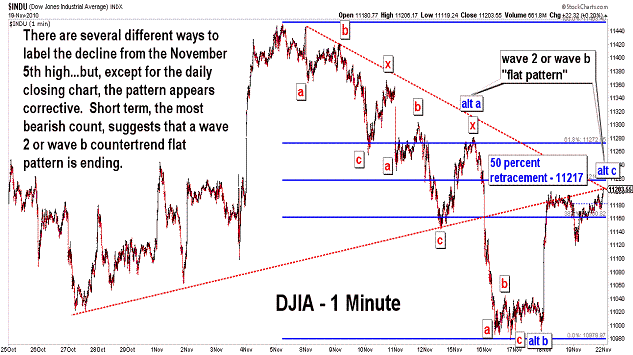
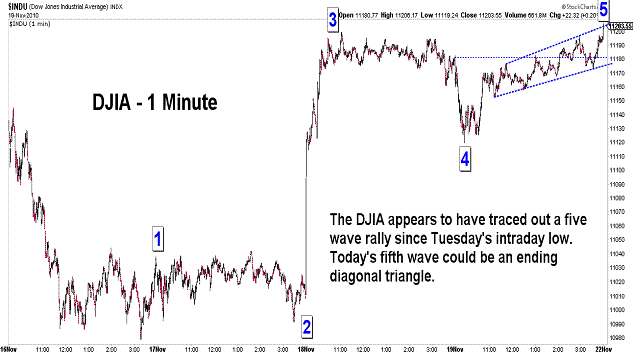
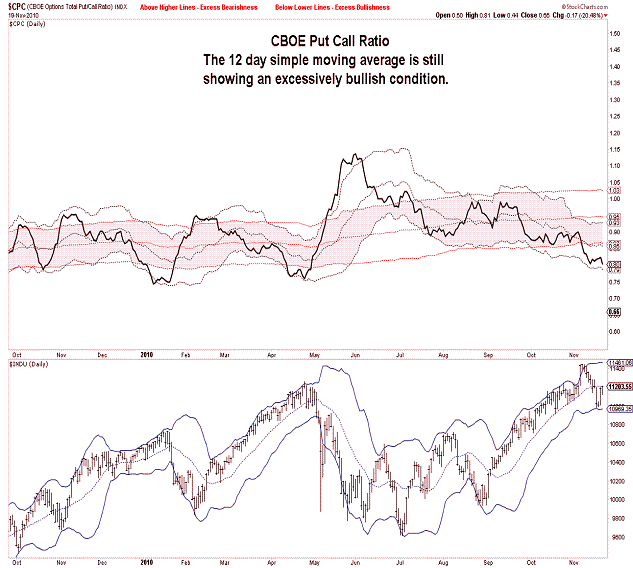
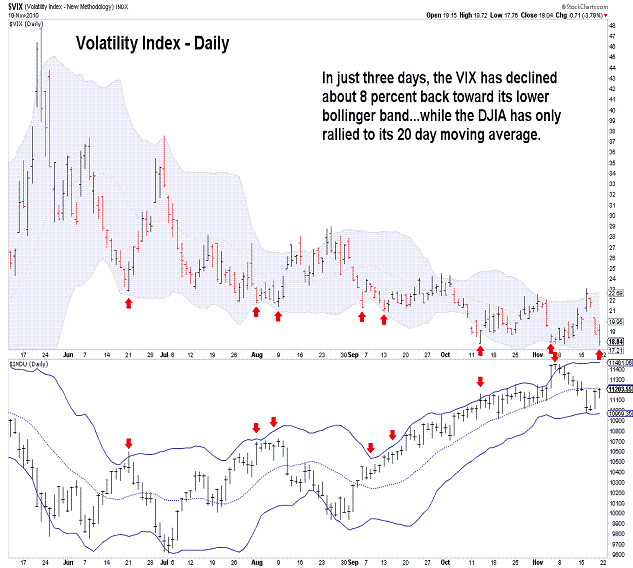
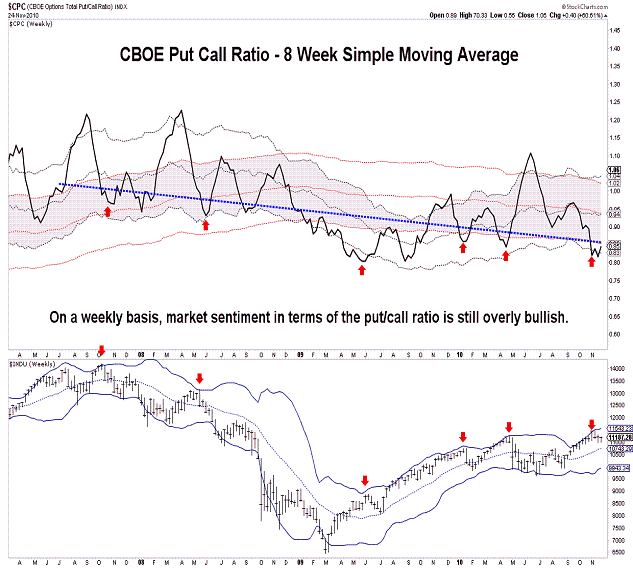
| November 19, 2010 update...On Tuesday I said: "The DJIA has...reached its lower bollinger band...on the daily chart (which) is typically a point where there should be a bounce of one degree or another." Well, the DJIA did bounce...and has, so far, retraced about 50 percent of its decline from the November 5th high. As of today's close, the wave count is open to a number of interpretations...but, it does appear that, except for the chart of daily closing prices (a five-wave pattern), the pattern appears corrective. That does not necessarily imply that the DJIA will continue to rally and surpass the November 5th high...but, that possibility does exist. Some technical factors that millitate against that happening this time are: (1) the put/call ratio is still in excessively bullish territory, and (2) the VIX has quickly declined back toward its lower bollinger band (close to a sell signal). We'll have to wait for more action next week to get confirmation of the market's larger trend. At the very least, the odds have increased that an intermediate term decline has begun. Should a rally to a new high occur, it would be short-lived IMO and an intermediate term reversal would immediately follow. |
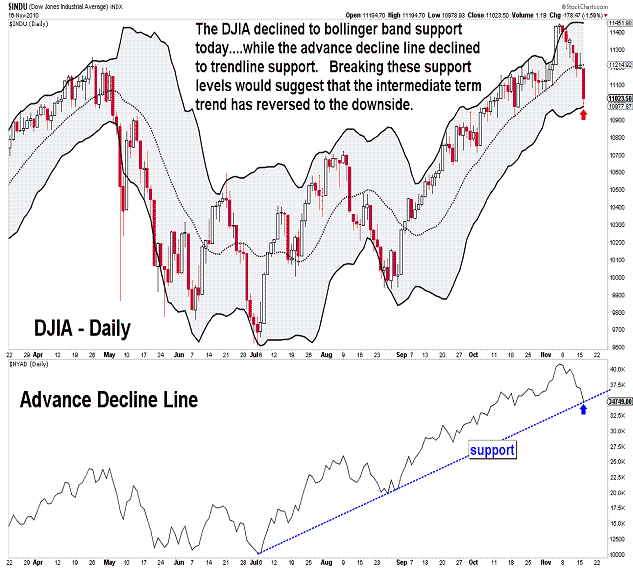
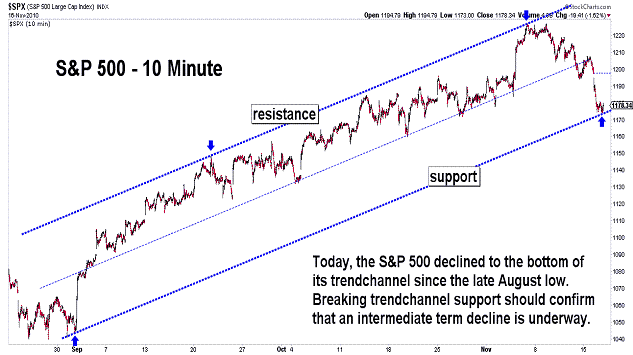
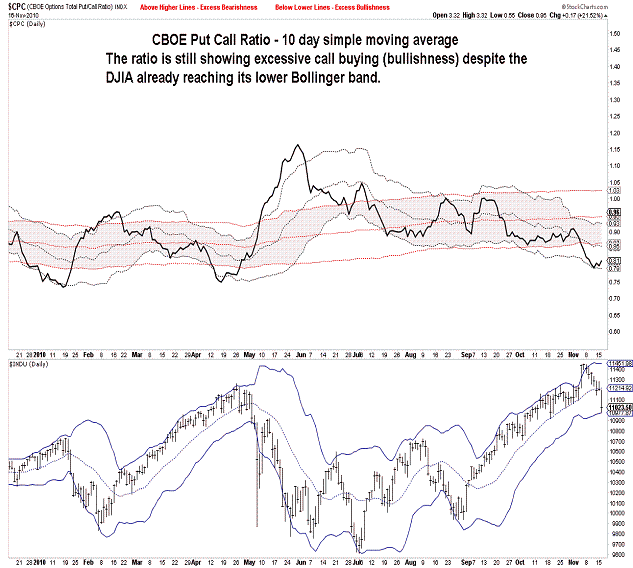
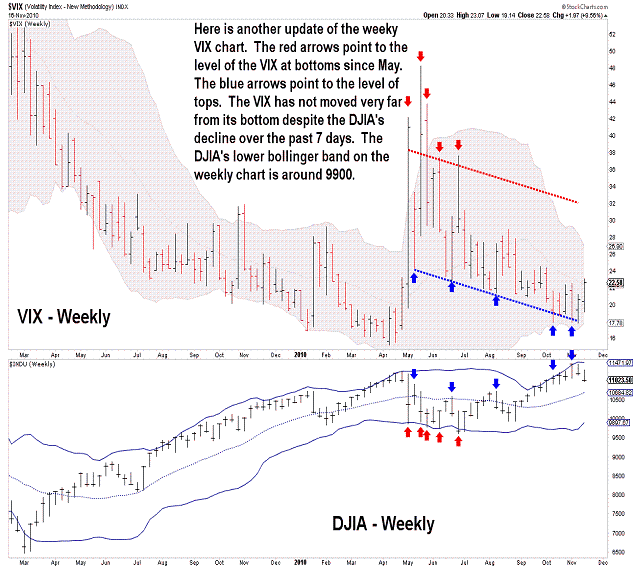
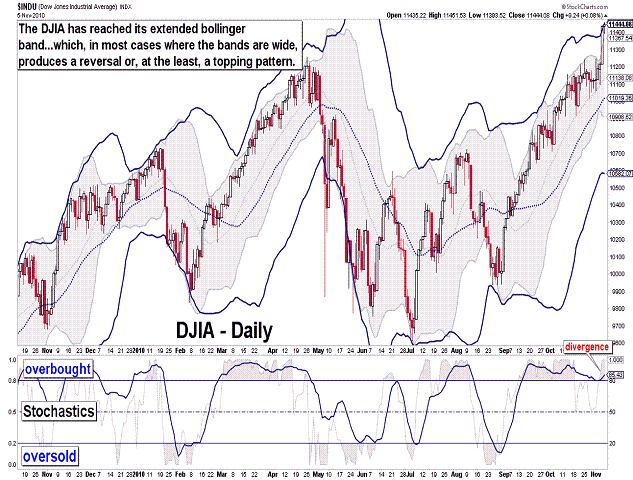
| November 16, 2010 update...The DJIA has declined about 420 points over the past 7 days...and in so doing, has reached its lower bollinger band (computed using a 20 day moving average and 2 standard deviations) on the daily chart. This is typically a point where there should be a bounce of one degree or another. In addition, the S&P 500 has reached the bottom of its rising trendchannel from the August low, and this is a level that would also suggest some type of bounce. So, it will interesting to see if one does, in fact, develop over the next few days...and, if so, how high it goes. Any failure by the market to rally will, in my opinion, be a clear signal that an intermediate term decline (wave "c" under my preferred Elliott wave count) is underway. Technically, the market is still supportive of further declines. Except for the most short term of indicators, the market is just beginning to move out of an overbought condition. Market sentiment, in terms of the CBOE put/call ratio, is still showing excessive bullishness. The VIX (a measure of volatility) is another indicator that is no where near levels that suggest an important bottom is in place. As long as any rally that does develop in the coming days is of a corrective nature, i.e. a three wave pattern, the larger trend will be down toward the July lows. Short term resistance should be around yesterday's high. |
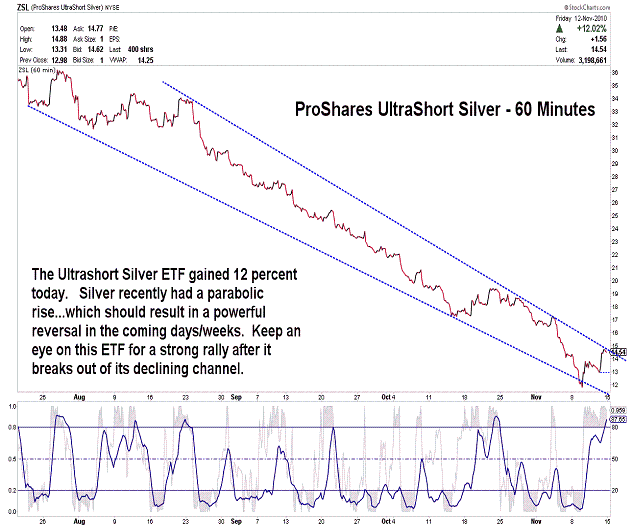
| November 12, 2010 update...There is not much to add to Tuesday's commentary. The market made a top last Friday...and has since declined about 2 percent. Whether or not it's the final top before a wave "c" decline below the July lows is not yet clear. I think a decline below 10900 would suggest that it is...but, until then keep your options open. And, even if a top is in place, there is likely to be one scary contertrend (wave 2) rally at some point in the near term. Lastly, keep you eyes on silver (the chart of ProShare UltraShort Silver ETF is used as a proxy above). It's recent rally was parabolic...and these types of moves are almost always followed by similar action in the opposite direction. |
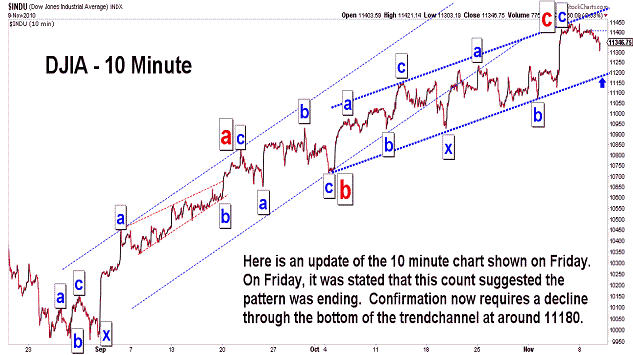
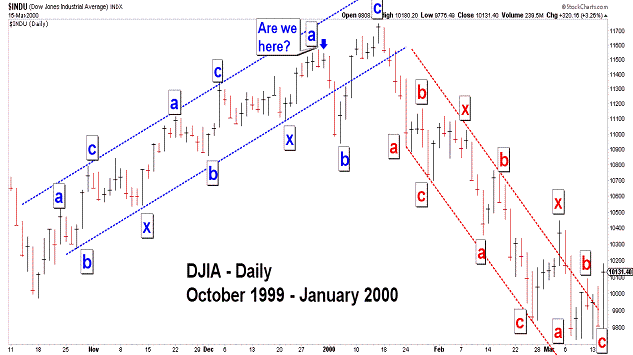
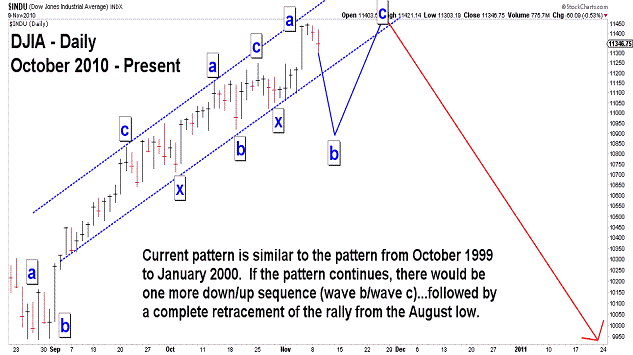
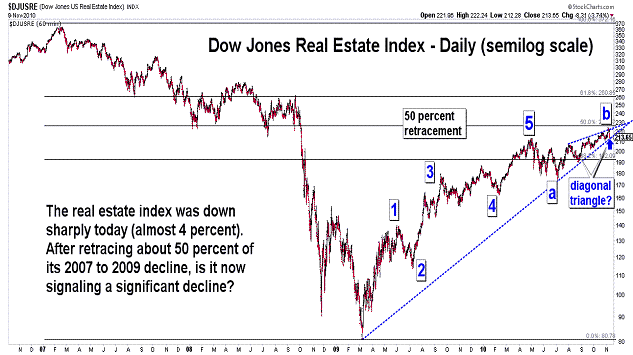
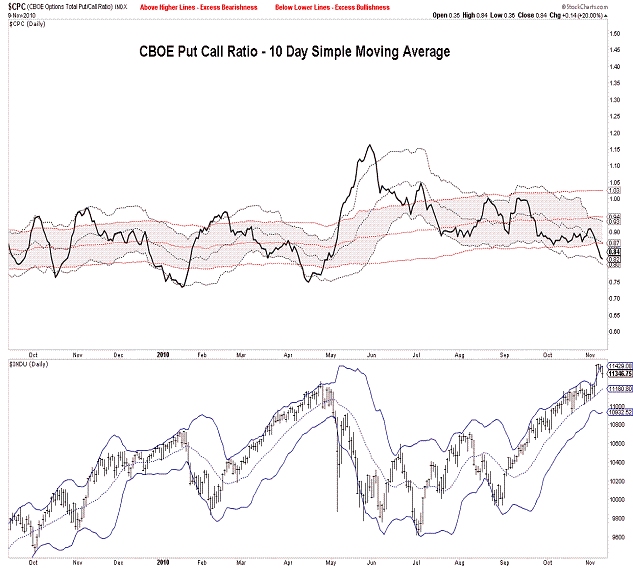
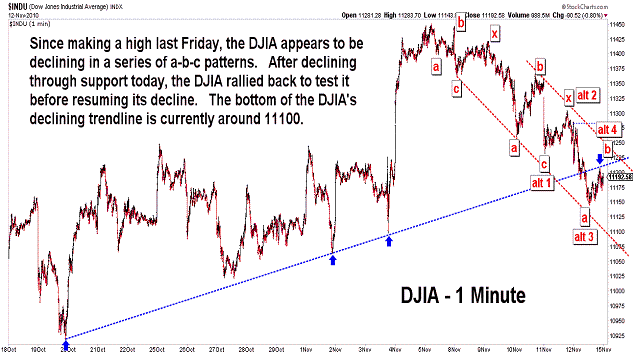
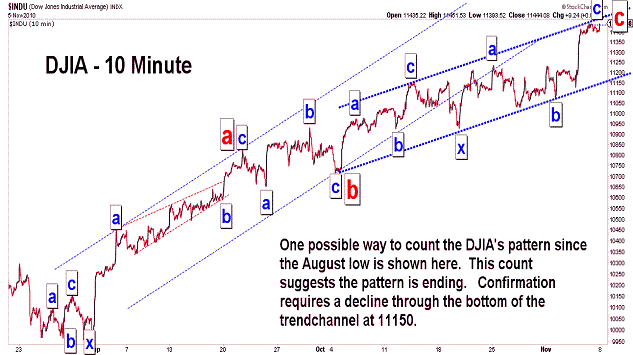
| November 9, 2010 update...The market has started to decline...but, must continue further to confirm that a top is in place. Initial confirmation requires a break of the 11180 level, the bottom of the DJIA's current trendchannel. Even if that level is broken, there is still the possibility of a final surge, as illustrated by the 1999-2000 pattern. The extent of the current decline should provide some clues as to whether or not another rally is likely to occur. One indicator to watch now is the put/call ratio. High put/call ratios in the coming days would suggest another rally. On the other hand, a low ratio would be mean that call buyers are speculating on another rally...reducing the liklihood of that outcome. I noticed today that the real estate index was especially weak...and appears to have completed a pattern that suggests further declines. We'll see. |
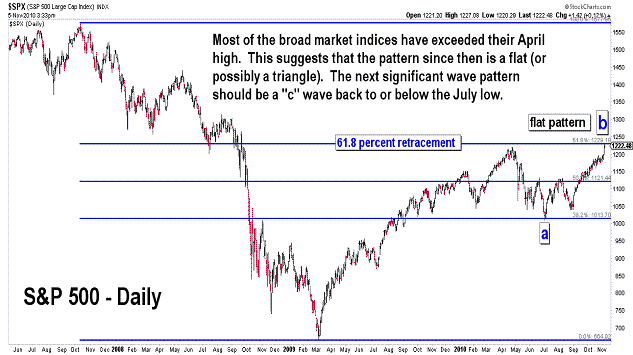
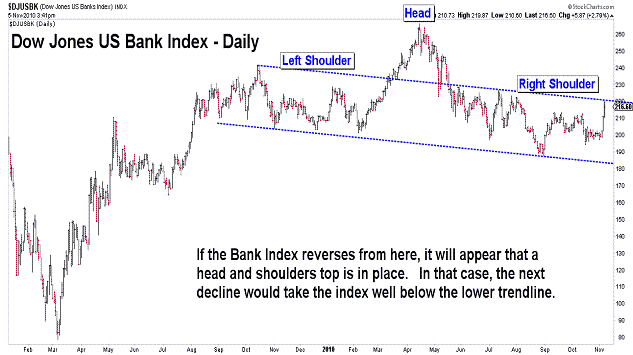
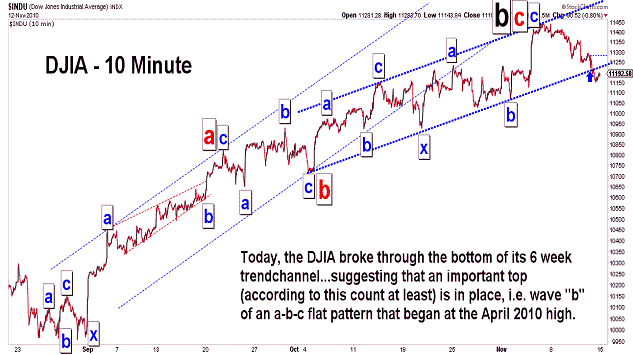
| November 5, 2010 update...Last Friday, when the monthly close for October exceeded the close for April, I said: "...if the daily and weekly charts follow the monthly chart, then there will be a rally at some point above 11258." Well, we didn't have to wait very long. Today's high was almost 200 points above the April high. Most of the other broad indices have joined in and exceeded their April highs as well, with the exception of these three that I follow: OEX, RUT and XII. An interesting divergence would be in place if the market turns down without these indices making new highs. As it is now, the longer term wave count is open to a variety of possibilites. I think I discussed the possibility of a new high previously in terms of an a-b-c flat pattern since April. That suggests a "c" wave decline will follow the completion of the current rally wave...and take the DJIA back to or below the July low. From there (depending on the form of the decline), the corrective pattern could expand into a triangle, or, if the pattern from April is complete, a rally back towards the October 2007 highs could even unfold. There are other possibilities as well (I really hate when there is this much uncertainty - thank you Federal Reserve!). I have heard that some other Elliott wave sites are labeling the current rally as a wave "3" of "5"...and are expecting the next decline to be a "4th" wave. I personally don't like this count given the pattern of the decline from April to July...but, I guess it is a possibility. Finally, note the posting of the charts of the S&P 500 and Bank index, in addition to the DJIA charts. Like the DJIA did in April, the S&P 500 has now rallied to the 61.8 percent Fibonacci retracement level of its 2007 to 2009 decline. The Bank Index, which has been one of the weakest indices since the April high, has traced out an apparent head and shoulders top, IF the index turns down from here. We'll see. |
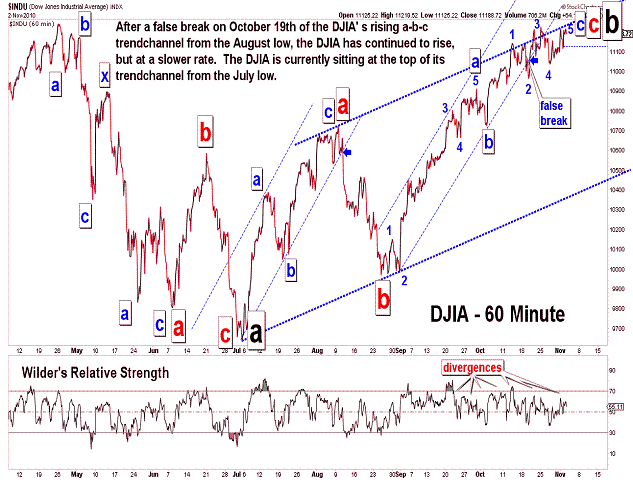
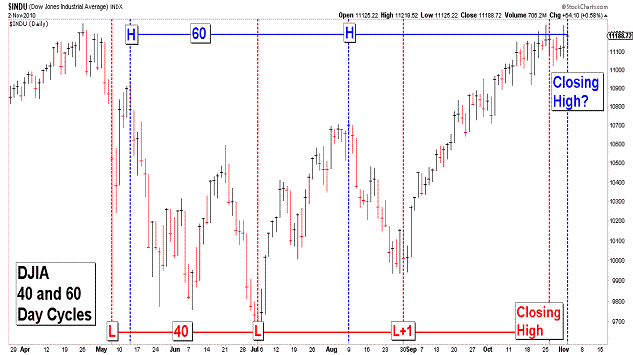
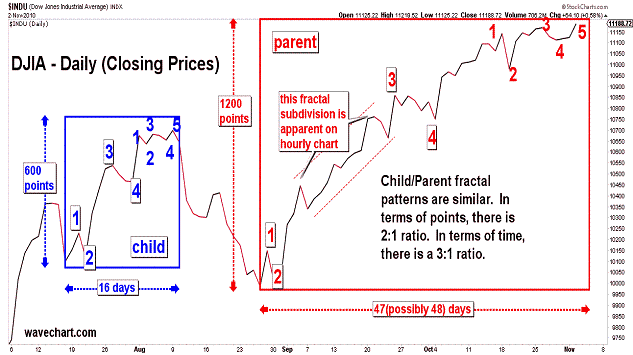
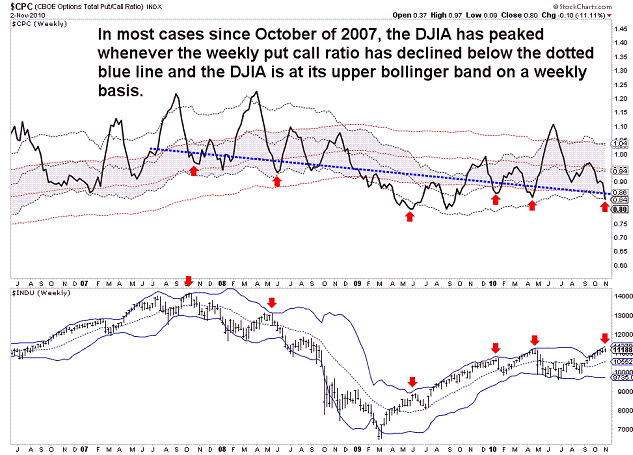
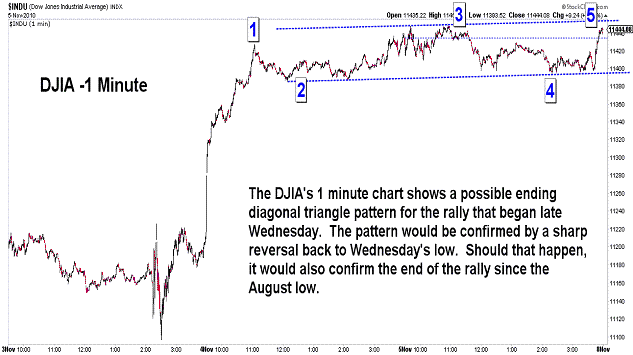
| November 2, 2010 update...In recent updates I have pointed out a number of cycle turning points materializing in the current time frame, one of which occurred today. Today's 60 day cycle turn date did not produce an intraday high (the most recent intraday high occurred on October 25th), but it did, at least, produce a closing high of 11188, the highest since the April 26th close of 11205. The short term pattern in most of the indices appears closest in appearancee to a diagonal triangle, although the pattern is clearly subclassic in form. Argueably, the fourth wave of the pattern was shallow and the fifth wave has not (yet) exceeded the third wave high. So, it is still possible that a rally above 11247 will take place in the next day or two. The diagonal triangle pattern could even elongate and become more complex. It would take a close below 10978 to eliminate that possibility. Take a look at the third chart above. It is a fractal chart which currently shows some interesting pattern, price and time relationships (on a closing basis) between the late July to early August rally and the present rally from the late August low. It requires a downward reversal in the next day or two from near current levels if the relationships are to remain intact. |
Important: Information and chart access provided herein is educational in nature and shall not, directly or indirectly, be construed as investment advice. No guarantees are made with respect to the accuracy of the information, opinions, predictions, etc. offered here in.
Copyright © 1997 - 2012. The Elliott Wave Chart Blog. All rights reserved. Email
|