|
Charts
IMPORTANT: Chart buy/sell signals are helpful in determining market support and resistance levels...and probable turning points. However, they are only useful if the analyst has a handle on the larger trend. Experience and judgment play a vital role in that determination ...as does Elliott wave analysis.
If a chart does not not appear when you click on the link, you may need to (1) enable javascript, and/or (2) disable pop up blocking for this site, or (3) right click on your mouse and open the link in a new tab or window. Charts will generally appear when you use Internet Exploer or Firefox. Do not use Google Chrome to view charts.
Contact us at info@wavechart.com if you have a question or comment. |
|

Elliott Wave Chart Blog November 2011 Archive
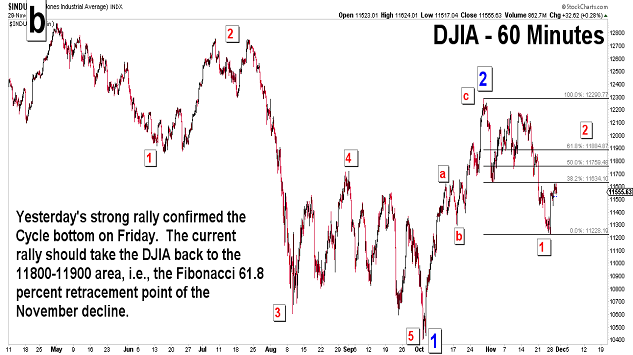
| November 29, 2011 update...Yesterday's strong rally confirmed Friday's bottom that was suggested by the hourly Cycle discussed in recent updates. Now, according to the pattern I am currently following for the DJIA, a rally to the 11800-11900 area (the Fibonacci 61.8 percent retracement of the recent decline) should be unfolding. The next Cycle top occurs toward the end of December. |
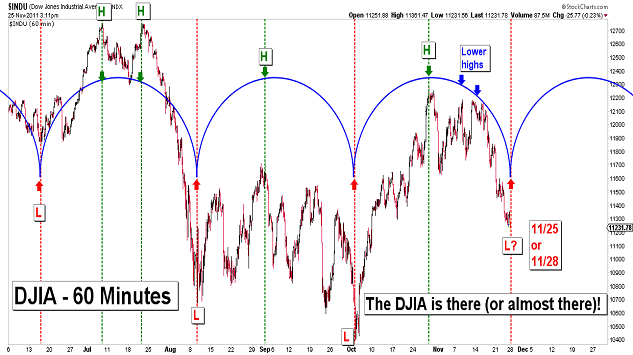
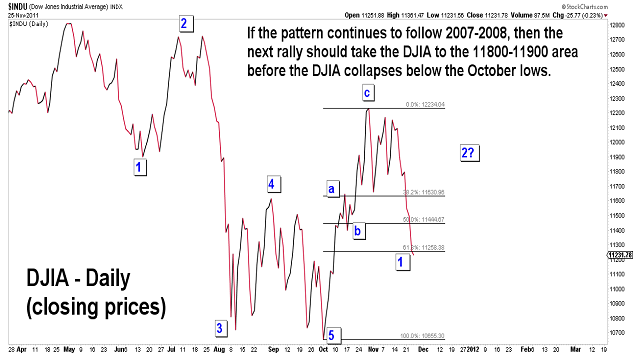
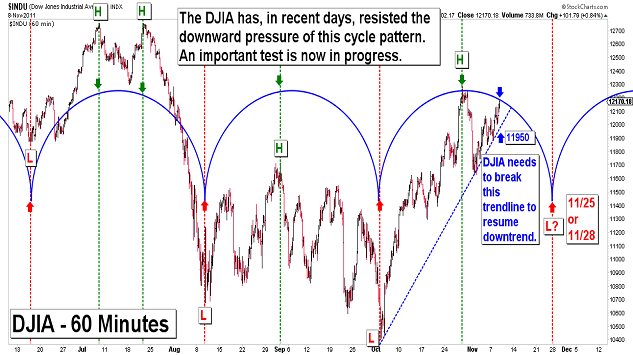
| November 25, 2011 update...It was a holday shortened week, but the DJIA still lost almost 5 percent. The downward cycle pressure clearly won out over the typical Thanksgiving week bullishness...but, as you can see in the first chart above, that downward pressure is now ending. If the DJIA continues to follow the 2007-2008 pattern (which I pointed out as a possibility in previous postings), it should reverse course next week and begin a rally back to the 11800 to 11900 area. Should that happen in the form of a three wave corrective pattern, the next decline after that will take the market below the October lows. We'll see. |
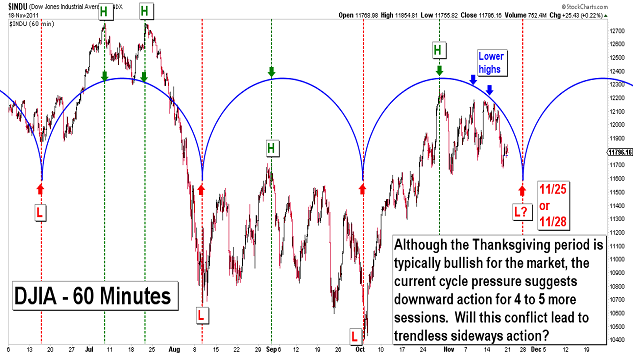
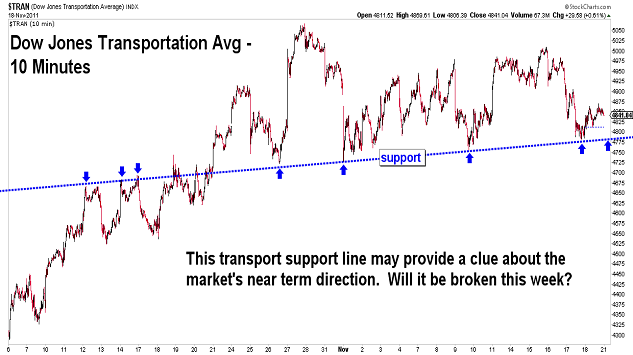
| November 19, 2011 update...With this week's decline of almost 3 percent in the DJIA, last week's Fibonacci Cycle forecast of a downward turn in the market was indeed accurate. Now, we have to deal with this week's Thanksgiving holiday, which typically gives a boost to the market. Opposing that positive action will be the current short term cycle (see third chart above), which will put downward stress on the market for four to five more days. The side that prevails this week could therefore provide us with a clue regarding the market's trend for the rest of the year. |
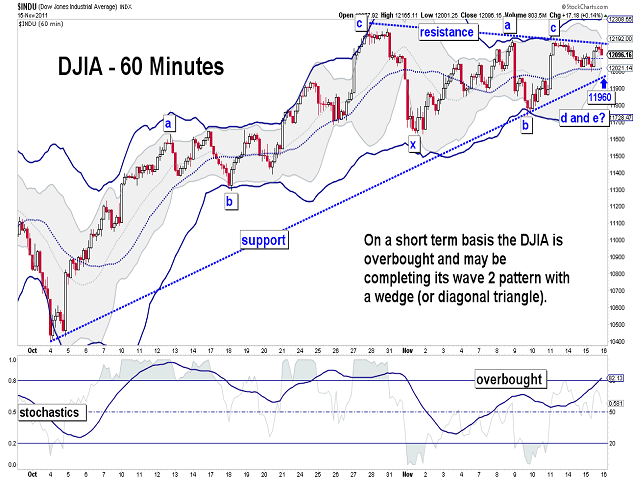
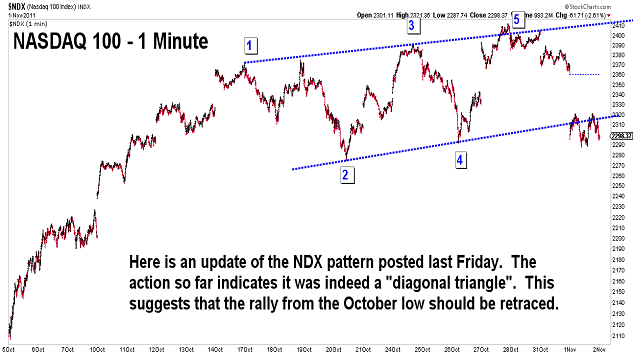
| November 15, 2011 update...There is not much to add to last Friday's update. The DJIA has not exceeded last week's high (which was indicated by the weekly Fibonacci Cycle) and appears to be topping in the form of a wedge or "diagonal triangle" pattern. The pattern should eventually resolve downward into a wave 3 decline if the wave labels shown in the chart are correct. |
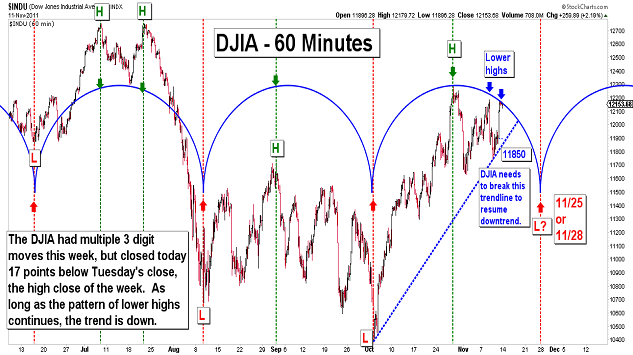
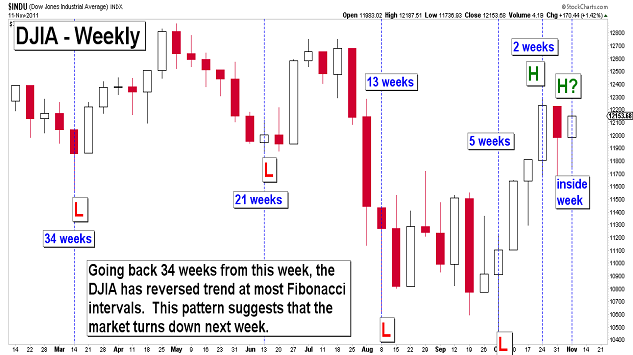
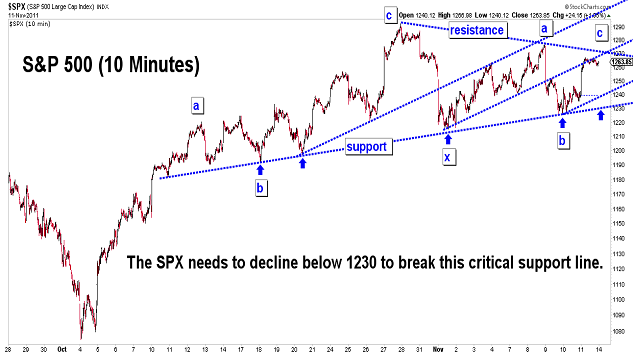
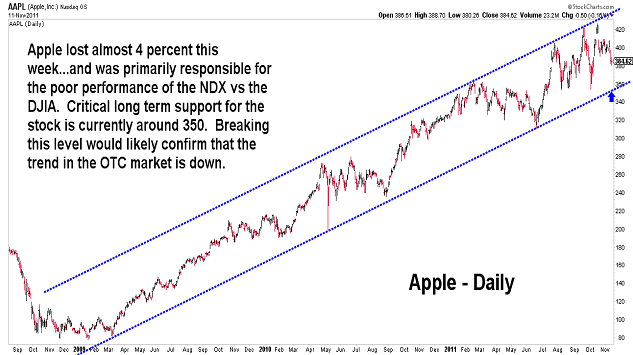
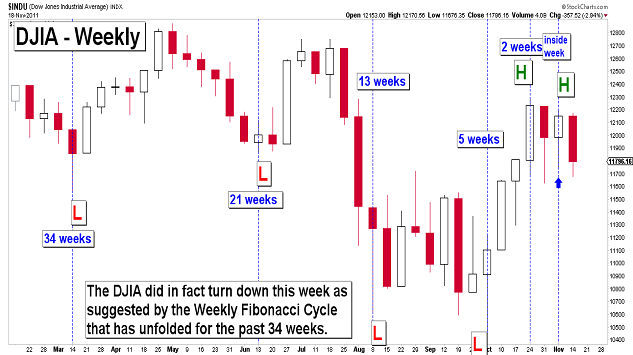
| November 11, 2011 update...The DJIA closed only about 17 points below Tuesday's close, the date I last posted an update. In between, the DJIA declined 400 points in one day...and then rallied almost all of the way back in the next two. Since the DJIA did NOT surpass the earlier week high, a pattern of lower highs is in place...and that is bearish IF that condition remains undisturbed. For the week, the DJIA gained about 1 1/2 percent, while the NASDAQ diverged and lost nominal ground. Timewise, the second chart above shows market reversals occuring at Fibonacci intervals going back 34 weeks. If this cyclic pattern continues, the market should decline immediately next week. We'll see. |
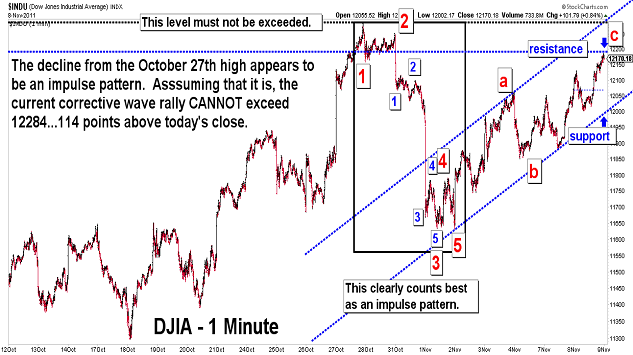
| November 7, 2011 update...The market has reached a very important juncture. The decline from the October 27th high appears to count best as an impulse wave. If it is, in fact, an impulse wave, the current corrective wave rally CANNOT exceed 12284 on an intraday basis. A rally of more than 114 points from here would suggest that the entire rally from the October low is not complete...and is extending and tracing out a more complex pattern. We'll see. |
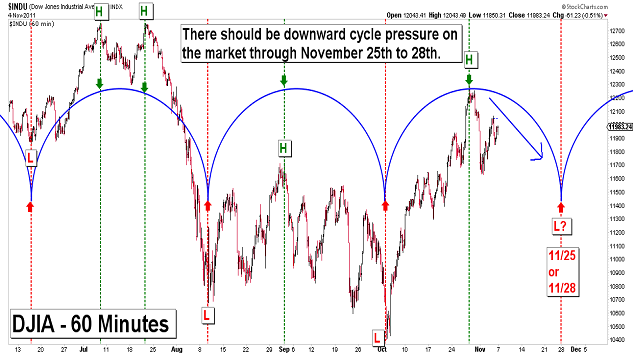
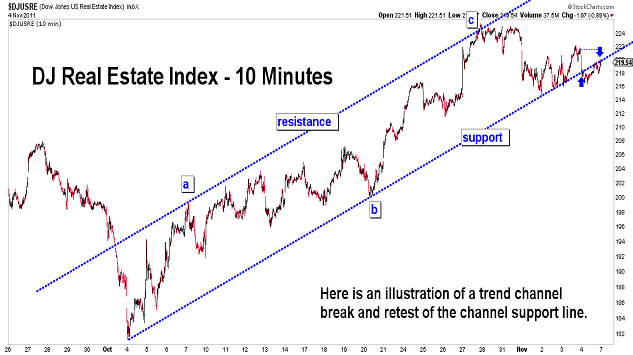
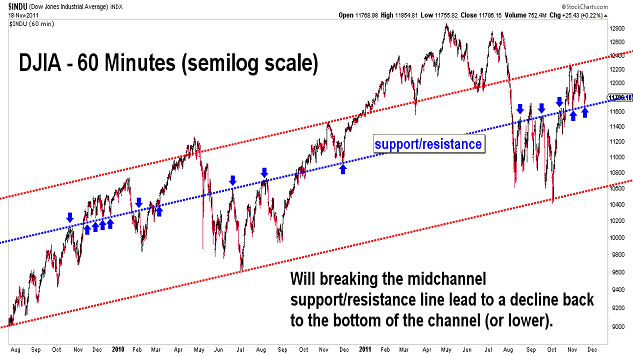
| November 4, 2011 update...Two very good days for the bears...followed by two good days for the bulls...followed by a moderately fair day for the bears resulted in a net loss of about 2 percent for the week. As you can see in the first chart above, cycle pressure should be downward until the last week of the month. The decline is off to a choppy start, but if the 2007 pattern I posted on Tuesday is any guide, then the DJIA will lose another 7 to 8 percent over the next few weeks. The second chart above illustrates the fact that some market indices have now declined below their October rally trendchannel...and this is an indication that the trend has reversed to the downside. |
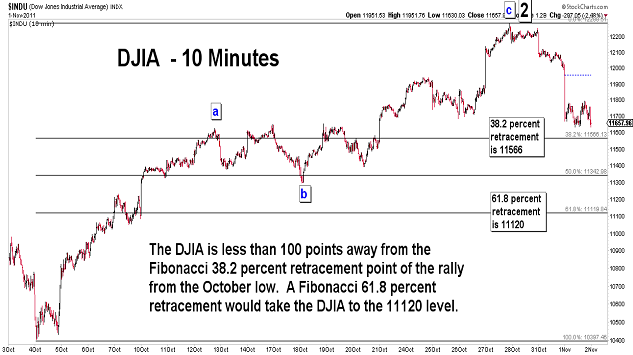
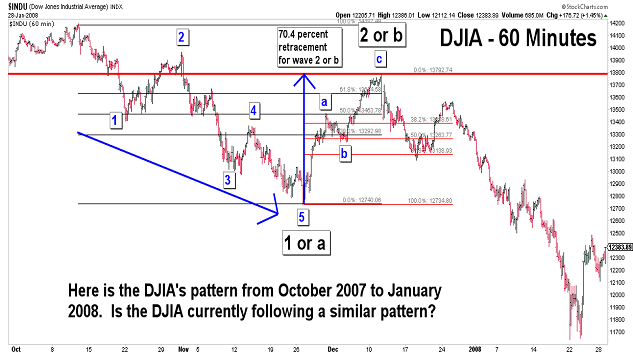
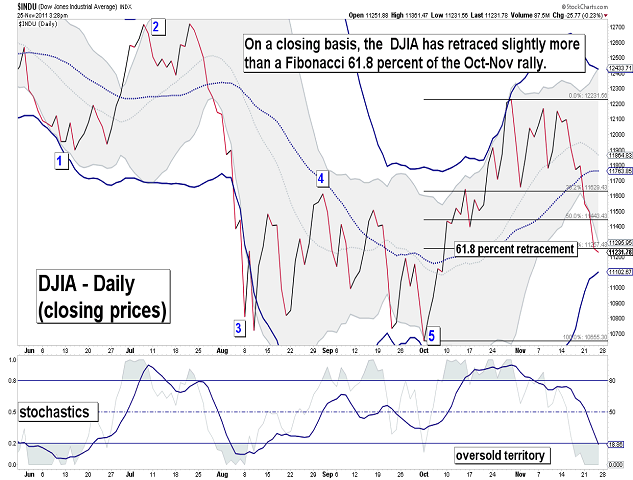
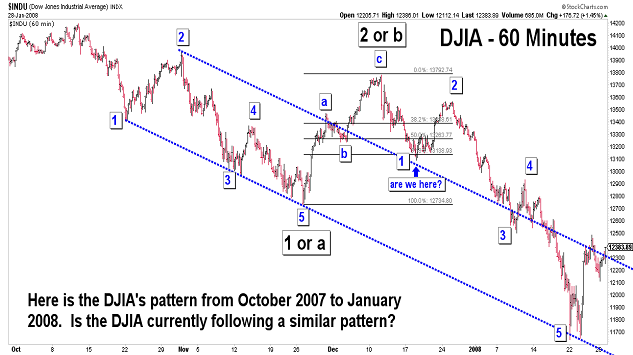
| November 1, 2011 update...In just two days this week the DJIA has lost more than 4 1/2 percent. Is it following a similar pattern to the one in late 2007/early 2008? On a closing basis, the recent October rally retraced about 73 percent of the decline from the May high to October low. The third chart above shows that the bounce in November/December 2007 retraced about 70 percent of the previous decline. The next decline then retraced about a Fibonacci 61.8 percent of that rally. If the DJIA is currently following that pattern, the current decline should eventually reach the 11120 area before the next short term rally. We'll see. |
Important: Information and chart access provided herein is limited to current subscribers only and shall not be forwarded or retransmitted without written authorization. It is educational in nature and shall not, directly or indirectly, be construed as investment advice. No guarantees are made with respect to the accuracy of the information, opinions, predictions,etc. offered here in. The username/password provided to a subscriber is unique and it is the sole responsibility of the subscriber to protect the confidentiality of said username/password and to further protect it from any unauthorized use.
Copyright © 1997 - 2013. The Elliott Wave Chart Blog. All rights reserved. Email
|