|
Charts
IMPORTANT: Chart buy/sell signals are helpful in determining market support and resistance levels...and probable turning points. However, they are only useful if the analyst has a handle on the larger trend. Experience and judgment play a vital role in that determination ...as does Elliott wave analysis.
If a chart does not not appear when you click on the link, you may need to (1) enable javascript, and/or (2) disable pop up blocking for this site, or (3) right click on your mouse and open the link in a new tab or window. Charts will generally appear when you use Internet Exploer or Firefox. Do not use Google Chrome to view charts.
Contact us at info@wavechart.com if you have a question or comment. |
|

Elliott Wave Chart Blog December 2010 Archive
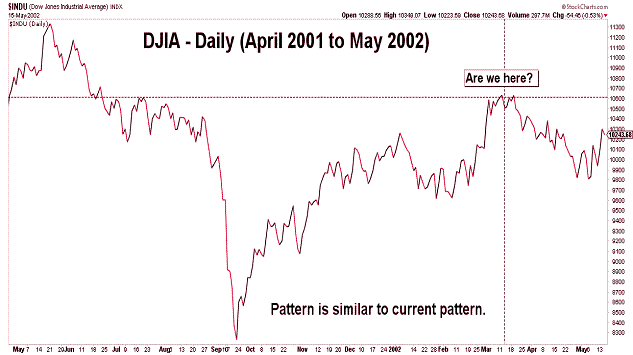
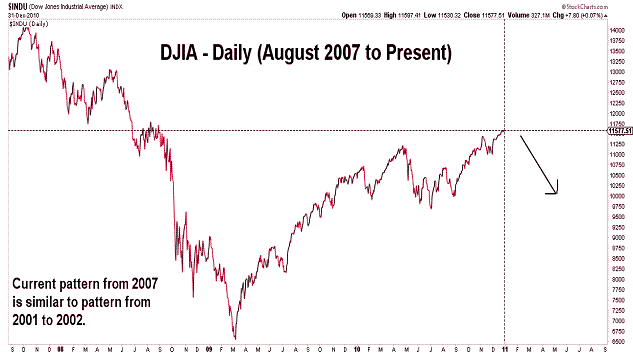
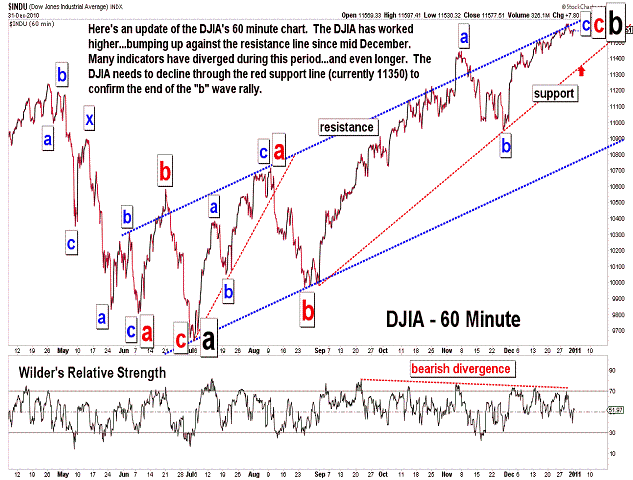
| December 31, 2010 update...The market moved in a very narrow range this week...which is quite typical of this holiday period. I said last week that "the majority of technical indicators, sentiment indicators, Elliott wave patterns, Fibonacci cycles, etc." suggest an important high is near. Nothing has changed...as you can see in the updated charts. One thing that I did note this week (see first two charts) was the similarity of the current long term pattern with the pattern that unfolded during 2001-2002. If the current pattern continues to follow that pattern, the entire rally from the March 2009 low will be completely retraced. The 2001-2002 chart only shows the beginning of that retracement. As bearish as I am right now, one thing about the pattern bothered me. It does allow for a more complex top to develop over the next several months. If the DJIA holds above the 10929 area during the next decline, one more rally to the top is possible before the eventual collapse. We'll see. Anyway, Happy New Year! |
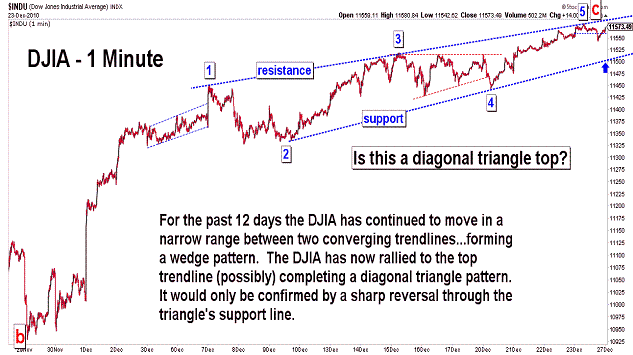
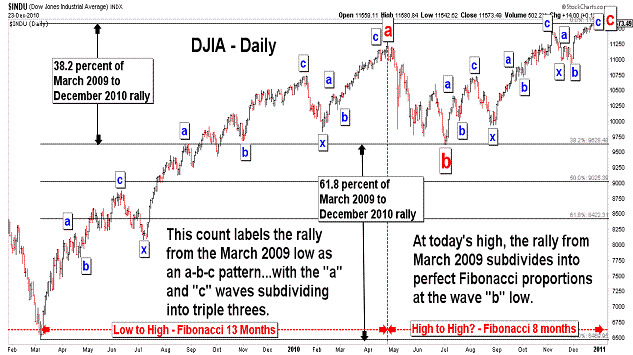
| December 23, 2010 update...The market advanced in sluggish fashion this holiday shortened week. It seems that CNBC and the bulls that the network constantly interviews believe the market will continue higher beyond this week...well into next year and likely into 2012. The bears have dwindled to a very tiny number and have had their voices muted in the face of a now (Fibonacci) 21 month rally from the March 2009 low. If the market is to keep moving higher, it will have to do so in the face of the majority of technical indicators, sentiment indicators, Elliott wave patterns, Fibonacci cycles, etc. that have, at least up until now, always coincided with an important high. If next week's market action is as uninteresting as this week's was, we will probably have to wait for the new year for the market's next big move. In the meantime...Merry Christmas! |
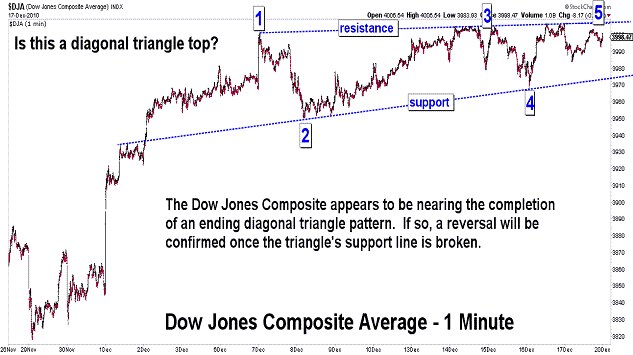
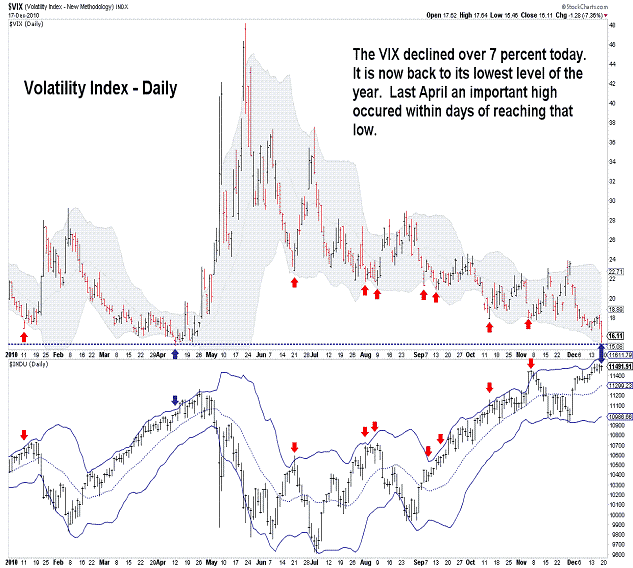
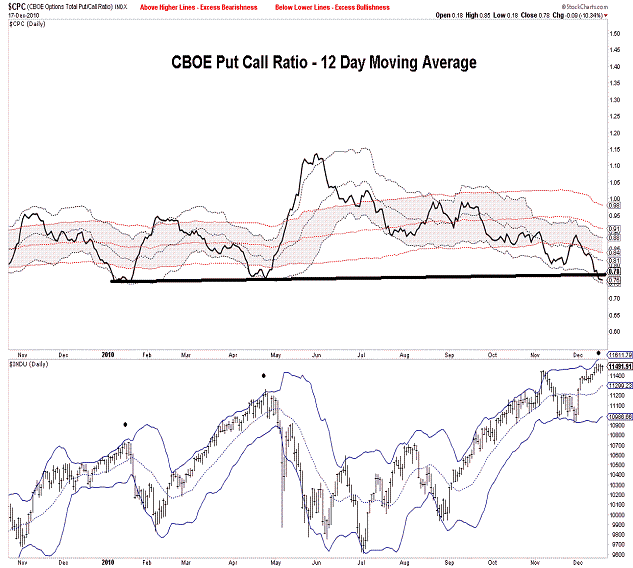
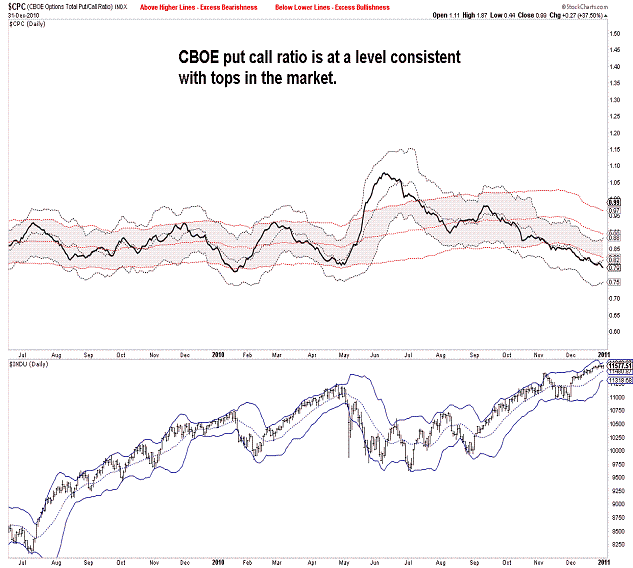
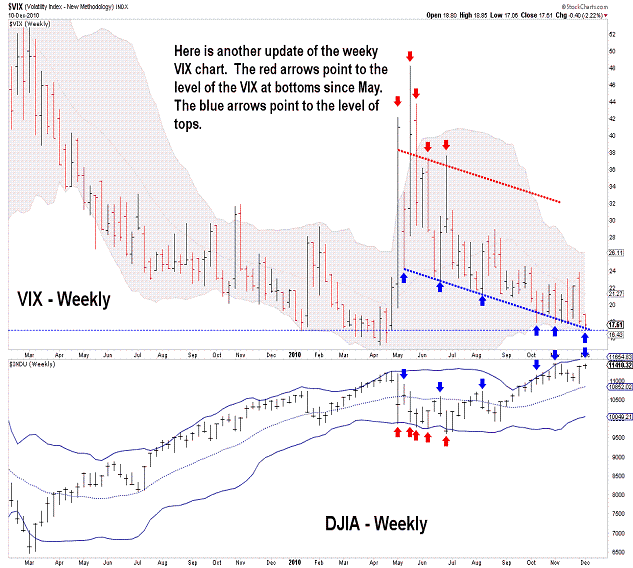
| December 17, 2010 update...There is not much to add to Tuesday's update. The market indices closed the week fractionally higher....with the DJIA closing above November's weekly closing high. The only major indice that I follow that has still not made a new closing high is the XMI (it could happen next week, however...it is less than 2 points away from doing so). The technicals remain at levels typically associated with a top (see VIX and Put Call Ratio charts). Also suggesting a top are the patterns of a number of indices that appear to have ending "diagonal triangles" (see chart of Dow Jones Composite Average). Despite the holiday trading towards the end of next week, it could be interesting. |
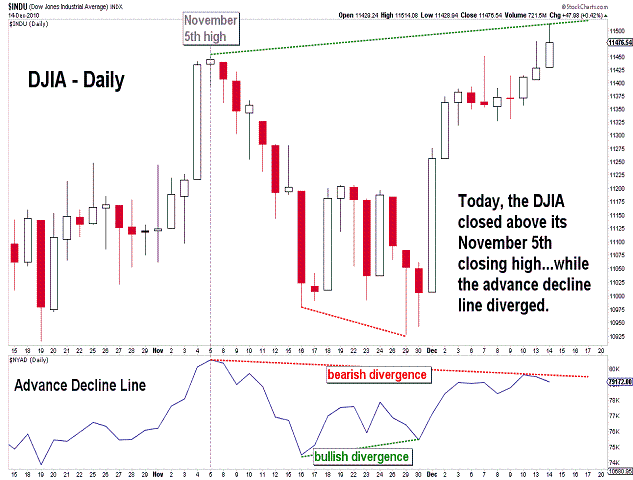
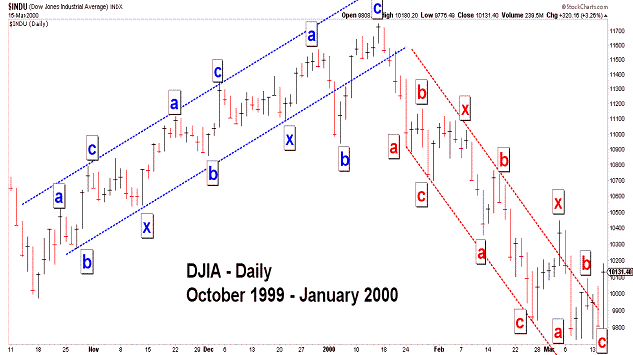
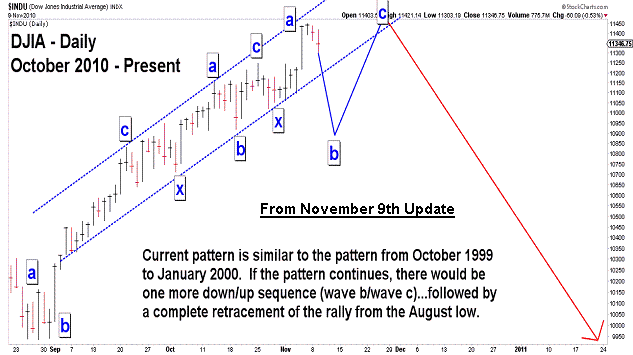
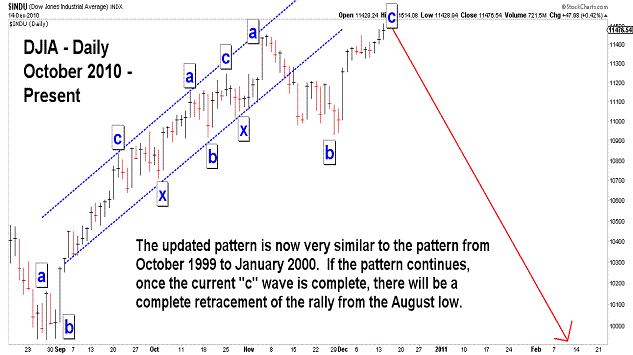
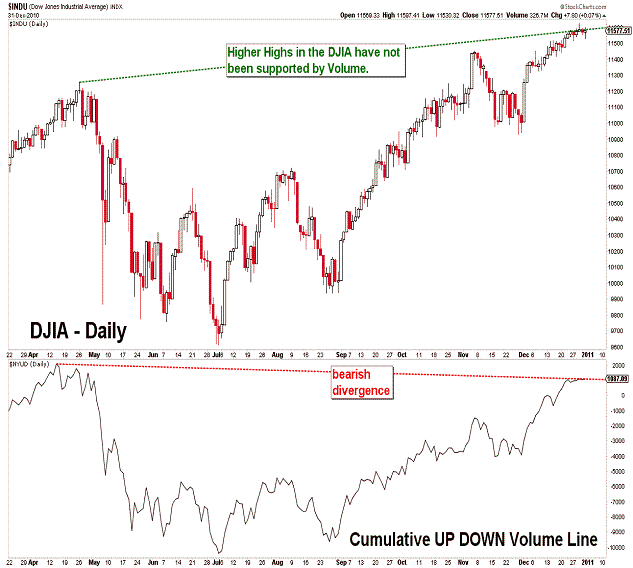
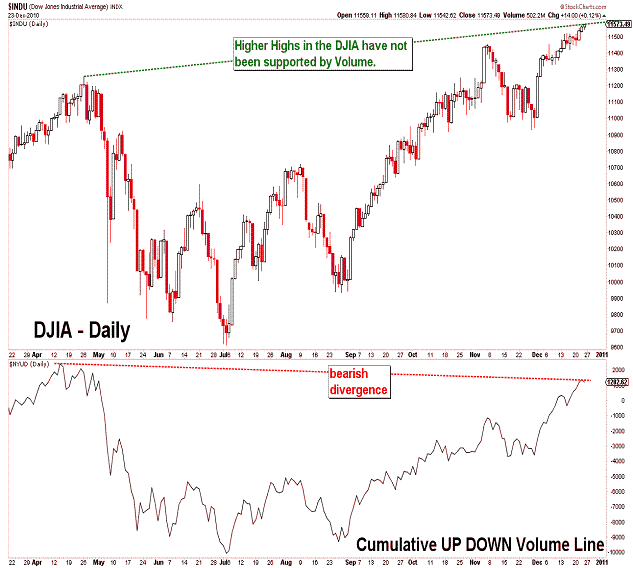
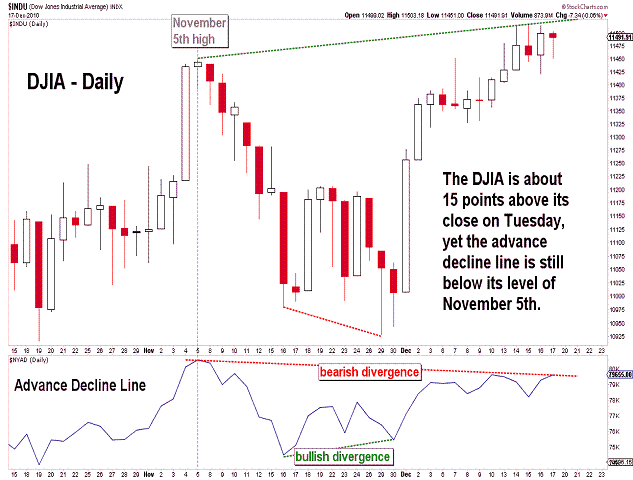
| December 14, 2010 update...The DJIA joined most of the other broad stock market indices and surpassed its November 5th high. It did so on an intraday basis yesterday...and a closing basis today (note: keep an eye on this Friday's close to see if the weekly high close of 11444.08 is also exceeded). But, despite the positive gains in the DJIA yesterday and today, the advance decline line moved lower each day. It...and the Major Market Index (XMI) on a closing basis...have, so far, failed to exceed their November 5th highs...creating a short term bearish divergence. I again posted two DJIA charts previously shown on November 9th (see below), along with an updated DJIA chart, that shows the similarity of the DJIA's pattern durring 1999-2000 with its current pattern. If the earlier pattern continues to be followed, the DJIA will soon begin a "c" wave decline that completely retraces all of the gains from the July-August lows. |
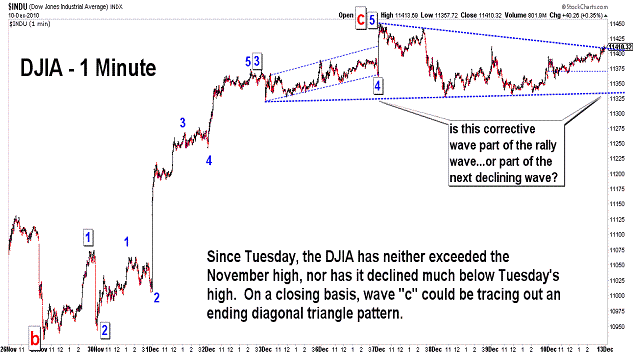
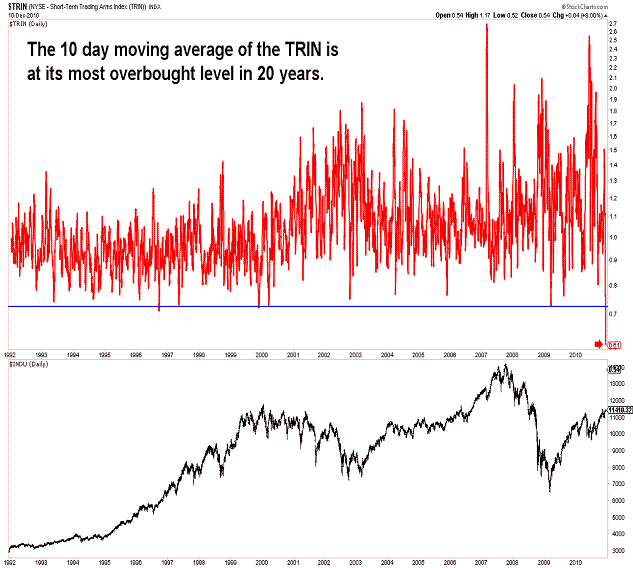
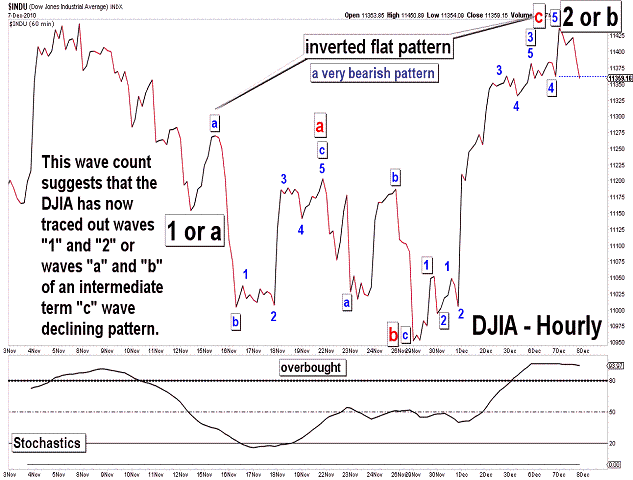
| December 10, 2010 update...On Tuesday, I suggested that if the DJIA remained below 11451 and my preferred wave count was valid, a powerful decline would begin "within the next day or so." Well, the DJIA did remain below 11451...but, the "powerful decline" never materialized. For the most part, the market spent the latter part of the week traveling sideways. On a closing basis, it appears that the DJIA could be tracing out a diagonal triangle pattern for wave "c" of the inverted flat pattern that I described in recent updates. If so, the pattern still needs a 4th wave decline and final 5th wave rally. It would take several more days to finish the pattern. Should the DJIA immediately close below 11359, the pattern would be negated...and a more significant decline would follow. I posted updates of several of the technical indicators that I follow to illustrate the extreme overbought condition of the market. In fact, the 10 day moving average of the TRIN is now at its most overbought level in 20 years. If that is meaningful, we should find out just how much within a short period of time. |
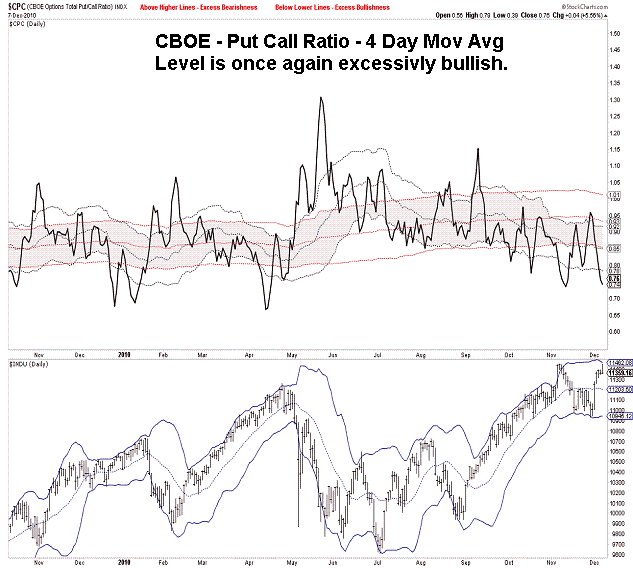
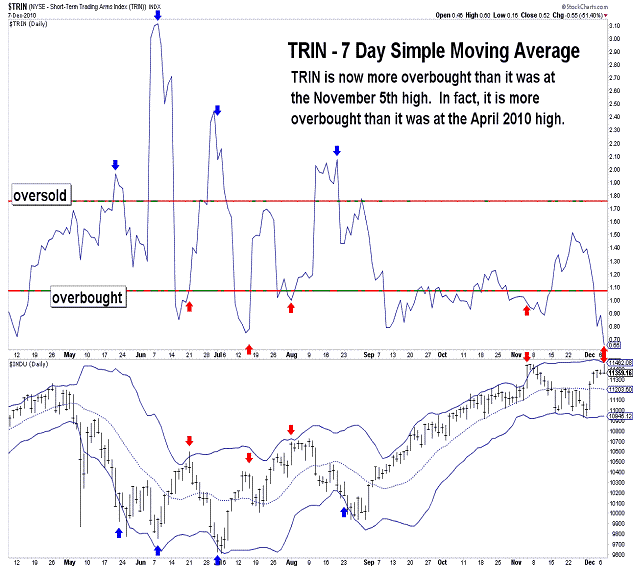
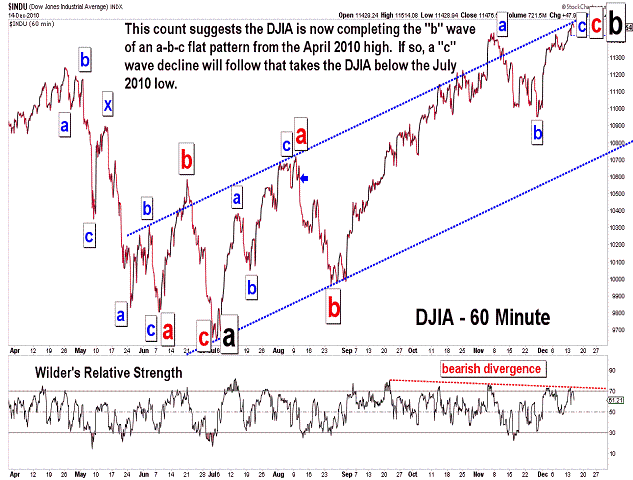
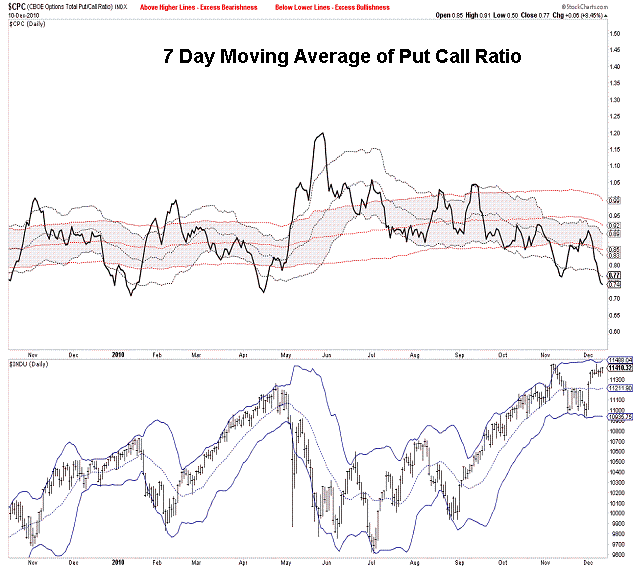
| December 7, 2010 update...On Friday, I indicated that the key to my preferred wave count was the November 5th high of 11451 (the precise number is 11451.53). Today, the DJIA came within a fraction of a point of that number and reversed course...closing down on the day. So, at least for today, my preferred count is still valid. And, if it is valid, the DJIA must begin within the next day or so a poweful decline below the November 29th low of 10929. Should the DJIA instead turn up and exceed today's high, the wave count would change to the one shown above for the S&P 500. (See the November 9th update for charts and a discussion of this possibility.) Finally, in addition to the DJIA's wave pattern, many of the technicals that I follow currently support a decline from here (see put call ratio and trin charts). |
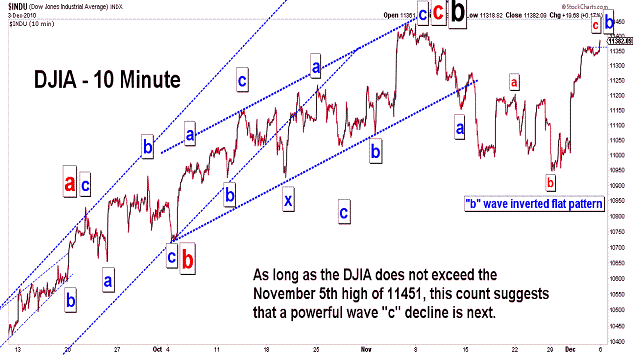
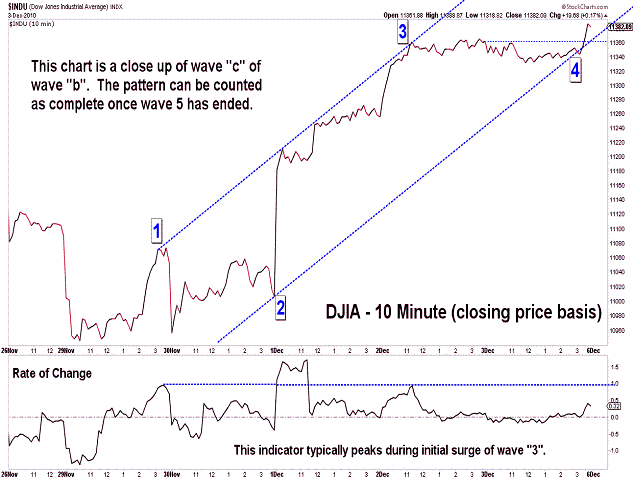
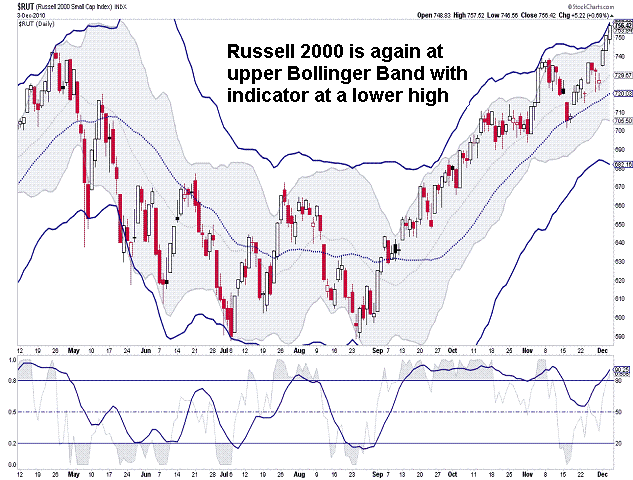
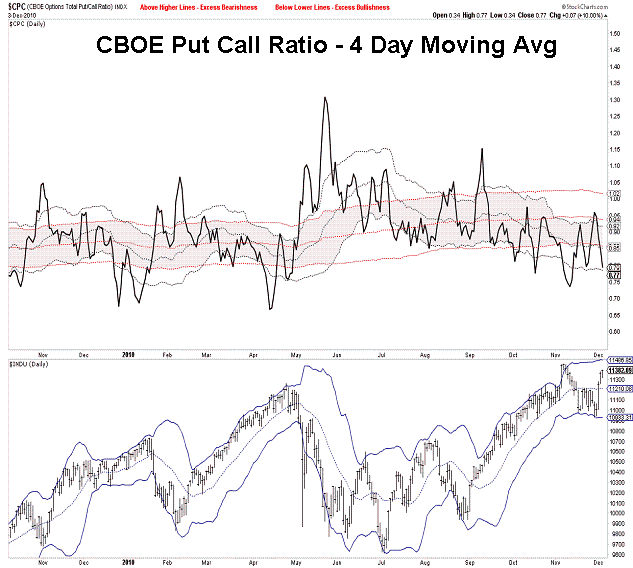
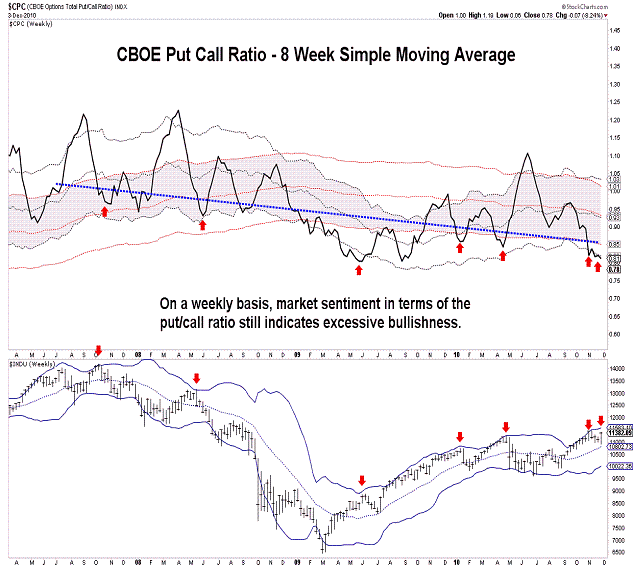
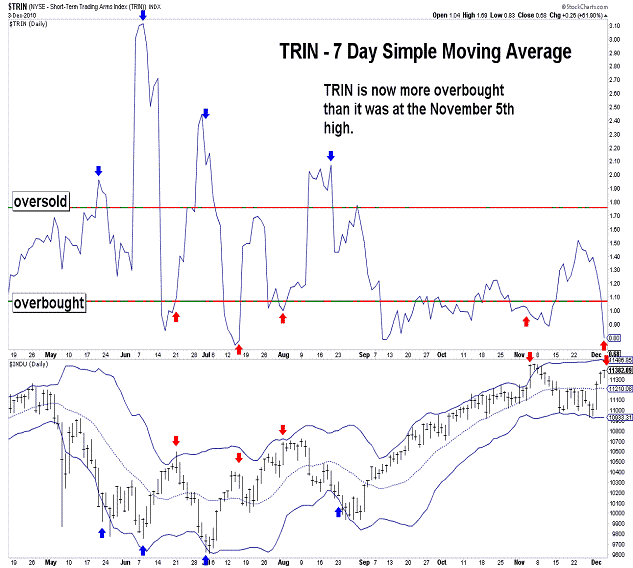
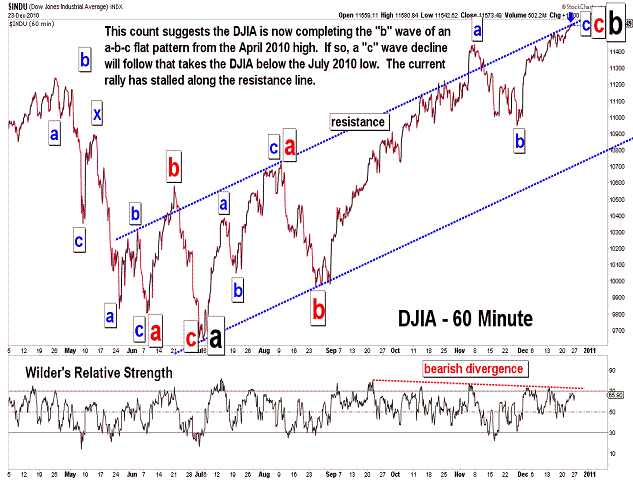
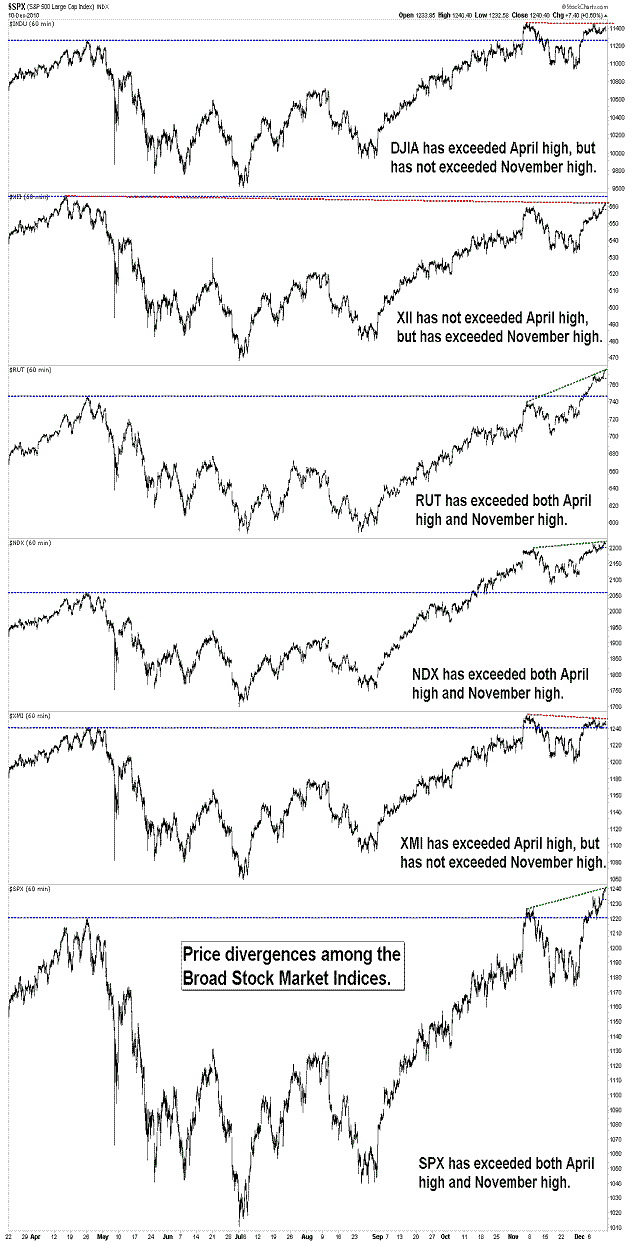
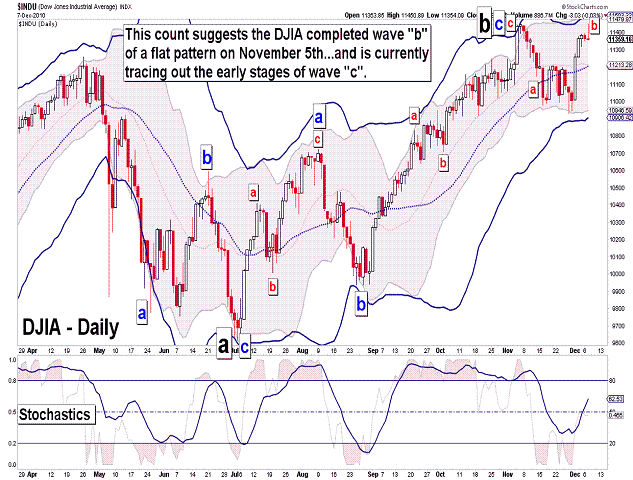
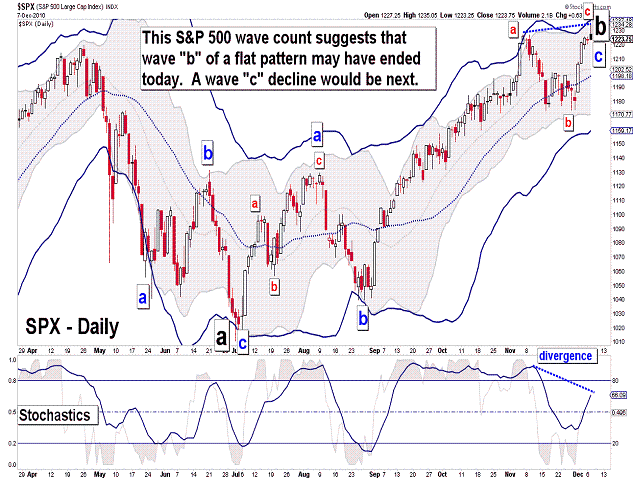
| December 3, 2010 update...In Tuesday's update I posted two charts that suggested possible short term patterns for the DJIA. I said: "The next two or three days should reveal which of the two ...patterns is correct. Well, the market did indeed reveal that the third chart in Tuesday's update was the correct count...at least so far. That count suggested that the DJIA was tracing out an inverted flat pattern (a very bearish pattern) with a "c" wave rally to come. The count further suggested that a larger degree "c" wave decline would follow once the smaller degree "c" wave rally pattern completed 5 waves. It appears that a 5th wave pattern began near the end of today's session. The key for this count is the November 5th high of 11451. This level cannot be exceeded for the count to remain valid. If it is exceeded, some other pattern is unfolding. While the DJIA and most indices are below their November 5th highs, several indices have, in fact, exceeded their November highs, i.e., Russell 2000 and the S&P 400. Their wave counts are slightly different...but, they too have reached extreme levels (in terms of their upper Bollinger bands - see Russell 2000 chart). Finally, note that market sentiment has returned to levels that would support a near term reversal to the downside (see put call ratio charts). Next week's action will be very critical in terms of the intermediate term trend. |
Important: Information and chart access provided herein is educational in nature and shall not, directly or indirectly, be construed as investment advice. No guarantees are made with respect to the accuracy of the information, opinions, predictions, etc. offered here in.
Copyright © 1997 - 2012. The Elliott Wave Chart Blog. All rights reserved. Email
|