Charts
Index Funds
Direxion - ProFunds - Rydex
Sector Funds
Direxion (Benchmarks/iShares)
ProFunds (Benchmarks)
Rydex (Benchmarks/ETFs)
ETFs
Foreign
Currencies
IMPORTANT: Chart buy/sell signals are helpful in determining market support and resistance levels...and probable turning points. However, they are only useful if the analyst has a handle on the larger trend. Experience and judgment play a vital role in that determination ...as does Elliott wave analysis.
If a chart does not not appear when you click on the link, you may need to (1) enable javascript, and/or (2) disable pop up blocking for this site, or (3) right click on your mouse and open the link in a new tab or window.
Please contact us at info@wavechart.com if you encounter a problem with the site. |
|
Elliott Wave Chart Blog 2008 Archive
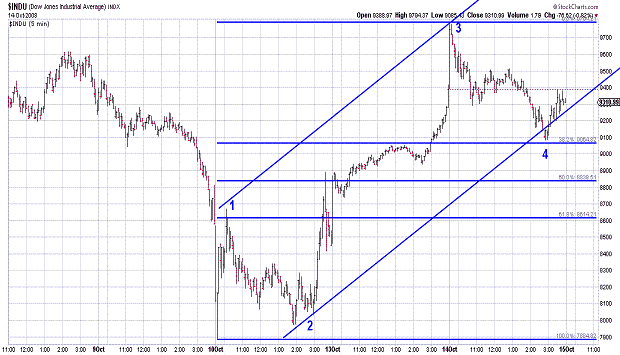
| December 30, 2008 update...The DJIA closed today right in the middle of the trading range since its December 8th high. Market action since then has been so dull that the VIX (volatility) index has now declined to the level it reached at the November 4th high. Market sentiment, in terms of the put/call ratios, is also at a level that has produced important tops during the past 18 months. Since the December 8th high, the DJIA has traced out a series of three wave patterns...which taken together appear to be forming a "c" wave "diagonal triangle". The 4th wave of this pattern is currently unfolding...and, if the pattern is correctly labeled, should end without exceeding the wave 2 high of 8936 (hourly basis). Once wave 4 is complete, a sharp 5th wave decline should follow to finish the "diagonal triangle"...as well as the larger degree "b" wave "flat" pattern (from the November 28th high). Once this larger degree "b" wave pattern is complete, a powerful "c" wave rally should follow. The 8936 hourly high is the key level to watch over the next day or two. My analysis would be negated if it is exceeded. I will update the charts again on Friday. Until then, I wish everyone a happy and profitable new year! |
| December 23, 2008 update...The markets are following the script outlined in last Friday's update...so far. I have updated the charts to include the trading of the past two sessions. Given the fact that we only have 1 1/2 "holiday sessions" remaining this week...I don't really expect too much to occur. The past two important lows, i.e, October 10th and November 21st...were 30 trading days apart. If the next low falls at the same interval, the market should make an important low the first full week of January. We'll see. In the meantime, I wish everyone a very happy and joyous holiday! |
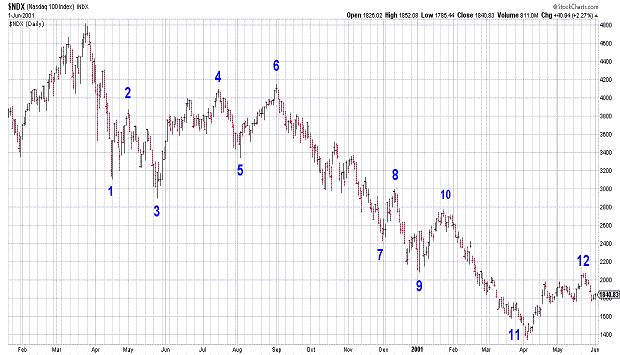
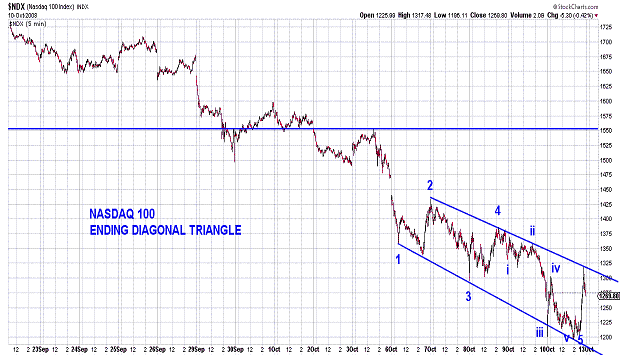
| December 19, 2008 update...In the December 9th update (see below), I speculated that the DJIA was tracing out a "bullish 'b' wave 'flat' pattern" since the November 28th high. Given the declining action of the DJIA over the past few days and the holiday trading just ahead of us, that forecast has moved to the top of today's list of probable patterns between now and the end of the year (and beginning of next year). The three wave patterns we have witnessed since the December 8th high now, taken together, appear to be the subwaves of an unfolding "c" wave diagonal triangle pattern. IF the count is correct, the DJIA is currently tracing out wave 3 of the triangle...which should take the average below 8347 next week. Following the completion of wave 3, two more three wave patterns should follow for waves 4 and 5. If the current pace of the pattern continues without change, the diagonal triangle should finish by the end of the year...or early next year at the latest. Once the pattern is complete, a powerful "c" wave rally should follow. You may have noticed that some of the indices, like the NASDAQ 100 (on a closing basis) have been stronger than the DJIA...and exceeded their December 8th (closing) highs. For these indices, the pattern since their December 1st low can be counted as a rising "c" wave diagonal triangle for the 4th wave of a larger degree diagonal triangle bottom (see NDX chart above...it's less confusing than this verbiage!). Please note that other patterns remain viable...so any variance from the pattern I just described will negate my analysis. |
| December 16, 2008 update...Today's rally brought the market to a critical juncture. Many of the indices, including the DJIA, reached important trendline and trendchannel resisitance levels today. With many of the technical indicators that I follow tilted to the sell side, my bias here would be that the market pulls back in the short term. But, the market, of course, is under no obligation to follow the indicators...and a breakout above the 12/8 high of DJIA 9026 is certainly possible. (A few indices today closed above their closing high of that day...suggesting their intraday highs will be exceeded as well). From an Elliott wave standpoint, the patterns since the 11/21 low are messy. They are all corrective in nature (i.e., 3 wave patterns)...and can combine into a variety of patterns...with an equal distribution of possible rising and falling patterns from here. If the DJIA does break out above 9026 and the rally continues...a substantial retracement will follow once it concludes. In previous updates I had suggested a target for the DJIA around 10000. One possible iteration of the current pattern would get us there very quickly. Given the odds, however, I just wouldn't be willing to place a big bet on it. |
| December 12, 2008 update...For the week, the DJIA declined a nominal 6 points to close at 8629...after making its intraday high on Monday at 9026. Like last Friday's bullish reaction and recovery to negative news on employment, the DJIA again today reacted positively and recovered after negative news about a bailout of the nations's big 3 automobile companies. The market's bullish reaction to negative news of late is a good sign that the market is building a long term bottom...but, the technical indicators that I follow are suggesting that caution is warranted in the shorter term. Here are some of them: (1) trendline resistance was met this week (NDX, MID, RUT) and held; (2) many of the indices reached a level close to their upper bollinger band on the daily charts; (3) various overbought/oversold indicators reached an overbought short term condition; and (4) sentiment indicators (see CBOE Equity put/call ratio chart) reached a level where short term declines have begun in recent months. Interestingly, the DJIA's choppy decline from its high on Monday through today appears to be an inverse image of the decline from October 21st - 27th. If the pattern continues, this week's decline should accelerate next week. A rally above this week's high, however, would indicate that the wave c' decline (see the DJIA's hourly chart above) turned out to be much shallower than expected...and it would suggest that the rally from the November 21st low has resumed toward 10000. |
| December 9, 2008 update...Today, the NASDAQ 100 (and some other indices, i.e., MID, RUT) traced out key reversal days at trendline resistance. With market sentiment (in terms of the put/call ratios) giving short term sell signals, the market should...IF it is still following the same signals it has followed over the past few months...decline for the next week or so. If I have labeled the waves correctly on the DJIA chart (note: this is only one of several alternate counts), the DJIA should trace out a 5-wave "c" wave pattern...to complete a (one degree larger) bullish "b" wave "flat" pattern. Yesterday's high in the DJIA was near the daily chart's upper bollinger band. The question now is...will we see the DJIA return to its lower bollinger band around 7800 before the next rally begins? Note the parallel trendchannel on the DJIA's hourly chart above...which currently has a bottom around the same level, i.e., 7800. A rally above yesterday's high would negate this count and analysis. |

December 5, 2008 update...Today's turnaround in the face of this morning's negative news about employment was bullish. Other factors, however, like the short term Elliott wave pattern and market sentiment are not pointing the market in a clear direction. All of the short term patterns since last Friday's high have been of the 3 wave corrective variety...and putting them together into the next larger pattern is open to various possibilities. There is a convergence of trendline and Fibonacci resistance lines occuring in the next three weeks or so...which would help to bring some order to the larger pattern of PRIMARY wave C. A stong breakout above last Friday's high would suggest the upward pattern since the November 21st low has resumed. If the market fails to quickly rally above 8831, this week's corrective action is likely to continue.
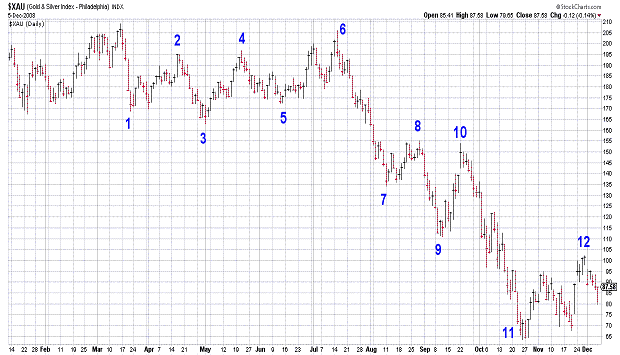
It is not often that I post or discuss the XAU chart, but I thought there was an interesting comparison between the pattern of the XAU's decline from its March high and the pattern of the NDX's decline from 2000 to 2002. If the XAU's pattern continues to immitate that of the NDX it should decline below it's recent low in the coming weeks...unless, before that, the XAU needs one more high to reach point 12. We'll see! |
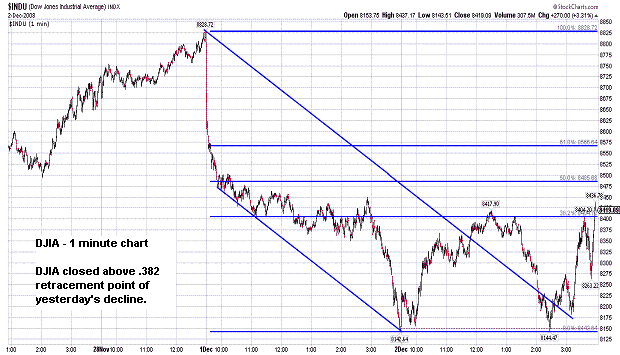
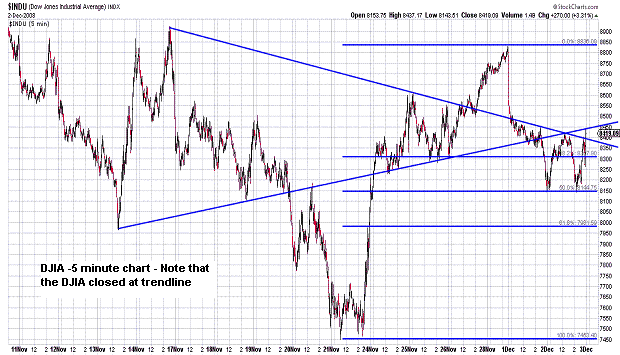
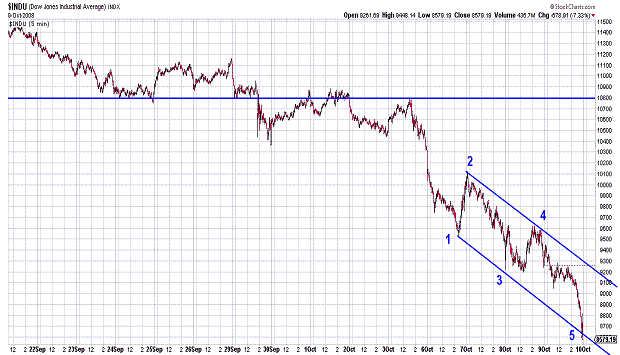
| December 2, 2008 update...Today was another one of those volatile days we have seen since October when the market has moved widely in both directions. An early rally of 250 points was completely retraced by 2:30pm...and then followed by a 270 point surge into the close. Unfortunately, today's Elliott wave pattern can be interpreted two ways: (1) as the beginning of a wave "c" rally toward 10000, or (2) as a "b" wave pattern (a-b-c) within a still unfolding "b" wave decline that began yesterday from 8831. The DJIA's rally today retraced slightly more than a Fibonacci 38.2 percent of yesterday's decline...and must continue strongly through trendline resistance (see 5 minute chart) tomorrow if wave "c" is underway. A decline tomorrow would suggest that the wave "b" decline is not complete. The indicators are mixed right here and not very helpful...although the DJIA hourly chart shows that the Range Plus Overbought/Oversold indicator is near oversold territory. Sentiment indicators have moved into neutral territory...but, were recently extremely bearish...which, in most cases, should be followed by a rally that lasts weeks/months (not just 1 week). |
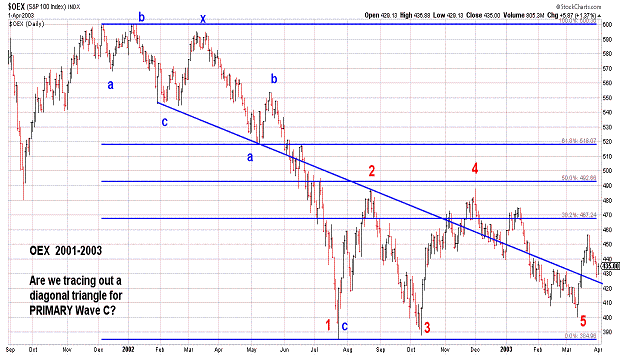
| November 28, 2008 update...Today's "Black Friday" session was short...ending at 1:00pm. I hope everyone had a great Thanksgiving holiday! I thought I would just update and review the two major wave count alternates for PRIMARY wave C at this point. One is illustrated by the DJIA in the first chart...the other by the OEX in the second (and third) charts. To review...assuming that CYCLE wave B is a flat, PRIMARY wave C should trace out a five wave pattern. As I see it, however, while wave C is unfolding in five waves, it is doing so within one of the forms of a diagonal triangle (the DJIA demonstrates the non-wedge form; the OEX demonstrates the more typical wedge form). In the coming weeks, the trendlines and trendchannel lines shown in the charts should have an important impact regarding which of the alternates is more likely to occur. Finally, while I only mention it occasionally as a possibility, should PRIMARY wave C end in three waves...CYCLE wave B could continue and form a horizontal triangle pattern...with PRIMARY waves D and E yet to come. |
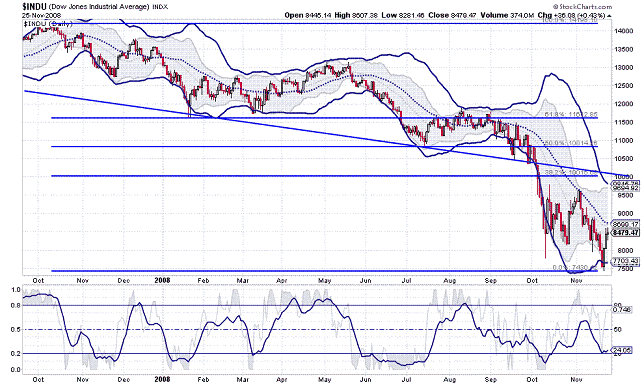
November 25, 2008 update...Sorry for the brevity of tonight's update, but I just returned this afternoon after having orthopaedic surgery yesterday at Pennsylvania Hospital in Philadelphia. (The procedure was called a "laminectomy at L5 on the left and excision of disc herniation" i.e., to relieve major sciatic pain in the left leg...I am happy to report that everything seems to have gone well!) I am still somewhat woozy from the pain medication. Anyway, as of today's close, everything from last Friday's update would still seem to be in order, with a target for this rally of around 10,000 (see trendline and .382 retracement level convergence on chart.)
BTW, thanks to the many of you who had emailed me your good wishes! I truly appreciated it. |
| November 21, 2008 update...The cycle dates pointed out in Wednesday's update may have been off by a day, but if the market continues to rally from here, they were close enough to signal an important low was imminent. I have been looking for a rally to the top of the DJIA's declining channel to complete wave 4 of PRIMARY wave C. The level to watch now is around 10,000...a point where trendline and Fibonacci (.382) resistance converge. Today's approximate 500 point rally was a good start...with a lower bollinger band candlestick reversal to boot. In the past 13 days, all rallies have lasted just one day. If the rally continues on Monday, it should be an initial sign that the short term trend has turned higher. By the way, the 12 day moving average of the Equity Put/Call ratio (a sentiment indicator) is now higher than it was at the March 2008 lows. |
| November 19, 2008 special update...I am posting an extra update tonight to alert you to an interesting cycle phenomenon that is occurring this week...in terms of Fibonacci days and trading days (closing prices). Note in the charts above that the market has reversed course every 99th Fibonacci day and every 71st trading day (closing prices). Today is the 99th Fibonacci day and Friday is the 71st trading day. These cycle dates are coinciding with what appear to be complete Elliott wave patterns as well. |
| November 18, 2008 update...Is the market getting ready to break out of its sideway's channel? I certainly hope so because I would like to have some new evidence that would finally enable me to offer some interesting (and nonrepeditive) comments on the likely outcome of PRIMARY wave C. If we get a rally from here, I would also feel more confident that the DJIA's October 10th price low will hold. If the action continues sideway, the possibility remains that the DJIA may again test the intraday low. My friend Hank Wernicki of the website www.elliottfractals.com was kind enough to allow me to show you two of his SPX wavelet charts that happen to be in agreement with my forecast for a rally back to the top of the DJIA's trendchannel (possibly higher). I certainly hope it's right! Check out his website...there is a lot of interesting information. |
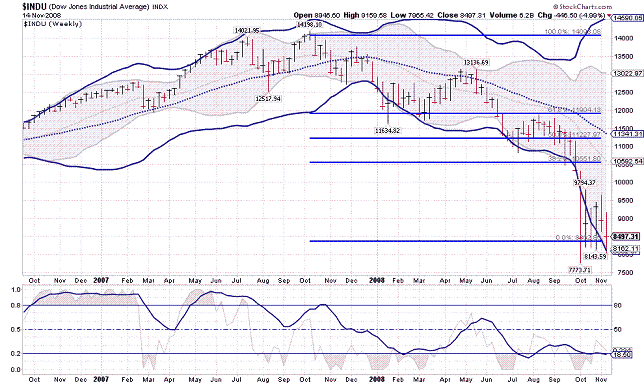
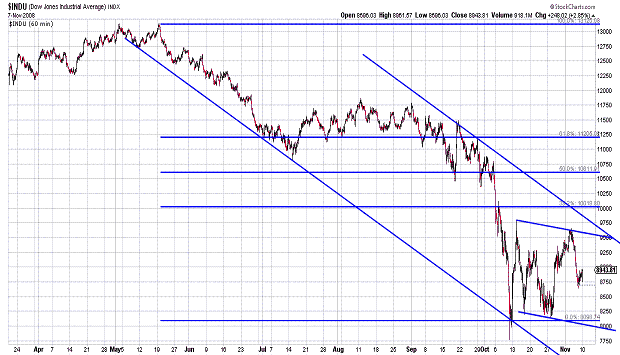
November 14, 2008 update...Assuming that yesterday's key reversal rally was the beginning of a wave (wave "c") to the top of the declining trendchannel (first chart above), then today was either a 2nd or "b" wave retracement. In terms of size, the retracement was slightly more that a Fibonacci 38.2 percent retracement of yesterday's low to yesterday's high. Today's mid-day countertrend rally exceeded yesterday's high...suggesting that it was the "b" wave of a flat pattern. Flat corrective patterns indicate strength in the rally that follows. One way to count the current action is that of a fourth wave, i.e., wave "a" - 10/27 to 11/4, wave "b" - 11/4 to 11/13, and wave "c" now underway to the top of the channel. This count is valid as long as yesterday's low is not violated.
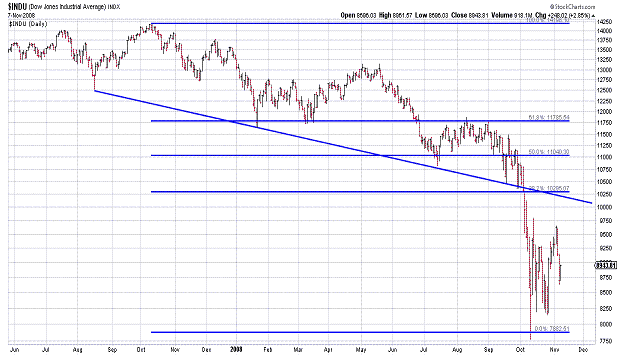
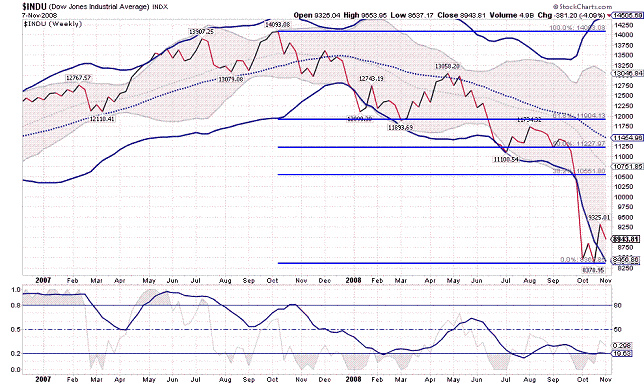
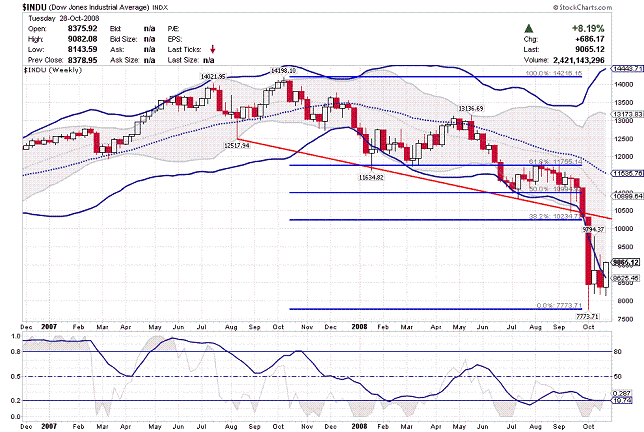
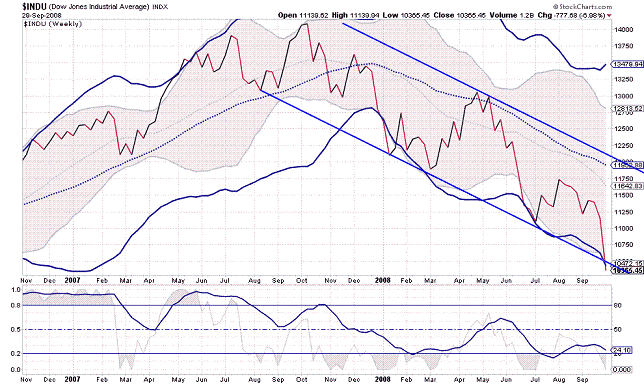
I had mentioned for that last several updates that I expected the decline from the November 4th high to test the lower bollinger band on the weekly chart. It did! In fact, if you look at the third chart above, you will notice that that is exactly where the decline ended and the rally began. You had to be prepared before hand to go long because the speed of the reversal was such that if you weren't watching the market during the day, you missed it...well, at least the first part of it (if my analysis is correct). Finally, I thought I would show you a long term chart of the DJIA (on an arithmetic scale) why the year plus long Bear Market is nearing an end. The only thing remaining are 4th and 5th wave subdivisions. |
| November 13, 2008 update...See tonight's single chart update above of PRIMARY wave C. After testing and retesting the bottom of the parallel trendchannel, the DJIA should now trace out a pattern to the top of the trendchannel...to complete wave 4. |
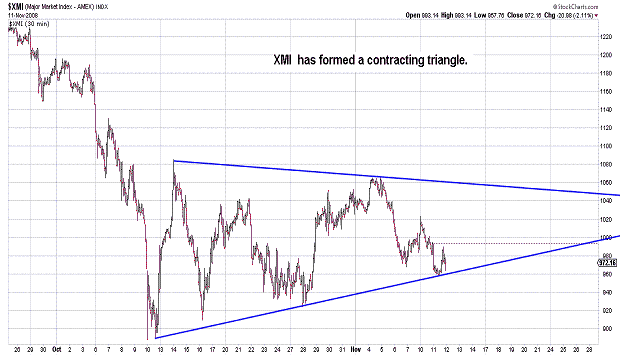
| November 11, 2008 update...Tonight's update (in terms of charts) will be brief because the current pattern is not quite complete. As the pattern nears completion I will add more charts. To review a point from the last update, I have been waiting for the DJIA to test the area of the lower bollinger band on the weekly chart to set up an aggressive long position. Today that level was around 8200. While that level is important, even more important is the pattern that is traced out by the market as it declines toward that level. I want to see a classsic ending diagonal triangle pattern in (at least) some of the indices, i.e, NDX, RUT, MID, NYA. Other indices, like the DJIA, SPX and OEX, have slightly different patterns, but the result that follows should be the same, i.e., a strong rally that retraces the entire diagonal triangle pattern. The XMI illustrated above shows a classic horizontal contracting triangle...which many are counting as a 4th wave...to be followed by a 5th wave thrust to lows below that of October 10th. If this interpretation is correct, an "e" wave rally should occur over the next day or two. A decline tomorrow that exceeds today's low will negate that count. I have been doubtful about the validity of this 4th wave count since it was first discussed several weeks ago on other websites...but, its resolution...one way or the other...is upon us. I am hoping that the decline of the past two days continues without an intervening "e" wave rally. (Oddly enough, even if there is a brief "e" wave rally, it may be possible to claim that both interpretations were right...depending on where the market makes its final low.) Sentiment is in the neutral range...and needs more put buying to set up the eventual rally that I am expecting. |
| November 7, 2008 update...After topping at 9653 on Tuesday, the market decided not to celebrate the election of our new president with an enthusiastic rally (down 1174 over the next two days). The markets finally calmed down somewhat today with a 248 point rally. As I have noted in recent updates, things will eventually get better for our new president...in fact, in terms of the market averages, stocks will be substantially higher by the time his two terms are complete. In the meantime, we still have to contend with the completion of PRIMARY wave C of CYCLE wave B...which will provide some unsettling days in the weeks and months ahead. The DJIA currently appears to be tracing out a downward a-b-c pattern (today was wave b) from the previously mentioned 9653 level. Once wave c is complete (most likely by next week...and I still think the weekly lower bollinger band is the likely target)...a multiweek rally to the 10200-300 area (possibly higher) should begin. If I am right, this is likely to be the last (best) rally of the year! |
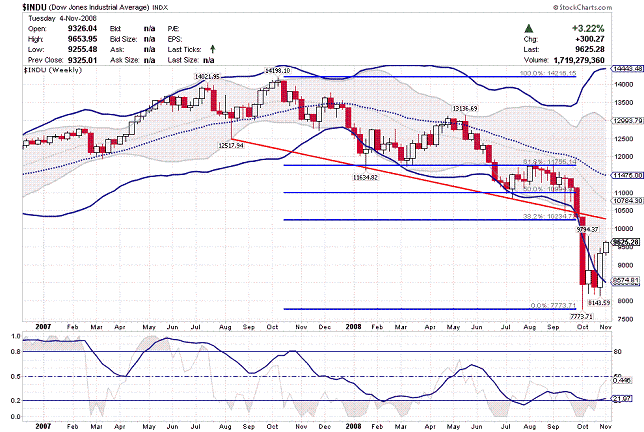
| November 4, 2008 update...The market will know who the next President of the United States will be when it opens for trading tomorrow...and it will render its verdict. The big picture is thus: the DJIA is tracing out PRIMARY wave C of CYCLE wave B...which appears to be an a-b-c flat pattern. Unfortunately for President Bush, his two terms coincided almost exactly with this Bear Market of CYCLE dimension. He was doomed to be an unpopular president from the start. The next president will have the stock market wind at his back...an 8 year CYCLE wave Bull market...and will likely be considered (during his time in office) as one of the most popular presidents in US history. Looking at a long term stock market chart, it is apparent (at least to me) that stock market cycles affect the popularity of a US President and not vice versa. With respect to the market's time frame of smaller degree, it is best viewed (at this time) as a 4th wave. (There are other valid counts that include a diagonal triangle for PRIMARY wave C...but, they can be addressed as the current pattern becomes more fully developed.) The DJIA rallied to the 9600-9700 area today...which as you can see in one of the charts above...contains a multitude of resistance lines. If the lines are valid, the DJIA should now turn lower. I speculated in a previous update that once the DJIA exceeded its lower Bollinger band on the weekly chart (it has), it would return to the band for support. As of today, that level is around 8575. If instead, the DJIA should first continue higher, the 10200-300 resistance area should halt the rally. |
| October 31, 2008 update...I applogize for the lateness and the brevity of tonight's update. After two doctor's visits and an MRI earlier this week, I found out that I have a herniated disk...and will have to have surgery in two weeks. The pain has been excruciating and relentless...and the pain medication is fogging up my brain. The only relief I get is laying flat on my back on the floor. The DJIA has now moved above the lower bollinger band, as I expected, on the weekly chart...and, at some point, is likely to retrace part of this week's gain to retest it from above. When that happens, it should provide an important signal to go long. I mentioned the 10200-300 area over the past two weeks as a resistance point for a rally. I am not sure yet whether we rally there first and then test the lower weekly bollinger band or vice versa. Hopefully, I will be able to think more clearly in the next few days...and I will provide additional information as soon as I am able. |
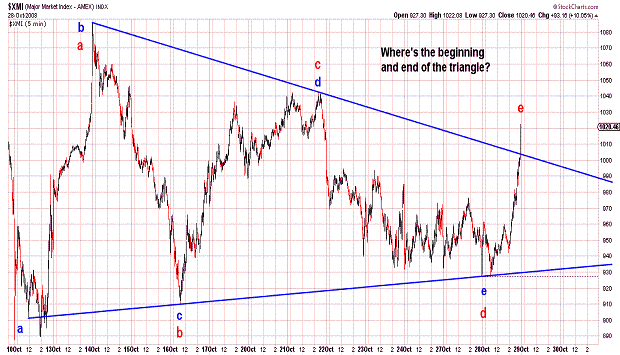
| October 28, 2008 update...Last Friday, I suggested that this week should be an up week. After a poor start on Monday, the DJIA is now up almost 700 points for the week at 9065. If the DJIA continues to rally from here (exceeding 9284), the next target should be the resistance area I had discussed in the past few updates around 10200-300. If, however, the DJIA weakens and closes the week below 8852, it is likely that the DJIA has completed the "d" wave of a triangle...and a final "e" wave decline will follow next week to finish the a-b-c pattern from the April-May high. The DJIA has now rallied from beneath to above the lower Bollinger Band on the weekly chart. Typically, when this rally concludes, there will be a decline and a retest of that band. As a final note, there is one bearish interpretation of today's rally...and can been seen on the XMI chart above. The red letters represent a wave count for the triangle pattern in the reverse direction, i.e., today's rally completed the triangle's "e" wave...and a final thrust to the downside should now begin. |

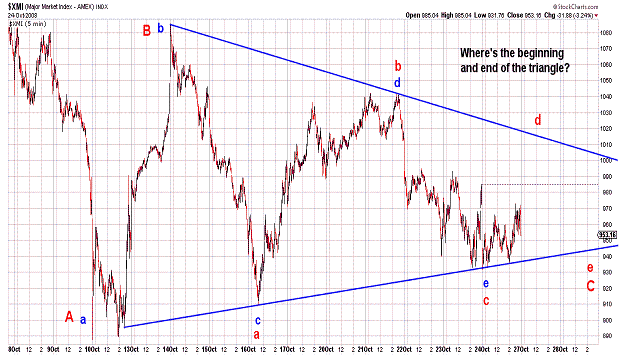
| October 24, 2008 update...With the index futures limit down, it was nasty at the open this morning...but, then, for most of the day, a substantial rebound developed,,,and finally, in the last 7 minutes before the close, a nasty 200 point selloff occurred. Today's action, as well as the action of the past 2 weeks, is typical of ending triangle patterns, i.e., volatile back and forth action. The only question is whether today's action completed wave "e" of the triangle, or just wave "c"...and that depends on where the triangle started. The chart of the XMI above shows the two possibilites. If the triangle is complete, the next rally should be extremely powerful. If the next rally is weak and cannot push through the triangle's upper boundary line, wave "d" is unfolding...and wave "e" will follow. The completion of the triangle will also complete the larger a-b-c pattern from the April-May highs. A rally to the 10200-300 area should follow. If the October 10th intraday low is THE low for PRIMARY wave C, the next wave will be wave 2 of an even larger diagonal triangle (with a rising bottom). See wavechart.com/diagonaltriangle.htm for an example. If the final low has not been made, there could be one more a-b-c pattern to follow. Personally, I belive that a low is more likely in 2008, given the Fibonacci time intervals discussed in a previous update. In any event, I think next week should be an up week. If the DJIA closes the week below 8852, it is likely that only wave "d" of the triangle has unfolded...and wave "e" will follow the next week. |
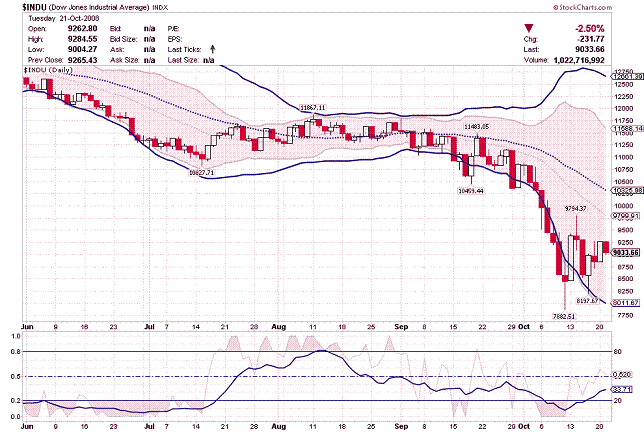
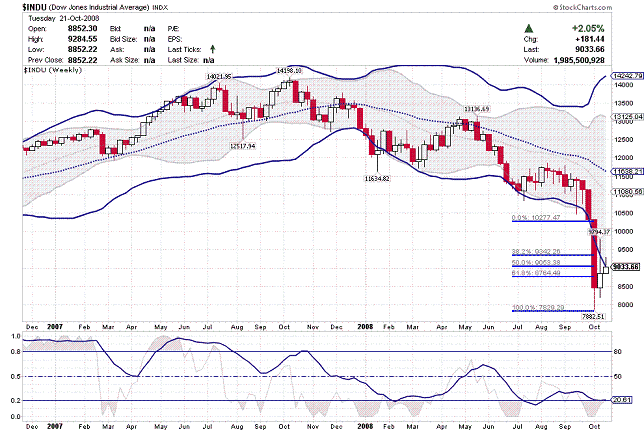
| October 21, 2008 update...Since the DJIA's intraday low on October 10th, I have expected a "three-wave" rally to the 38.2 percent retracement point of the DJIA's decline from its October 2007 high. As you can see in the chart above, there is also an important trend line at that level...around 10300...which should now act as resistance. While the pattern of the rise is not absolutely clear...its does appear, so far, to have an a-b-c appearance, i.e., there was an initial rally to 9794 (wave a), a retest of the low at 8197 (wave b), and now another bounce higher (wave c?). While the Elliott wave pattern is not crystal clear, there is a common pattern that arises with Bollinger Bands. The daily chart shows how the DJIA crashed below the lower band, rallied above it and then retested it before again moving higher. If the same pattern develops on the weekly chart, the DJIA will rally above the lower band (usually by the same distance it was below the band) before a retest. That distance on the weekly chart would suggest a rally to the 10200-300 area. We'll see. |
| October 17, 2008 update...On Tuesday, I said I would address the longer term wave count today. Volatility is typical at important tops and bottoms...and we are certainly witnessing it now. If the market continues to recover next week, I think it is possible that we have seen the DJIA's price low for years to come (if not, it is certainly the momentum low). It is not, however, the end of PRIMARY wave C...because it needs to complete a 5 wave pattern. The OEX chart above demonstrates one way this can be accomplished. The decline from the October 2007 high until last week's low may be the first wave of a diagonal triangle pattern. If that is the case, we still have to trace out waves 2, 3, 4 and 5...and that should take us well into 2009 to achieve. Once PRIMARY wave C (and CYCLE wave B) is complete, CYCLE wave C will begin. CYCLE wave C will be the final wave of the current SUPERCYCLE. Given the various time relationships within the SUPERCYCLE wave, it is likely that it will last until 2016. Pricewise, it may seem laughable now with the current market in turmoil, but 8 years from now we could see the DJIA at 37484 or even 60650. Why? Because the gain in the next CYCLE wave C should have a mathematical relationship (1:1 or a Fibonacci multiple) to the first CYCLE wave A. CYCLE wave A rallied from 40.56 to 195.59, a multiple of 4.822x. If the recent low holds for PRIMARY wave C, then 7773.71 x 4.822 = 37484...4.822 x 1.618 x 7773.71 = 60650. These numbers do seem incredible now, but the percentage gains are not unusual for CYCLE wave bull markets...especially bull markets that follow bear market flat patterns (flat corrective patterns imply great strength in the succeeding wave). The United States, its economy and the stock market have undergone turbulence and great difficulty many times during the current SUPERCYCLE, but they have always managed to rebound. I don't think this time will be any different. The time to worry will be when the SUPERCYCLE comes to an end. (November 21, 2008 supplement...With today's new intraday low the calculations are slightly revised as follows: 7392.27 x 4.822 = 35646...4.822 x 1.618 x 7392.27 = 57674.) |
| October 14, 2008 update...Volatile oscillation in the market is now the name of the game...and it will take time for it to wind down. Today, the DJIA opened 400 points higher...then slid 700 points during the day...and finally recovered over 200 points into the close. At today's low the DJIA had retraced a Fibonacci 38.2 percent of the rally from Friday's intraday low. Going forward...as the market decompresses from last week's "crash"...support and resistance levels are very likely to coincide with the Fibonacci retracement levels of 38.2 percent and 61.8 percent. Currently, I think the DJIA is likely to meet strong resistance around the 10300 area. Not only does this area contain the previous trendchannel support line (now resistance), but it is the 38.2 percent retracement point of the entire decline from the the October 2007 high. I'll address the longer term wave count on Friday. |
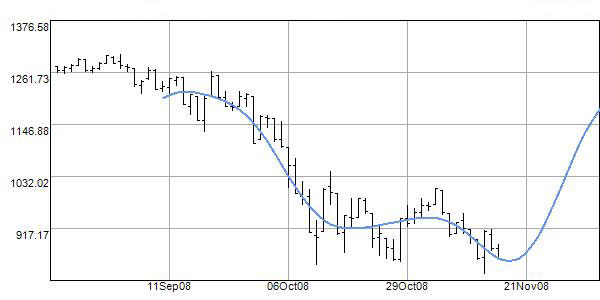
October 10, 2008 update...(See the pre-close comment below.) Today's volatile action would seem to coincide with the completion of the diagonal triangle pattern discussed earlier this week. Confirmation of the completion of this week's "crash" pattern will occur if the market rallies next week. Since the crash pattern began when it penetrated the support line at 10325, a retracement rally to that point (or, at least, that area) should occur in the days (and possibly weeks) to come. That area would also be the Fibonacci 38.2 percent retracement point of the entire decline from the October 2007 high (.382 retracements are very common after sharp rallies or declines).
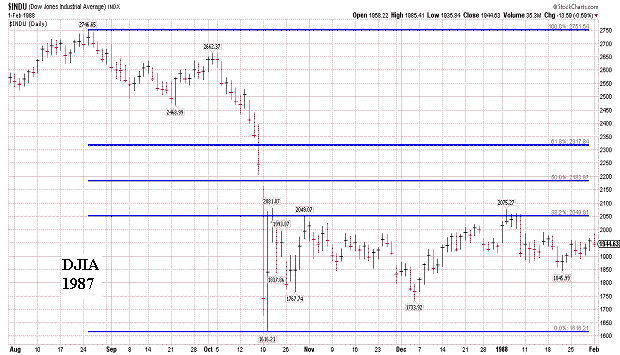
If the market does indeed rally from here, it is likely that we have seen the low for the year (and probably for years to come...2008 is an important Fibonacci year, i.e., 1919+89, 1953+55, 1974+34, 1987+21, 2000+8). As I mentioned in my pre-close comment, given the size of the decline from the October high, my original July 2007 label for this decline as PRIMARY wave C of a flat pattern would seem to make the most sense. From the October 2007 high, the DJIA has declined in a-b-c-x-a-b-c fashion. At today's low, it touched the bottom of the trendchannel shown in the above chart. Since the "c" wave of a flat should contain 5 waves, it is likely that the decline from the October 2007 is not complete...and a failed 5th wave (see 1987 crash)...or a diagonal triangle possibility may develop. Look at the action following the crash in 1987 for an idea of what might transpire in the weeks to come (the day after the crash, the DJIA retraced a Fibonacci 38.2 percent of the decline from the August 1987 high). |
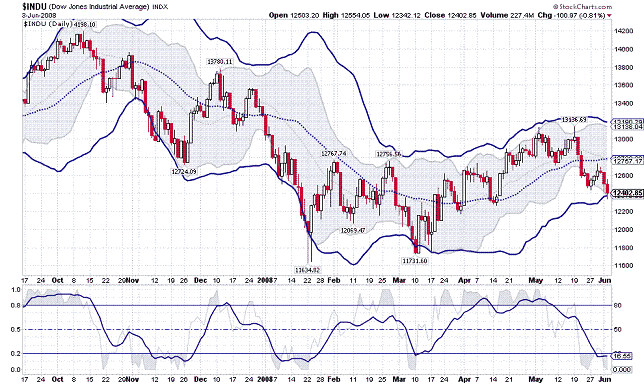
October 10, 2008 pre-close update...On July 20, 2007 I posted the following update (click here for archive): "All signs now suggest that the Bull Market rally from the 2002-2003 lows is OVER!!! ...(T)his past Monday, (I) indicated that a final intraday high for the DJIA was likely on Tuesday...July 17th. In fact, the DJIA did peak at 14021.95 that day (which was 144 Fibonacci days from the February 20th top at 12795.93). PRIMARY wave (C) should now be underway. At a minimum, the DJIA is likely to retrace all of the gains of the past three years (emphasis added)." See chart above suggesting flat pattern for CYCLE wave (B).
When the DJIA made a new high in October, I changed my primary wave count to a CYCLE wave (C) diagonal triangle. Obviously, with hindsight, I should have stayed with my initial wave count. The DJIA has now declined to the bottom of the trendchannel in the chart...which is exactly what I expected at the time for PRIMARY wave C. |
| October 9, 2008 comment...Here is a chart of the diagonal triangle pattern in the DJIA that I mentioned yesterday. The 5 waves of the triangle look virtually complete. If this is indeed a diagonal triangle pattern, a retracement rally back to its origin around 10800 should begin shortly. |
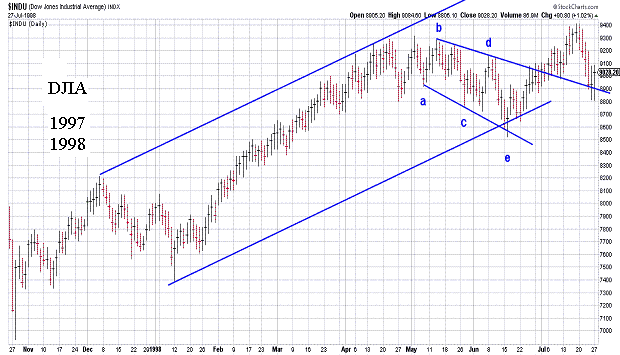
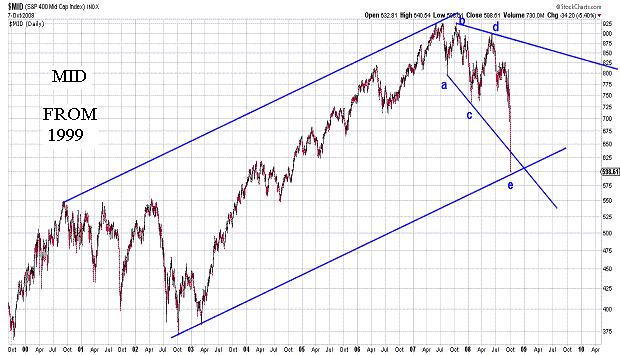
| October 7, 2008 update...After the opening rally today, the market spent the rest of the day retracing all of yesterday's last hour bounce. Under normal circumstance, as you can see from the charts above, the stock market should be ready for a good rally. But, are these NORMAL circumstaces? Given the fundamentals, you would think no one in his right mind should be investing in this market. But isn't it true that, over the long term, that's the best time to invest? If you look at charts over any time period going back to the beginning of the last century, market patterns and market indicators give similar signals. And, the signals now say a significant bottom should be forming. It may not be the final bottom of this BEAR MARKET...but, nevertheless, it should be at least an intermediate term bottom. As for the Elliott wave count and the extent of the next rally...the indices are in somewhat of a conflict. Some point to a (possibly) huge rally (see the comparison of the triangle patterns in the 1997-1998 DJIA chart and the 1999-present MID chart)...others point to a rally back to the previous consolidation area (DJIA 10800-11800). The only thing to do is to monitor the strength or weakness of the rally in each indice as it unfolds. I'll have more to say at the end of the week. (By the way, the last chart shows signficant parallel trendlines converging around today's low on a semilog scale chart). |
| October 3, 2008 update...The old axiom about "selling the news" certainly applied today. A 300 point gain in the DJIA before the House of Representatives voted today turned into a 157 point loss by the close. Here is a list of positive factors supporting a reversal to the upside next week: (1) the alignment of the weekly closing chart (see last week's discussion), (2) the DJIA and other indices are at their trendchannel support lines, (3) in terms of price, wave a of 1 and wave c of 3 are nearly equal in length, (4) in terms of time, wave c of 2 and wave c of 3 are each 38 trading days, (5) the 35 1/2 day cycle turn date, (6) the 62 week (+/- 1) cycle turn date, (7) bullish divergences in various overbought/oversold indicators, (8) broad market indices are at their lower bollinger bands on daily and weekly charts, (9) extreme level of the VIX. Neutral or negative factors: (1) sentiment indicators are not at extreme levels, (2) failure to hold current support line could lead to "crash type" selloff. In any event, next week's action should help determine the market's direction for the next few months. |

| September 29, 2008 update...Today, the Congress acted (or, rather failed to act)...and the markets reacted! On Friday I said, "...if the DJIA declines through Wednesday's low, the market may have to deal with another test of the recent lows." That is what happened today. Now, that the DJIA is back at the lows, the weekly closing chart will have a chance to align itself with the daily closing chart. (See last Friday's discussion.) There are four trading days remaining this week...and they are likely to be volatile (while the market awaits another vote by the Congress to deal with the current financial mess). If past history is a guide, days like today (and weeks like this one)...where there is mass panic and crash-type action...are followed within a short period of time by powerful countertrend rebounds. In terms of the long term Elliott wave pattern, the DJIA is at the bottom of its PRIMARY wave 2 trendchannel...but, has waves 4 and 5 of (c) yet to be completed. Before PRIMARY wave 2 is over, the DJIA is likely to retrace 61.8 percent of PRIMARY wave 1...which would take it to the 9900-10000 area. |
| September 26, 2008 update...In the very short term, it is apparent that fundamental events (you know what I mean) have taken over the market's Elliott wave pattern. Form here, the market could go up or down and the Elliott wave pattern would confirm it. When this happens, it is best to focus on support and resistance levels (although, in the present case, they are quite wide). A strong rally next week through resistance (see chart) would confirm that wave "c" of 4 is underway. On the other hand, if the DJIA declines through Wednesday's low, the market may have to deal with another test of the recent lows. An examination of the weekly closing chart indicates that the DJIA has not closed the week below the July 11th closing low. This contrasts with the high-low-close chart which shows a lower low last week. Closing charts and H-L-C charts usually align...but, not always. Therein lies the dilemma. Will the charts align or not? A rally through last week's high would suggest that they will not...a decline next week will suggest that they might. We'll see! |
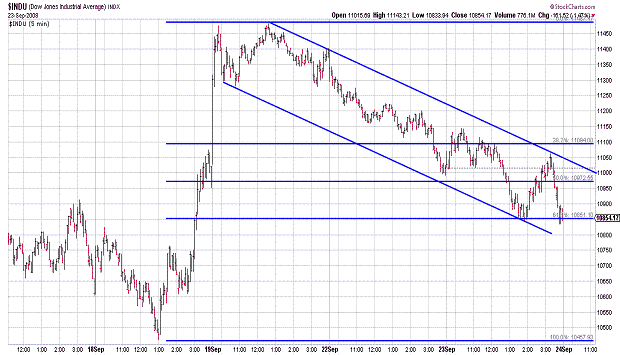
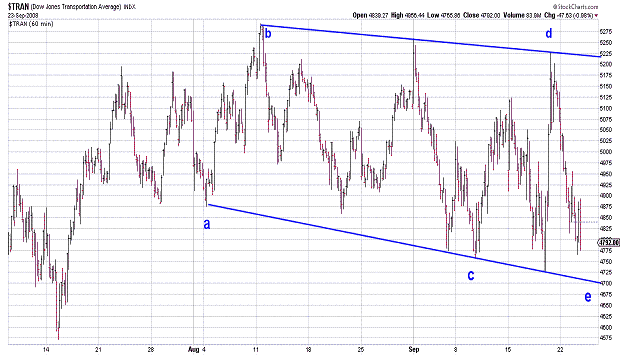
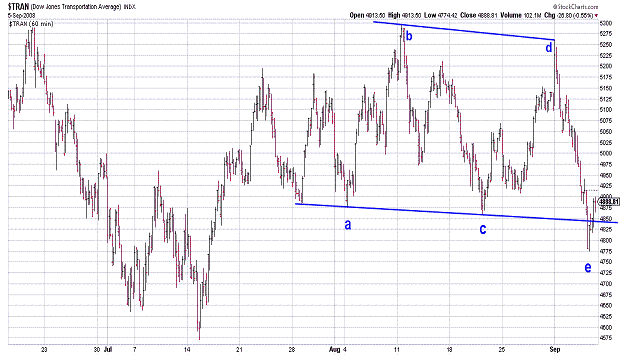
| September 23, 2008 update...40 minutes before the close, the DJIA was up about 45 points, having recovered from a 175 loss 90 minutes earlier. Then, news from the Senate cast doubt on the bailout plan...and the DJIA plumeted backed to its earlier low. The DJIA closed near the Fibonacci 62 percent retracement point of the rally from last Thursday-Friday. If last Thursday's low was indeed the end of wave 3 of (c) of PRIMARY wave 2, then today's low is the area where a wave b or wave 2 retracement would end. We'll see! Technically, today's low was near the lower bollinger band on the DJIA's daily chart...which is a typical support area following a rally from beneath the band. Take a look at the Dow Jones Transportation Average chart. It again appears to be nearing the end of a horizontal triangle pattern. If so, the next rally should be a sharp thrust higher. |
September 19, 2008 update...Usually, I hate to see the trading week end. But, this week...TGIF! Emotionally, this was a VERY draining week. Last Friday, I said that the recent decline was a triangle pattern...and that the rally that follows "should be powerful." On Tuesday, I said that "a close on Friday above 11220 would be a good sign" that a bottom is confirmed. On Wednesday, I said that "a bottom should be near" and that a "snap back rally usually follows" these types of bottom patterns. Even though these Elliott wave predictions turned out to be correct this past week, I realize that Elliott wave analysis can only provide probabilities...not certitudes. One's emotions are tested whenever the market makes dramatic reversals as it did this week. But, there is no doubt in my mind that looking at Elliott wave and technical charts gives one confidence in the face of massive fear (or greed). This helped me to keep scaling into long positions as the market declined 500 and 400 points this week. And then, not wanting to be greedy, lightening up a bit today. I have learned the hard way that the right trading strategy will almost always bail you out of the inevitable inaccurate market call.
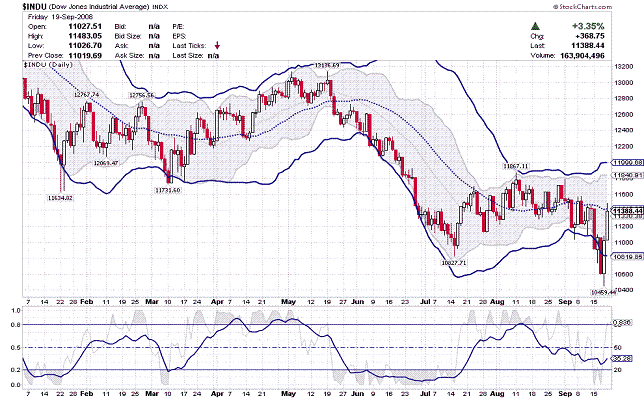
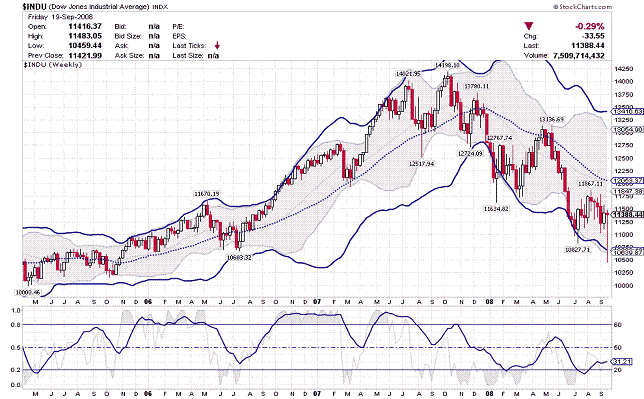
This week I posted several alternate wave counts...some suggesting that we reached a long term bottom...others suggesting otherwise. It seems clear to me that we completed a wave from the May high to yesterday's low. My personal opinion, however, is that we have not yet seen a PRIMARY wave 2 bottom (but I am open to other possibilities as the market traces out its next wave). Since Primary wave 2 has begun the upper bollinger bands on both the daily and weekly charts have exerted tremendous resistance. I intend to watch these levels as the market rallies from here. Current levels are 11841 and 12000 on the daily chart...and 13055 and 13417 on the weekly chart (note: I use two different sets of parameters for my bollinger band calculations). Now, I intend to try and relax for a few days! |
| September 17, 2008 update...Earlier in the day I posted on the message board that if the DJIA broke below a certain trendchannel, it was likely to close at 10600...it did and that's right about where the DJIA closed. If the DJIA now declines to intraday support tomorrow, watch the 10400 area. I updated the 1990 vs 2007-8 comparison charts...which MAY indicate that PRIMARY wave 2 is ending. Some subscribers had asked me whether the July-August rally was wave 4 of the pattern...and the recent decline was wave 5. I didn't think so...but, this chart comparison does suggest that it is a POSSIBILITY (though IMO not a probability). Whether it is or not will depend on the character of the next rally. We may know only in hindsight that it was...because the DJIA has to rally above 13136 (without an intervening new low) to validate the count. And, that it is a good distance away. Many of the indices have declined below their lower Bollinger bands on the daily charts...to the lower bands on the weekly charts. Snap back rallies usually follow such occurences. Given that sentiment indicators are also now at reversal levels, (timewise) a bottom should be near. |
| September 15, 2008 update...From the opening bell today, it was apparent that the wave 4 flat (3-3-5) pattern was the operative count. As I showed on the flat pattern chart on Friday, wave b of the pattern was tracing out a contracting horizonal triangle. The only issue on Friday was whether wave d of the pattern was still unfolding...or whether wave e was already underway. That question was answered over the weekend when the news about Lehman's bankruptcy was announced. At today's close, the DJIA was just above the triangle's lower boundary line. A strong reversal from that line and a positive close should indicate that wave b is complete and wave c has begun. Because b was a triangle, Wave c of 4 should be powerful...and should exceed the August 11th high. Anything other than that would mean that some other corrective pattern is unfolding for wave 4...for example, a horizontal triangle. |
September 12, 2008 update...The market has shown resilience the past two days...opening sharply lower and then recovering. Is this a hint that the bears can't keep the market down...and it now wants to go higher? The Bank and Financial Sector Indices are, I believe, an indication of this. With all of the bearish news about stocks in these sectors during the past few days, I think it is a bullish sign that these indices have held up as well as they have since their mid July lows.
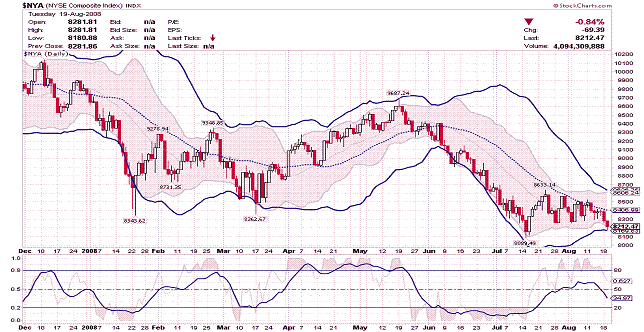
In the charts above, I have shown the most apparent wave counts that presently exist for wave 4 of (c) of PRIMARY wave 2. Before wave 4 is complete I think there is likely to be a powerful rally. If you look at the chart of the NYSE composite, you can see that there have been a series of three wave patterns between the declining channel lines since PRIMARY wave 2 began. We are due for a trip back to the top. It is just not clear yet how it will be accomplished. |
| September 9, 2008 update...What the market giveth...it taketh away. After a two daily roller coaster ride, the DJIA has netted a grand total of 10 points. And, despite yesterday's big rally, many of the other market indices are now down for the week. As I have indicated for weeks, the DJIA is unfolding in a series of three wave patterns. The most recent up/down pattern is no exception. The charts above show how difficult it has been to discern the near term pattern because of the numerous valid wave count possibilites that are in play. Given the deeply oversold condition of many of the indices, a signficant rally should soon begin. But, given the DJIA's pattern, a further near term selloff cannot yet be eliminated...especially in light of the seasonal weakness. As I noted on Friday, the sentiment indicators had not yet reached a level that pointed to a rally...but, in the past two days, they have begun to move in that direction. When the Elliott wave patterns get confusing, as they currently are, I tend to rely more on technical overbought/oversold indicators and bollinger bands. They suggest we are at or near a bottom, or at the worst, a series of bottoms. |
September 5, 2008 update...The unfolding wave 4 pattern that began on July 15th declined to critical support today and held. Here are some things I observed today: (1) since the August 11th high, the DJIA has declined in a series of three wave (a-b-c) patterns...suggesting that the decline is a CORRECTIVE pattern (an "x" wave...or possibly the "b" wave of a wave 4 triangle), (2) the decline from the September 2nd high was three waves and is complete (it is complete because today's afternoon rally broke through the wave's trendchannel resistance line), (3) the rally from today's low must continue through 12300-400 to eliminate the possibility that the decline from the August 11th high is a subwave of a larger declining wave, (4) many of the major indices, including the DJIA, traced out key reversal patterns today, (5) most of the broad indices declined to or through their lower bollinger bands today and reversed, (6) there was an important bullish divergence in the weaker NYA index today, (7) the NDX declined to important trendline support today (and MUST hold to avoid a much larger decline), (8) while most of the broader market indices were down for the week, the Banking and Financial Sector indices (which have lead the market since the July 15th low) were up, (9) the Dow Jones Transportation Average appears to have completed a horizontal triangle pattern...and, if such is indeed the case, should now thrust higher.
While the risk of a larger decline from here is certainly possible, I still view the market's action within the context of a wave 4 pattern. I have been asked whether the DJIA can decline below the July 15th low and still be in wave 4. The answer is yes...the DJIA could be tracing out a flat for wave 4...where wave "b" of 4 retraces all or more of wave "a". On balance, with the exception of the sentiment indicators, the weight of the technical indicators and Elliott wave pattern point to a rally from here. If, however, the market experiences further weakness next week, I may have to change my mind. Remember, the market does typically encounter weakness during the September/October time period. |
| September 3, 2008 update...The contracting horizontal triangle pattern discussed in last Friday's update is still valid...and will continue to be as long as the DJIA does not decline below 11290 in the coming days. Today, the DJIA reached the target area around 11400 for wave "e" of the triangle...however, in terms of time, it probably needs more development. A weak rally or decline tomorrow will indicate that wave "e" is still subdividing. On the other hand, an explosive rally through 11700 would suggest that the triangle is complete and a thrust above the August 11th high is underway. |
| August 29, 2008 update...If you like an oscillating market and swing trading, I guess you have been happy with the action of the stock market since wave 4 began at the July 15th low. Over the past month, there has been a series of 3-wave swings in the DJIA...with an everchanging number of possbile wave count alternatives developing as wave 4 has unfolded. When this type of back and forth action occurs, there is often a triangle pattern in the mix. The chart above suggests one such possible triangle pattern. If I have correctly labeled the pattern, the DJIA is tracing out the final "e" wave of a triangle that should end next week around 11400 or so. (A decline below 11290 would negate the pattern.) Once the triangle is complete, a thrust would follow...in this case, of around 600 - 700 points (the distance of the widest part of the triangle). Assuming the thrust does occur, there would be a final down/up pattern that follows to complete wave 4. With a 62 week cycle turn date coming in the latter part of Septermber, it is possible that price, pattern and time will converge at that point. |
| August 26, 2008 update...I apologize for the ambiguity of this update, but, unfortunately, the state of the DJIA's current Elliott wave pattern is ambiguous. Friday's intraday high of 11632 is the critical level to watch. A weak rally from here that fails at that level would suggest that the DJIA is likely tracing out a double zigzag from the August 11th high...with another decline to follow. A strong rally that breaks through Friday's high would suggest that the next phase of wave 4 is likely underway (although there are several alternate possibilities if the rally fails to exceed 11867). Hopefully, the pattern will clear up in the coming days. |
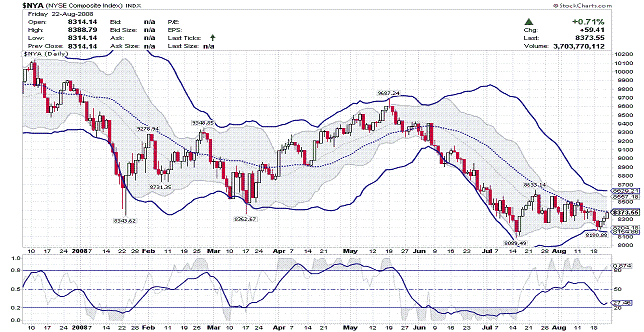
| August 22, 2008 update...I decided to post an update of the three charts shown in Tuesday's update...to illustrate how technical analysis alone can signal a market reversal. The DJIA, NDX and NYA all reversed and rallied after reaching areas of trendline, moving average, bollinger band, and/or technical indicator support. With respect to Elliott wave analysis, the DJIA has now retraced a Fibonacci 61.8 percent of its recent 6 day decline. If my "x" wave label is correct, the DJIA must continue to rally next week beyond the August 11th high of 11867...tracing out another a-b-c pattern. On the other hand, a significant decline next week would throw into doubt the "x" wave label...and trigger several alternate count possibilites. |
| August 19, 2008 update...The DJIA declined to the bottom of its wave 4 trendchannel today...and is sitting on important support. Corrective waves, like the current 4th wave, are subject to great variability (in pattern) as they unfold...they can be zigzags, flats, triangles, double zigzags, double combinations, triple combinations, etc. Given the size of wave 2 of (c) of PRIMARY wave 2, I still think that wave 4 is unfolding...but, at this point, since only part of the pattern has developed...it can be counted in a variety of ways. Since the August 11th high, the DJIA has declined in three waves. If this three wave pattern ends here, I think it can best be counted as an "x" wave...and, at least, one more a-b-c pattern should follow. There are other possibilies, of course, should the DJIA decline further in the next few days. One of the reasons, however, that I think the DJIA may hold in this area is suggested by examining a technical chart of the NYA. It has been one of the weaker indices since the wave 3 low...but, today the NYA declined to its lower bollinger bands...which have contracted in recent weeks as volatility in the markets has dissipated. An indice will typically reverse at this point (or shortly thereafter). |
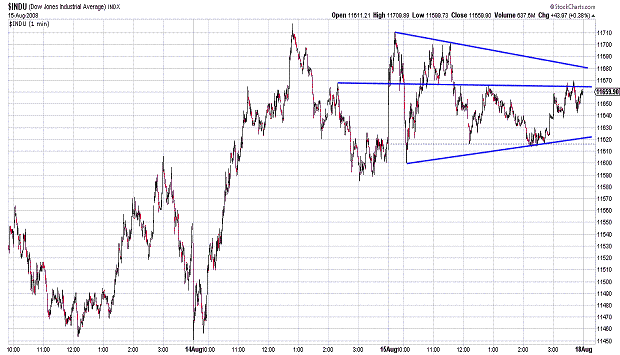
August 15, 2008 update...Today was option expiration day...and rather than produce volatility, it left the market in a state of utter bordom and inaction. Since midday yesterday, the DJIA has traced out a series of rising and declining three wave patterns. Technical analysts would probably describe the pattern as a "pennant" (see chart above)...which suggests a continuation of the previous trend once the pattern is complete. In Elliott wave terms, the pattern looks like a double three combination pattern, i.e, a-b-c-x-a-b-c (-d-e). It is possible that the contracting sideways pattern could continue for a time when trading resumes next week...but, a breakout above 11700 would indicate that the upward trend from yesterday's low has resumed. A decline below 11580 would suggest that something else is going on. As for the 71 day cycle reversal on Wednesday...so far so good. If the cycle date is meaningful, the two day old rally in the DJIA should accelerate next week.
On July 26th, I said: "I expect there to be major divergences between the various indices as we go forward from here." That has indeed been the case. Today, the RUT made a new recovery intraday high above its June high...the NDX is not too far behind. At the other extreme, the NYA has languished...and some international (and foreign) stock market indices have declined below their July lows. Notice where the 200 day moving average is in the above charts...no wonder there is so much confusion and disagreement about the market's near term path. I continue to believe that a wave 4 countertrend rally is still unfolding. |
August 12, 2008 update...At yesterday's high, a number of indices breached their upper bollinger band (see daily charts of DJIA, SPX, NDX, RUT). In an uptrend, a MINOR pullback is a common result, especially when there is an absence of technical divergences. When negative divergences are present, a more signifcant reversal is likely. To date, technical indicators that I use, like Wilder's relative strength, moving average oscillators, rate of change, etc. have supported the rally from the July 15th low with higher highs and higher lows.
As you know, over the past several weeks, I have commented on a 71 day cycle running through PRIMARY wave 2. Tomorrow is the 71st trading day since the May 2nd high. If the DJIA closes lower tomorrow, I think it could turn out to be a significant low. On the hand, a higher close tomorrow would most likely prove to be ambiguous. An examination of the DJIA's pattern after tomorrow's close would be required to determine the significance, if any, of such a high. Unfortunately, it has often been my experience after finding a repeating cycle that it will fail to work the next time it occurs. My focus on tomorrow's date could turn out to have been a complete waste of time. But, we'll see!
Finally, take a look at the DJIA - Daily Point and Figure chart. A rally above yesterday's high would be a breakout on this type of chart. |
| August 8, 2008 update...After a sharp 3 wave correction yesterday, the DJIA resumed its wave c of 4 rally today. Wave c appears to be subdividing into a series of three wave patterns...suggesting that it is (possibly) tracing out a "c" wave type diagonal triangle (click here and take a look at the last diagonal triangle example). The DJIA appears to be in the middle of wave 3 of c of 4 and should continue higher next week. Given the stage of development of this wave, it currently appears unlikely that its Elliott wave pattern will be complete by the upcoming August 13th cycle date. We'll just have to wait and see three trading sessions from now whether or not that date turns out to be a major or minor (or n/a) turning point. |
| August 5, 2008 update...Last night I suggested that a "good rally" was likely...and boy did we get one today! And, if wave 4 stays on target for an August 13th completion date (the perfect charting scenario described in the last update), this rally will continue. Of course, there is no guarantee that things will work out exactly that way! Other patterns are possible as well...so, you have to watch for any signs of weakness before August 13th...particularly a wave iv pull back before a final wave 4 top. |
| August 2, 2008 update...The DJIA ended the week on a weak note...netting a 44 point loss over the 5 days. The current pattern allows for both bullish and bearish near term outcomes. Either we are completing wave 2 of c of 4 (bullish) or are still tracing out wave b of 4 (bearish). A strong rally on Monday would suggest the former is correct, a nominal rally or decline would tilt the odds in favor of the latter. In the second chart above, I indicate what is possible if price, pattern and time align perfectly over the next week and a half. Unfortunately, perfect charting scenarios rarely work out. So, we will just have to wait and see what actually develops...a perfect 4th wave or something else! |
| July 29, 2008 update...The DJIA appears to have completed wave "b" of 4 after bouncing off of the wave 3 trendchannel resistance line. Assuming wave "b" is complete, wave "c" of 4 should work its way higher in the coming weeks. The bottom of wave 2's trendchannel is a resistance point where I think wave 4 (or, alternatively, the first part of it) is likely to conclude. Please mark August 13th on your calendar. I pointed out in the July 11th update that a 71 day cycle has been unfolding throughout PRIMARY wave 2...and the next cycle date is August 13th...just 11 trading days from now. We'll have to wait to see, however, if the market's price and pattern characteristics align with time on that date. |
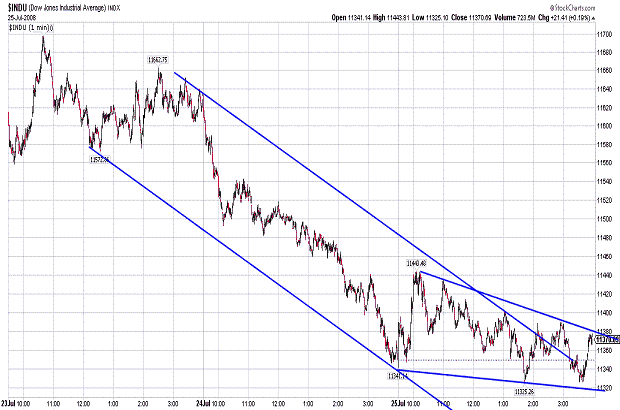
| July 26, 2008 update...The DJIA is tracing out wave 4 of (c) of PRIMARY wave 2. Since Wednesday's high, the DJIA has been tracing out a "b" wave pattern. As you can see on the DJIA's one minute chart, it needs to break out above of what appears to be an ending diagonal triangle. Once it does, wave c will be underway. A likely objective for this wave is the Fibonacci .618 retracement point of wave 3, i.e. 12250. There is wave 2 trendchannel resistance around this level as well. So, at least for now, that is the level that has my attention (as for time, it's August 13th). I am not sure yet whether wave 4 will end there...or just the first part of it (for the DJIA). I expect there to be major divergences between the various indices as we go forward from here. |
| July 22, 2008 update...I have to leave shortly for a music gig...so this update will be brief. Last Tuesday, I said: "...if I correctly labeled the waves for the final "c" wave of the decline, this market should "explode" to the upside..." So far, so good. In just five days, the DJIA has rallied 640 points...and it should continue to move higher in the coming weeks. The next area of resistance and a potential area of consolidation is the previous consolidation area around 11800-900 (above that is stronger resistance around 12200). It looks like the value stocks (banks, financials) have been leading the way during this initial surge. I think the growth and technology stocks will probably start to perform during the second phase of the rally. |
July 18, 2008 update...What a difference a week makes! In just three days, the DJIA rallied over 500 points...blowing through 12 days of declines dating back to June 26th. If you were smart enough to invest all of your funds in a bank sector fund on Tuesday, you could relax for the rest of the year with an approximate 50 percent return.
Wave 4 is now underway...having broken through the wave 3 trendchannel resistance line today. Last Friday, I pointed out on the message board that the RUT and MID closed up for the week. The reversals in those indices turned out to be predictive of forthcoming reversals in other (more broad based) indices this week. I expect wave 4 to include some powerful rallies in the coming days and weeks. I hesitate after just 3 days to target any price or time objectives for wave 4. It needs more time to develop and reveal its patttern. But I will, at least, say this: wave 3 lasted 50 days...I think wave 4 will unfold over a much shorter period of time. |
| July 15, 2008 update...Happy at 3:00,,,frustrated at 4:00. The market did everything it was supposed to do today, except close higher. The charts would have looked great today if we closed at the high...right on wave c's trendchannel resistance line. Instead, the DJIA gave back 150 points in the last hour. This much seems clear to me. The DJIA needs to break through today's high to get the wave 4 fireworks underway. If I correctly labeled the waves for the final "c" wave of the decline, this market should "explode" to the upside in the coming weeks. Of course, this is partly wishful thinking, but that's what should happen after a i-ii-iii-iv-v type c wave diagonal triangle is complete. I think the NDX pattern confirms this as well...it looks like the pattern from its June 5th high is now complete...a-b-c-x-a-b-c-x-a-b-c. |
| July 11, 2008 update...Emotionally, today was a difficult day. The market gapped down at the open and continued lower for the next several hours. But, just after 1:00 pm, the DJIA made its low for the day. For the next two hours it rallied until it reached positive territory...and then in the final hour it suffered a Fibonacci 62 percent retracement. Although it seemed worse, at the close the DJIA was down only 47 points from Wednesday's close. So, now with an alignment of a large number of positive signs (indicators, cycles, trendlines, etc.) the market should start to rally next week. If it fails to do so, there must be some other overriding influence that I do not currently see. But, that would not be surprising in light of my diffculty in calling a wave 3 bottom during the past few weeks. Hopefully, over the weekend, the above charts will provide some comfort. |
| July 9, 2008 update...More often than not it's better to use your brain and excercise caution than listen to your gut. My gut thought a bottom was in place (it was wrong). But logically, I thought it was possible that yesterday's rally was only the 4th wave of a diagonal triangle bottom pattern...and I reduced my long position accordingly. When the DJIA failed to exceed 11434 today and weakened, it became clear that the 5th wave of the triangle was underway. We closed today just below the hourly low of the triangle's 3rd wave. Now, if the DJIA makes a lower low tomorrow and closes higher, i.e. a key reversal pattern...the stage will be set for the initial thrust higher of the larger degree 4th wave pattern from the October high (wave (c)). Today's low, as distinquished from previous lows over the past week or so, was accompanied by bullish divergences among a variety of indicators. While the DJIA, OEX and S&P 500 experienced new closing lows today, other indices, i.e., NDX, RUT, MID, did not. These indices may just be tracing out wave 2 pullbacks after yesterday's powerful rally. |
| July 7, 2008 update...The DJIA's intraday low today was lower than Friday's low...but, the DJIA still closed above last Thursday's closing low. The DJIA's declining trendchannel support line has held each intraday decline for the past week...and appears to have formed a diagonal triangle bottom. If it is complete, we should see a surge to the top of the channel...which is currently around 11750. This type of action will confirm that wave 4 is underway. |
| July 1, 2008 update...Today's action had all of the telltale signs of an important reversal: (1) a key reversal pattern on the daily chart, and (2) an intraday double bottom pattern with the second low slightly piercing wave 3's trendchannel support line. With the 35 1/2 day cycle turning higher yesterday, it is likely that a wave 4 rally has begun. Wave 4 rallies are typically quite vertical as you can see in the chart above during 2002. To confirm the pattern is in progress, the DJIA should quickly rally to the top of wave 3's trendchannel...and then break above it. With light trading volume likely prior to the July 4th holiday, we'll see if there are enough buyers around to get it done (or at least started). |
| June 28, 2008 weekend supplement...Here are two charts to ponder over the weekend. Is the DJIA still tracing out a diagonal triangle pattern from the October high? |
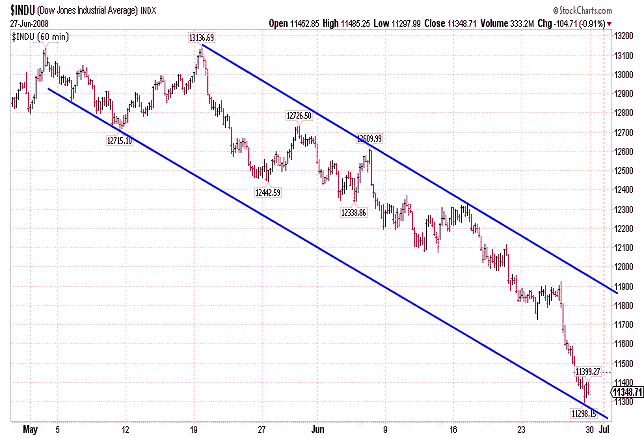
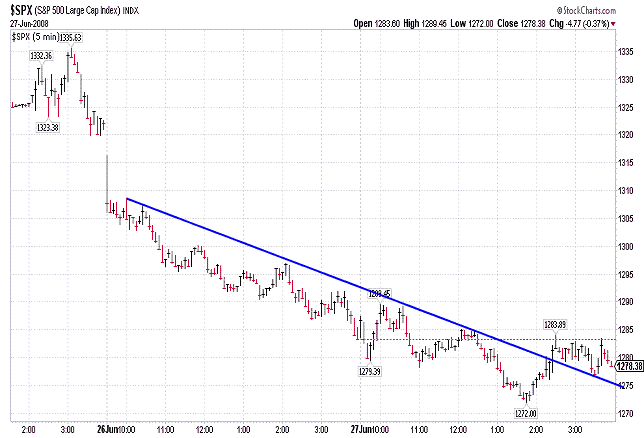
| June 27, 2008 update...Today's action was inconclusive. The DJIA was weak and closed down over 100 points...but, the NDX had a key reversal day with its positve close (only .33, but it counts). Note on the charts above that: (1) the DJIA (60 minute chart) touched the bottom of its parallel trendchannel (it is generally the terminal point in an Elliott wave pattern),and (2) the S&P 500 (5 minute chart) broke above a very short term resistance line and held above it on a retest. The decline from the top is clearly three waves (corrective). The only question is whether it is over...or whether there is a more complex bottoming pattern yet to come. Confirmation of a reversal (if it happens) should come with a positive weekly close next Friday. There are massive divergences between the various indices. The DJIA (see chart above), OEX and XMI (see chart above) have declined below their Jan/Mar closing lows. Other indices are slightly above those lows...others still are well above them. I will address the resulting wave count issues in the coming updates. |
| June 26, 2008 update...Who will win tomorrow's fierce battle between "technical support" and "downside momentum"? I have already placed a good size bet on "technical support", so you know "who I am rooting for"! A key reversal pattern with a higher close should turn the trend to the upside...anything else will leave the downward trend in place. |
| June 24, 2008 update...Was today's rebound of the banks and financials a signal that the bottom is at hand? Maybe. But, for me, I am betting on the track record of the 35 1/2 day cycle. It has worked 6 straight times since August 2007. Why should it fail now? The DJIA's pattern from the May 2nd high can be counted as complete (barring another subdivision). For all intents and purposes, Wave (b) has completely retraced all of wave (a). If INTERMEDIATE wave B is a zigzag, that should be it. However, if INTERMEDIATE wave B is an inverted flat (for the DJIA), then the March low will be exceeded. Fibonacci cycles indicate that June should be a low...and there are only 4 trading sessions left in the month. All we need now to confirm a reversal is a rally above channel resistance. That level is currently about 270 points above today's close. Tomorrow's Fed action will most likely be the trigger (one way or the other). |
| June 20, 2008 update...There are (at least) two agonizing Elliott wave truisms at significant market turning points: (1) a wave always travels farther than initially expected and (2) unanticipated wave subdivisions or complexities are not finally revealed until the wave is nearly complete (a good reason to scale into positions). One month ago, I correctly labeled the current pattern for wave (b) (or, alternatively, wave x) of INTERMEDIATE wave B as an a-b-c "flat". (Unless I am wrong and the market crashes next week...) I also correctly indicated that wave c of the flat would be a diagonal triangle. I was wrong, however, on 3 counts: (1) the type of diagonal triangle, (2) the time it would take to unfold, (3) and its length in terms of points. Since the beginning of PRIMARY wave (2), the 35 1/2 (trading) day cycle has played an important role. All major waves within PRIMARY wave (2) to date have terminated within a day or two of 35 1/2 days. So that should have been the clue that the current (b) wave would decline into the time period beginning today and extending into early next week. Technically, the market is (and has been for days) ready to explode to the upside...but the market (with hindsight) needed a certain amount of time to complete all of the subdivisons of its diagonal triangle pattern. Today, there were a number of indices, i.e. NDX, RUT, MID, DJA that held above their most recent lows. This is a bullish sign for the market if it continues into next week. As for how I am currently playing the market...I have been scaling into long positions on declines and scaling out a portion of the positions on rallies. With today's decline I have scaled into a 90 percent long position...so I am ready for a rally. I just hope the market is too! |
| June 17, 2008 update...The DJIA flirted with its declining resistance line first thing this morning...but, instead of breaking out, continued the subdivision of its final "e" wave pattern. Once the breakout does occur, be prepared for a massive rally. Sentiment has finally attained a level that can support such a rally. I have not shown the equity put/call ratio since the March lows when it reached historically extreme levels of bearishness. While it is currently below those levels, it has reached a level that is more inline with excessive bearishness during less volatile periods, as in the present case. |
| June 13, 2008 update...On this Friday the 13th only the bears were unlucky. The current market pattern suggests a powerful Elliott wave thrust (up or down) is about to begin. The coming days and weeks will now put my bullish forecast of this pattern's resolution to the test. |
| June 11, 2008 update...This is the moment of truth. The market must reverse now to hold all support lines as shown in the charts above. A close on Friday above 12209 will confirm the reversal. |
| June 10, 2008 update...The market is about to put my analysis of the past few weeks to the test. If I have correctly labeled the decline from the May 19th high as a "c" wave diagonal triangle, then an explosive rally is imminent. The DJIA has been tracing out a series of rising a-b-c patterns since Friday's closing low...possibly forming another diagonal triangle to complete the larger diagonal triangle's 5th wave. In any event, I have been scaling into a diversified long position since Friday...and will continue to add to it until this market finally takes off. On an intermediate term basis, a rally from here would suggest that another multiweek rising a-b-c pattern toward new highs has begun. |
| June 5, 2008 update...Today, the market did exactly what it should have done following the completion of a diagonal triangle pattern. As I commented last night, "diagonal triangles are terminal patterns and quickly retraced." I have been counting the pattern from the May 19th high as a diagonal triangle (wave c'), as I have discussed in the last three updates. Wave 3 of the pattern ended yesterday and was itself a diagonal triangle (this is rare for a 3rd wave...it usually occurs in a 5th wave). Assuming arguendo my count is correct, today's rally is wave 4 of the c' wave diagonal triangle. The 12700 area now becomes the focus of critical importance. Not only is it a point of trendline resistance (as you can see in the charts above), the validity of the diagonal triangle wave count depends on the rally ending and reversing there. While the 4th wave of a diagonal triangle can exceed the starting point of wave 3...in the case of triangles where wave 3 ends below wave 1, wave 4 should not significantly exceed the wave 3 starting point. (I hope that makes sense.) So, my focal point over the next day or so will be on the conclusion of wave 4 and the beginning of a 5th wave decline to complete wave c'. If the market fails to reverse and continues to rally strongly, this wave count is negated...and wave x is likely over. (I can see alternate wave counts that allow for wave x to end at yesterday's low...but, IMO they look forced.) |
| June 3, 2008 update...On the bright side today, if you were long the S&P 400 (MID) index, you made money. A number of other indices were down only slightly, but the DJIA was down over 100 points. Yesterday, I thought the DJIA had completed the 3rd wave of a diagonal triangle for wave "c" of x. I was obviously wrong...but I am sticking with the diagonal triangle wave count for now. After making a closing low on May 23rd, the DJIA rallied for 3 days...and has now declined for 3 days. If the 3rd wave of the diagonal triangle terminated at today's low (closing basis), the likely timeframe for the completion of the entire pattern would be next week, i.e., a 4th wave rally followed by a 5th wave decline. The one thing that bothers me in terms of the current 3rd wave pattern is that it looks like 5 waves...when it should be 3. This could clear up with one more decline tomorrow morning...but, if not, I am open to the possibility that something else is going on (I can see a few wave count alternatives). On the technical side, the DJIA has reached its lower Bollinger Band and is oversold on an intermediate term basis. Unless we are in a crash type pattern (which I don't see) we should be bottoming and starting to rally...at least on a short term basis (wave 4 of the diagonal triangle). |
| May 29, 2008 update...At the March lows, I indicated that the Elliott wave pattern of INTERMEDIATE wave A established the fact that INTERMEDIATE wave B would take the DJIA to new highs. At the same time, I also suggested that new highs could be reached by June. I received an email yesterday asking if that was still possible. My answer: possible...yes...but, likely...no. The second chart above shows the one way it could be done. The DJIA would have to recreate its September/October 2007 pattern when the final phase of the (b) wave rally accelerated and the DJIA achieved a new all time high. The more likely scenario follows the wave count shown in the first chart. Taking 38 trading days (from March 10th to May 2nd), the DJIA traced out an a-b-c pattern. From May 2nd to the low on May 27th (16 trading days) the DJIA formed an "x" (connecting) wave. Whether or not wave "x" is "officially" over, another a-b-c pattern of 38 trading days from Tuesday's (unorthodox?) price low would take until July 21st. Of course, the next a-b-c pattern could last longer...possibly until the next 62 week cycle high (see Weekly Cycles chart). With respect to whether or not wave "x" is "officially" over, I am watching the hourly pattern to determine if wave "c" of "x" is forming a diagonal triangle (with a rising series of 3 wave patterns for waves 2, 3, 4 & 5, i.e., resulting in a higher orthodox low). Finally, it was noteworthy today that at least one index (Russell 2000) has already exceeded its May 2nd and 19th highs. |
| May 23, 2008 update...I commented last night that I would like to see the formation of a diagonal triangle to complete the current selloff that began after Monday's high. Why? On the DJIA 's daily closing only chart, there is a five wave decline from 5/2 to 5/9 (wave a')...then a countertrend rally to 5/19 peaking below the 5/2 high (wave b')...and now a final c' wave decline that needs 5 waves to complete a "zigzag" "x" wave pattern (5-3-5). In the case of the high-low-close chart, a "flat" (3-3-5) pattern has formed for wave x suggesting strength in the next a-b-c pattern to follow. On either chart, when the first subwave of a "c" wave pattern is unusually strong...and consumes most of the probable length of the entire wave...a diagonal triangle formation is quite common. That is what I expect to occur here...with some choppy bottoming action to finish the pattern next week. The NDX showed relative strenth vs. most of the other indices today and I believe the index will continue to lead once the market resumes its march to new highs. On a personal note, I began scaling into a long position today and will continue to do so on any weakness next week. I am watching the DJIA - Med Term Buy signal chart now as a guide to reestablishing a 100 percent long position. Pattern, price and time factors are beginning to align for the next important bottom...sentiment indicators, however, are not quite there yet. |
| May 20, 2008 update...The technical indicators finally won out today and helped to "unmuddle" the picture a bit. As I suggested on Friday, it was possible that wave "b" was elongating into a more complex pattern. That is what I think is likely happening. As I show in the charts above, there are two reasonable ways to count wave "b"...depending on where you start...and how you end. One would be a "flat" beginning on May 2nd...the other would be a "horizontal triangle" beginning on April 18th. At this point, the main difference between the two is the pattern of the current decline. A "flat" implies a five wave decline...a "triangle" implies only three waves. A three wave decline could be over as early as tomorrow...a five wave decline would likely unfold into next week. Should the DJIA close below 12700 in the next day or two something else is probably going on...and I may have to reexamine my count. Once wave "b" is complete, a wave "c" rally will follow. I still think that the Fibonacci retracement level of 13220 is the likely objective. |
| May 16, 2008 update...The technical indicators are mounting each day more in favor of a short term correction. However, as indicated by today's selloff and recovery, the underlying intermediate term up trend is strong. In terms of Elliott wave analysis, we are unfortunately sitting at one of those junctures where the picture is muddled. On a positive note, the DJIA bounced off of trendline support last Friday and managed to gain over 200 points for the week. Interestingly, the pattern this week has mimicked the action between April 22nd and 30th...and could be a setup to a powerful rally, i.e, wave "c". On the other hand, if the pattern breaks down next week, it would suggest that wave "b" has elongated into a more complex pattern. Now is definitely not the time to be 100 percent long or short. The only prudent thing to do is keep some cash on the sidelines and wait patiently until the market's near term direction clears up. |
| May 13, 2008 update...I commented last night that I thought wave "b" would look best with one more a-b-c decline. That would complete a triple combination pattern (a-b-c-x-a-b-c-x-a-b-c) for wave "b". Today, the DJIA traced out waves a and b. If I am right and this pattern is indeed unfolding, a final c wave decline will occur tomorrow. A decline tomorrow would also be consistant with the fractal count shown above. If the market stages a significant rally tomorrow this analysis would be negated. |
| May 9, 2008 update...Well, wave "b" is now clearly discernable on a long term chart...and should end sometime next week. On a short term basis, the DJIA has entered oversold territory...and is getting closer to the 12650-12700 area that I mentioned in the May 4th update. I should caution you, however, that the market indices are by no means oversold on an intermediate or longer term basis. My belief that the market will soon resume its upward trend is based solely on my interpretation of the intermediate term Elliott wave pattern. Finally, while I make no claims to be an expert in Elliott wave fractal analysis, I thought the "b" wave pattern offers an interesting case in identifying a "paired bottom". The current fractal also suggests that wave "b" is close to completion. |
| May 7, 2008 update...Wave "b" continues to unfold. To date, it has declined in typical a-b-c fashion. It should continue to unfold until the DJIA reaches an oversold condition...and/or the DJIA reaches the bottom of its rising trendchannel. Also, wave "b" needs enough time, in my opinion, to develop so that it is clearly discernable on a long term chart. So far, it is not. |
| May 4, 2008 update...All signs suggest that wave "b" should now begin: (1) the market is short term and intermediate term overbought, (2) trendline resistance abounds on the various indices, (3) most indices have reached the upper (20 day/2 SD) Bollinger Band, (4) a cycle reversal is due, and (5) sentiment indicators finally support a market decline. The 12650-12700 area would appear to be about as far as the DJIA should decline in the coming week or two...but, a shallower decline is also possible if the pattern that unfolds is more time consuming and/or complex. How much higher could wave "a" extend if wave "b" does not begin Monday, or Tuesday at the latest? According to one chart that I look at, it's around 13350. |
| April 30, 2008 update...What a dilemma! With the DJIA at its highs this afternoon I thought we were on our way to completing wave "a". We didn't quite get there, however. By the close, the DJIA had given back all of its gains for the day and closed lower. So...did the DJIA trace out an ending diagonal triangle to complete wave "a"...or, alternatively, is the DJIA completing a contracting horizontal triangle? The former implies that wave "b" is underway towards the 12650-12700 area. The latter implies that wave "a" is still unfolding and will thrust higher. Here are a few reasons why I lean toward the second scenario: (1) the DJIA never reached trendline resistance nor its 200 day moving average, (2) the S&P 500 never closed at horizontal resistance, (3) the XMI closed higher after completing a short term a-b-c pattern (and (4) EWI's STU tonight adopted an agressively bearish stance). Most of the indicators are now giving sell signals...so, if there is to be a final push higher to complete wave "a", it will have to be done in light of that fact. The market staged a huge rally on April 1st...will the same thing happen on May 1st? We'll find out tomorrow! |
| April 25, 2008 update...The DJIA closed 42 points higher for the week...near the top of its weekly trading range. Today was an "inside day" for the DJIA (meaning it traded inside yesterday's range). This usually reflects indecision in the market and can either be a sign of consolidation before a resumption of the previous trend...or a sign of a reversal. Since the DJIA closed at the top of its trading range today, I think it is more likely that the DJIA will continue higher next week. As the DJIA chart above shows, there is significant resistance between 13000 and 13100. We mentioned this area in last Friday's update as a likely target for the completion of the current "a" wave. That is still the case. Further support for a reversal next week is the 35 1/2 day cycle (May 2nd...see DJIA Zigzag chart...last time it was 3 days late...so be aware that it could be a few days early or late.) Wave "b" will follow...and is likely to take the DJIA back to the area of this week's low. |
| April 22, 2008 update...Instead of continuing its rally from last Friday into this week's Fibonacci cycle period, the DJIA declined. In the majority of cases, the DJIA will reverse its trend on Fibonacci turn dates. If such is the case now, the two day old decline should be over...and the DJIA should turn higher tomorrow. Because the size is too small and the time is too short, yesterday's and today's decline can not yet be classified as either part of wave "a"...or the start of wave "b". As of now, my opinion is that wave "a" is still unfolding...and that it is merely subdividing...before heading toward the 13000 area. I think we will probably know by tomorrow. |
April 18, 2008 update...A Dow Theory Buy Signal was triggered today. Big deal!! What value does a system have that gives a buy signal (at 12849) after a 1109 point rally...which followed a sell signal (on 11/21/07 at 12799) after a 1364 point decline!!! While no system is perfect, Elliott wave analysis is far superior to anything else I have ever seen. Of course, in the wrong hands, it can also cause an investor to lose his shirt.
The current "a" wave advance sliced right through the 12750 resistance area this morning and climbed all the way to 12898 this afternoon...meeting initial trendline resistance and then turning slightly lower. Next Monday and Tuesday are Fibonacci cycle dates. Given the DJIA's short term and intermediate term overbought condition, it is likely that wave "a" will end on one of those days. The next area of trendline resistance lies just above the 13000 level (and above 1345 for the XMI)...and it should be about as far as wave "a" goes. A wave "b" short term correction will follow. |
April 15, 2008 update...It has been almost 2 1/2 years since the last subscription site update...so, to the old subscribers, welcome back...and to the new subscribers, welcome. I hope that you find the new subscription service informative and useful. The buy/sell chart and message features are new and were not available back in 2006. You now have complete access to all of the investment tools that I use on a daily basis. The only thing that I add is my Elliott wave perspective...which, depending on your investment approach and needs, is of varying importance. In terms of pure technical analysis, it is my firm opinion that the charts we offer give you everthing you need to make a buy/sell decision. While there are probably hundreds of charting programs out there with hundreds of indicators that you can use, 99 percent of them are duplicative. Most of the indicators and parameters that I use were created 20 years ago, and I have rarely had a need to add any new ones. After you gain enough experience in using them, I believe that you will be able to make market judgments as well as any investment firm technical analyst.
As for the market, it has either started, or will start after one more brief selloff, the next phase of its rally back to its October 2007 highs. Tomorrow, the critical level is around 12430. That is the top of the DJIA's 10 day old declining trendchannel. If it breaks through, the DJIA should finally be on its way toward breaking above the 12750 area. If the 12430 area holds, the DJIA will likely trace out a 5th wave decline to complete wave "c" of a flat pattern (3-3-5) going back to March 24th. The end of March lows around 12175 should contain the decline. |
Important: Information and chart access provided herein is limited to current subscribers only and shall not be forwarded or retransmitted without written authorization. It is educational in nature and shall not, directly or indirectly, be construed as investment advice. No guarantees are made with respect to the accuracy of the information, opinions, predictions,etc. offered here in. The username/password provided to a subscriber is unique and it is the sole responsibility of the subscriber to protect the confidentiality of said username/password and to further protect it from any unauthorized use.
Copyright © 1997 - 2009. The Elliott Wave Chart Blog. All rights reserved. Email
|