Charts
Index Funds
Direxion - ProFunds - Rydex
Sector Funds
Direxion (Benchmarks/ETFs)
ProFunds (Benchmarks)
Rydex (Benchmarks/ETFs)
ETFs
Foreign
Currencies
IMPORTANT: Chart buy/sell signals are helpful in determining market support and resistance levels...and probable turning points. However, they are only useful if the analyst has a handle on the larger trend. Experience and judgment play a vital role in that determination ...as does Elliott wave analysis.
If a chart does not not appear when you click on the link, you may need to (1) enable javascript, and/or (2) disable pop up blocking for this site, or (3) right click on your mouse and open the link in a new tab or window.
If you have a suggestion for an ETF or sector index that you would like us to consider for addition to the list of charts of above, please send an email to info@wavechart.com.
Please contact us at info@wavechart.com if you encounter a problem with the site. |
|
Elliott Wave Chart Blog 2009 Archive
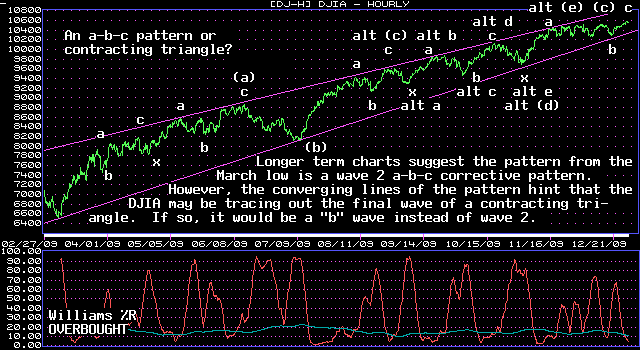
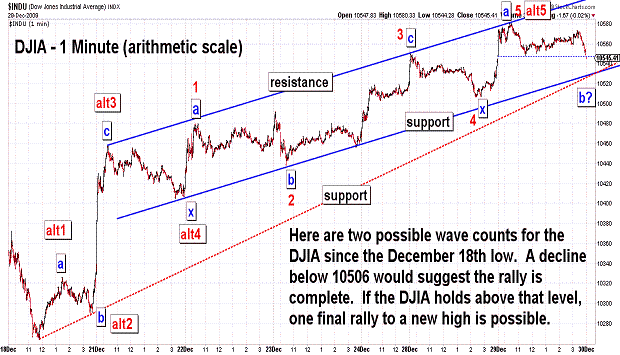
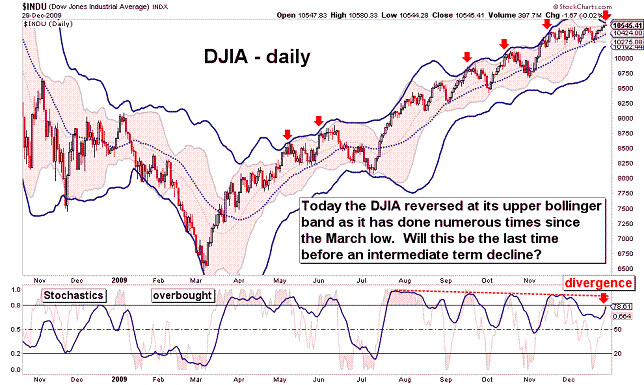
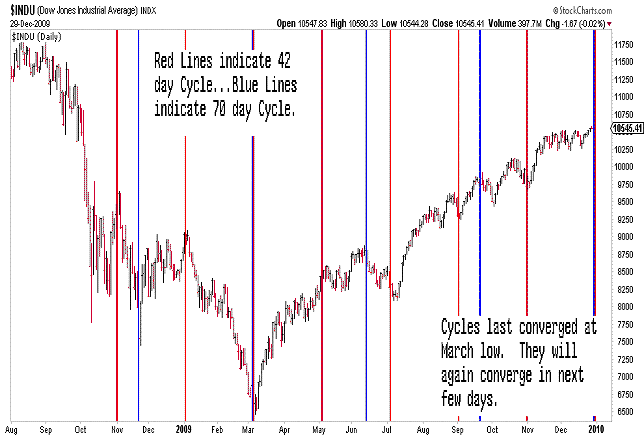
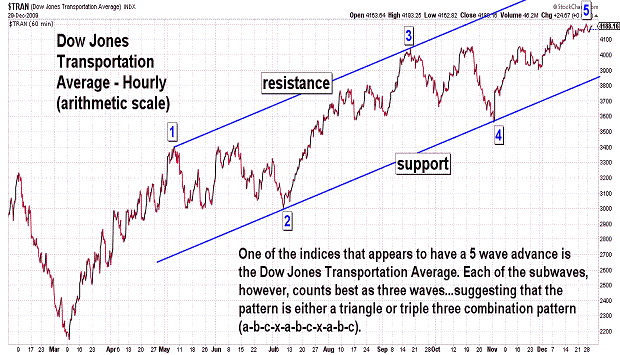
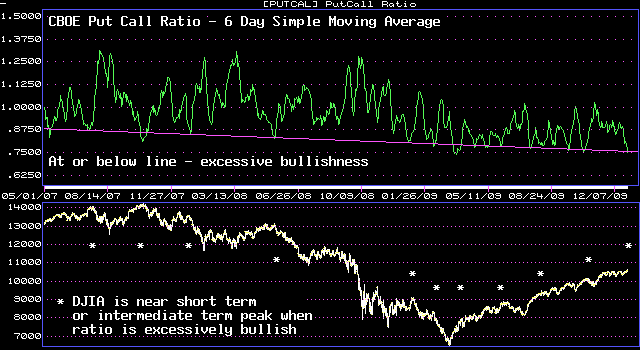
| December 29, 2009 update...The DJIA ended a 6 day winning streak today with a nominal loss. As the bulls exercised their will on the market during these final sessions of 2009, the DJIA, in fact, only rose about 7/10 of a percent since last week's update. As you can see in the charts above, market technicals, cycles and sentiment are again aligned to suggest that a reversal is imminent. Since July all of these reversals have been short term in nature. Will this finally be the intermediate term reversal that (IMO) is several months overdue. We shall see! In the meantime, have a HAPPY AND PROSPEROUS NEW YEAR (hopefully, if you are bearish like me, the market will not)! |
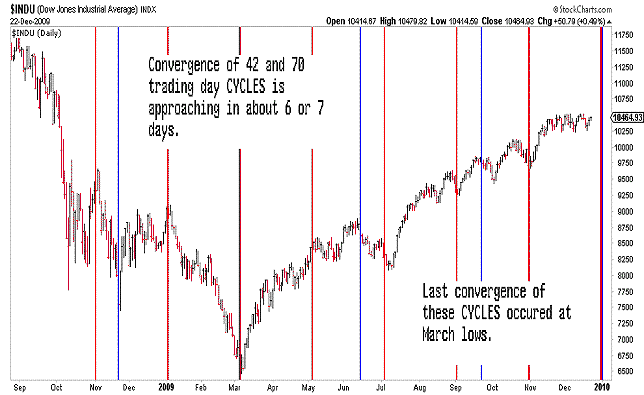
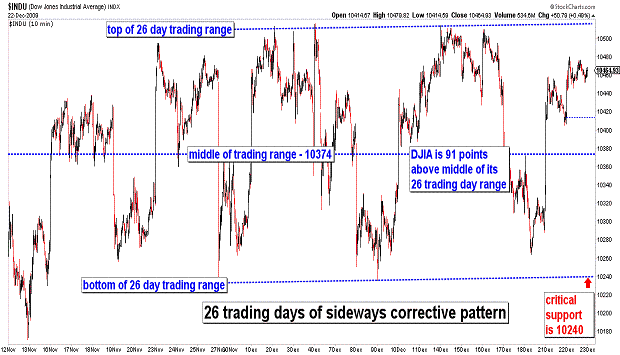
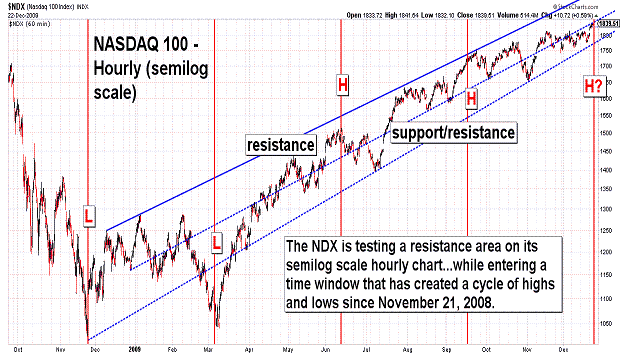
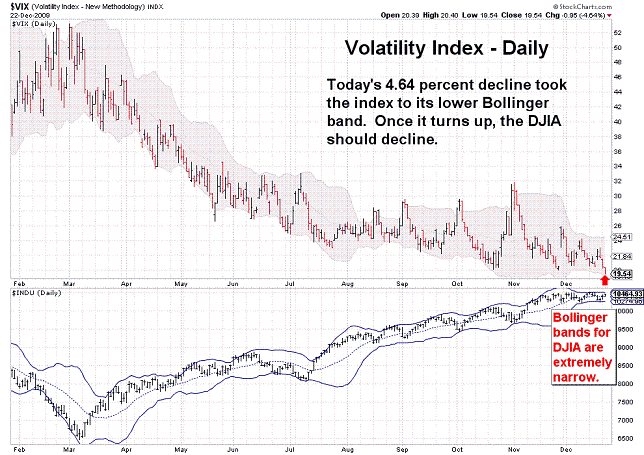

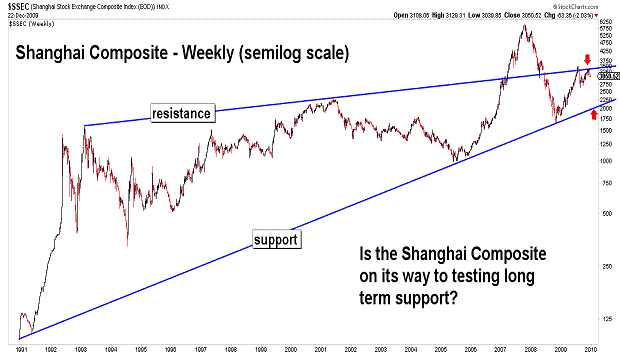
| December 22, 2009 update...As we approach the Christmas holiday this Friday, the DJIA remains locked within its 26 day trading range. Today, it moved toward the top end of the range...but, still it managed only to close 91 points above its 26 day midpoint. This month long plus lack of volatile action has caused a narrowing of the daily bollinger bands...and a decline by the VIX (today it lost more than 4 percent) to its own lower bollinger band. In terms of sentiment (i.e., the CBOE put call ratio), two days of heavy call buying have finally drawn the market toward an excessively bullish condition. If you add in the market's intermediate term overbought condition, we get closer IMO to the conclusion of the March to December advance. I noticed today that the 42 day and 70 day CYCLEs in the DJIA will converge in the next 6/7 days. The last convergence of these CYCLES occured at the March low. Maybe this next convergence will produce a top. We'll see! Barring any unusual or surprising action tomorrow or Thursday, I'll have more to say next Tuesday. In the meantime, have a HAPPY and JOYOUS HOLIDAY! |
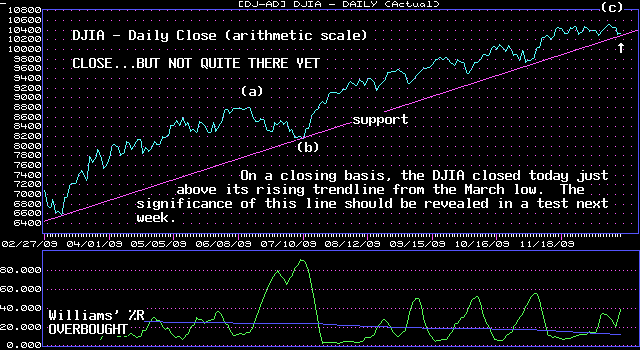
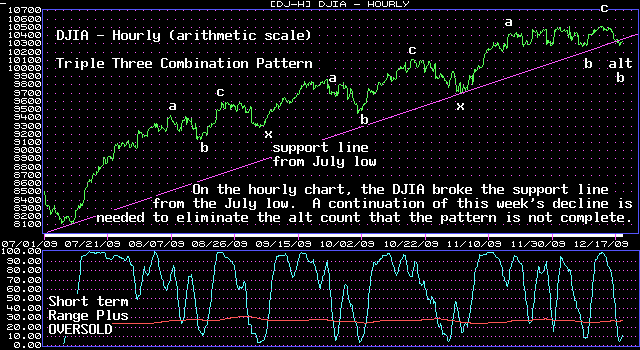
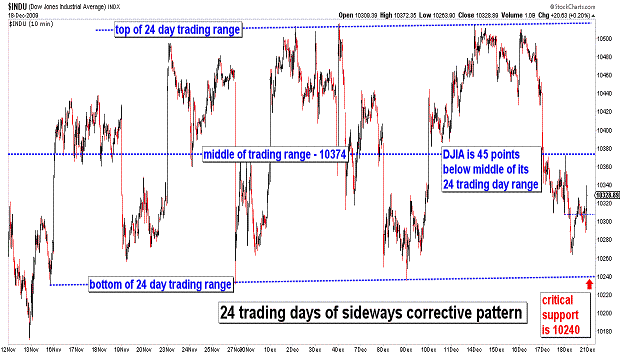
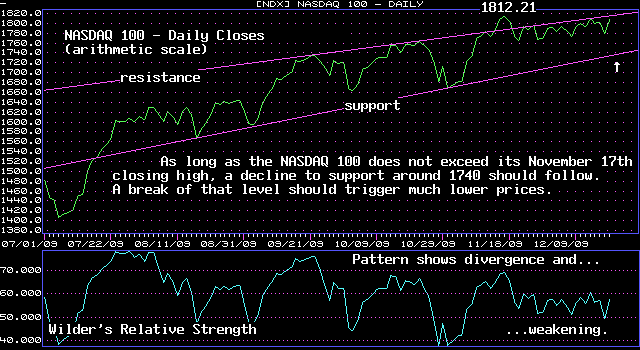
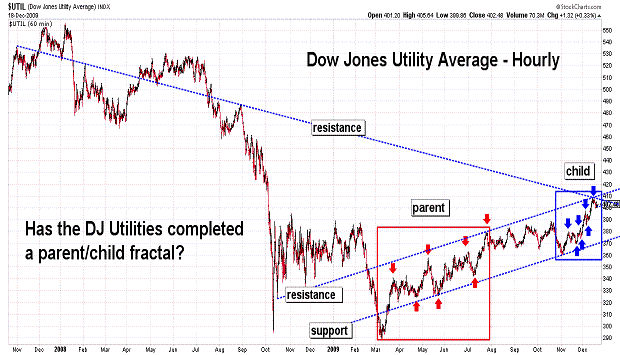
| December 18, 2009 update...The fragmentation of the indices continued this week...with smaller stocks and tech stocks experiencing an up week...and the DJIA and other larger cap indices experiencing a decline. For the DJIA (weekly loss of 1.33 percent), it was the biggest decline since the week ending October 30, 2009. Despite the DJIA's solid decline, the pattern is still not clear enough to confirm that an intermediate term decline has begun. The DJIA came within a hair of testing its rising trendline from the March low...both on an intraday and closing basis. There is a good chance that the test will happen next week...and depending on whether the average holds there or accelerates right through it should reveal whether or not the intermediate term trend is changing. The last two weeks of December are often trendless, i.e., last year the DJIA moved sideways until a slight pop on December 30th and 31st. Three more days of rally followed...and then the market collapsed for the next two months. Will we see a repeat of this pattern? We'll soon see! |
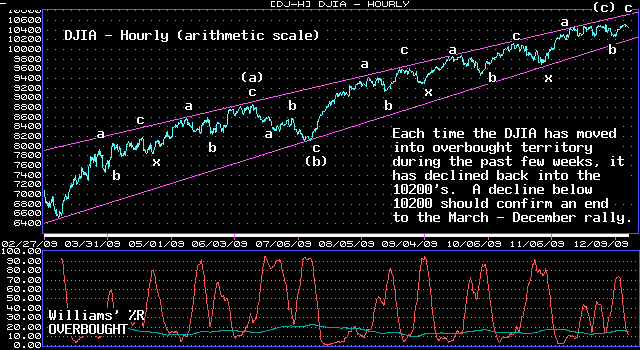
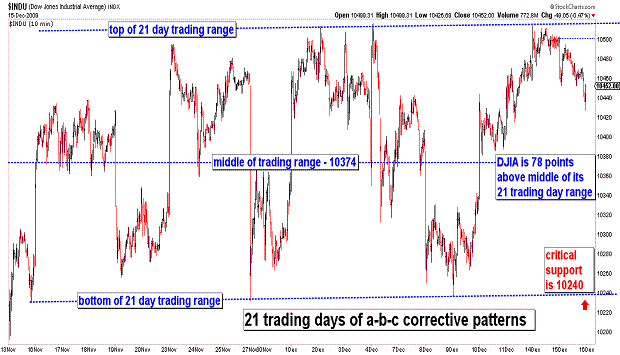
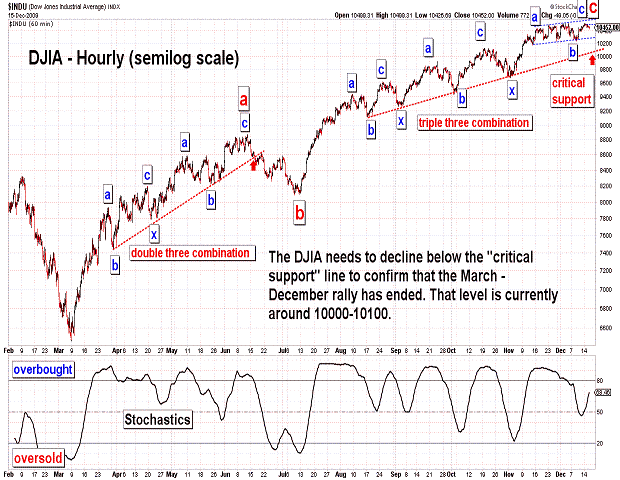
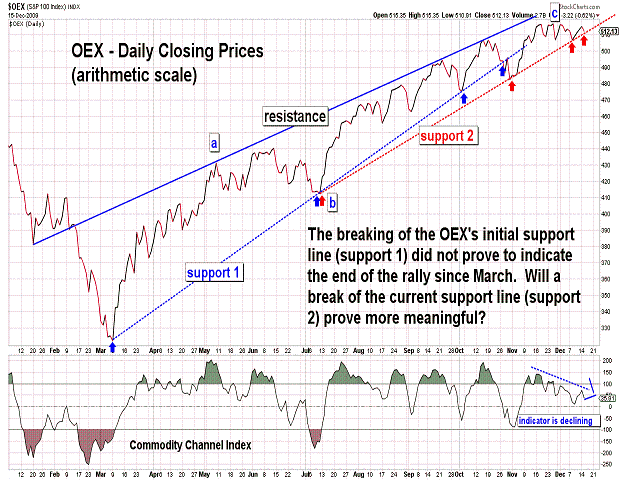
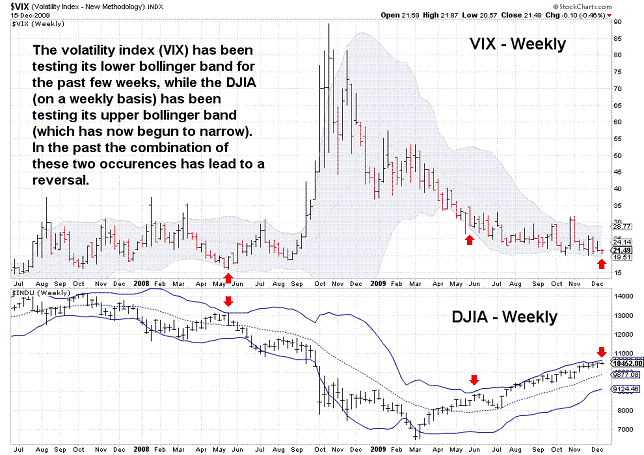
| December 15, 2009 update...The DJIA broke its four day rally with a decline of 49 points. The decline was certainly not enough to signal an end to the recent rally, but a number of short term overbought/oversold indicators have now moved back into overbought territory. During the past month, each of these overbought signals has triggered a decline by the DJIA back into the 10200's. The DJIA needs to break the recent low of 10235 to start tripping a series of support line breaks...which begin at that level and continue on down to 10000 (probably the most significant support area). Patternwise, the rally from the July low can be counted as complete (or nearly so). One more rally above 10516 is still possible if the recent rally extends and becomes more complex. Personal note: reviewing my market updates, it is obvious that the market averages have held up longer than I thought they would. Each day the market's technical condition looks worse than the day before. The government and
Fed seem to be doing everything they can to prevent a major decline. They assume that their actions will bring about a rebound like those of the past 28 years. This past Sunday's talk shows with economic and financial gurus were filled with positive spins on every economic statistic out there. I think this time is different. My interpretation of the long term Elliott waves suggests that the Bear Market from the October 2007 highs has much further to go. We'll see. |
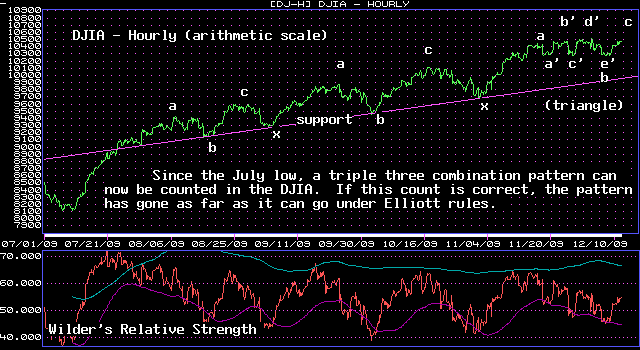
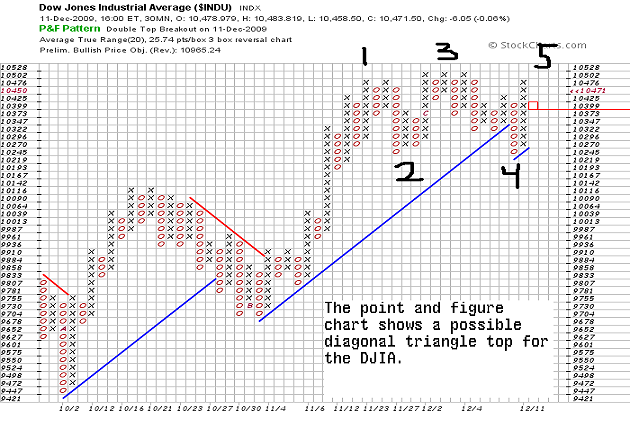
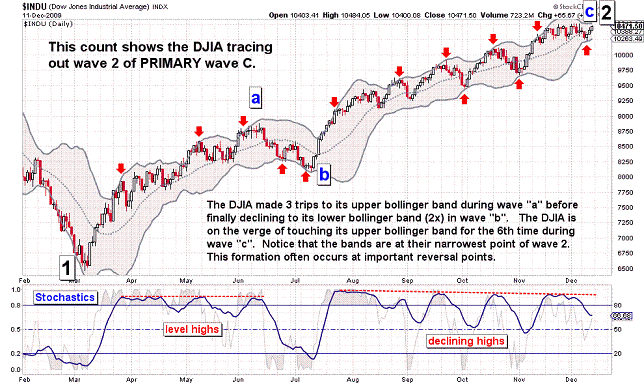
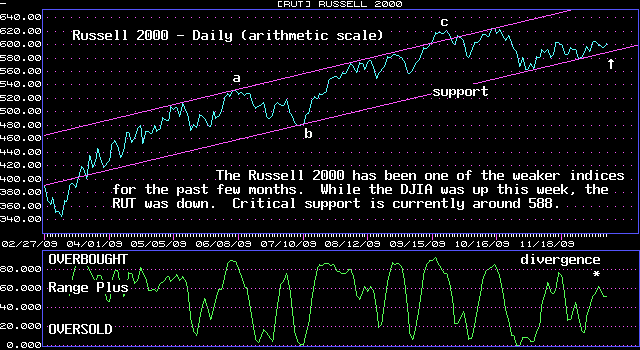
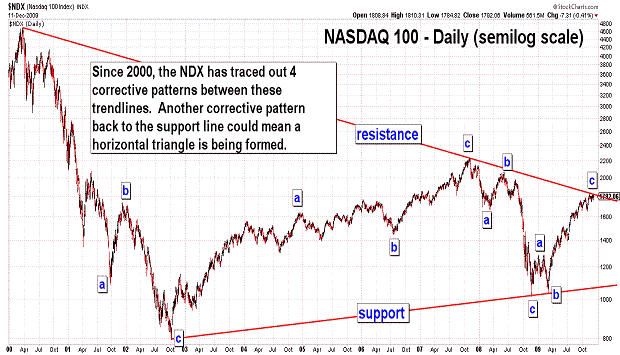
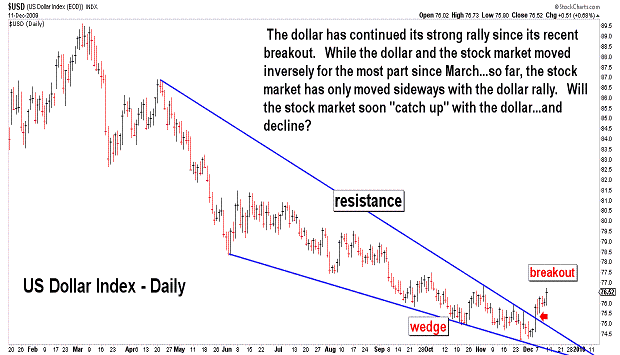
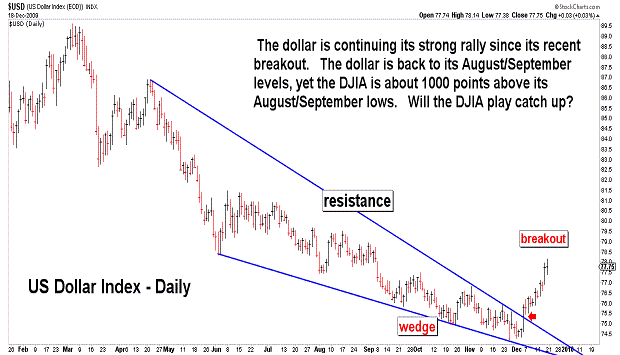
| December 11, 2009 update...On the healthfront, I learned today...after getting a chest xray...that I have pneumonia. I guess the good news is that I am already half way through the recommended antibiotic treatment for it. So, hopefully I'll be in much better shape by next week. On the marketfront, it was a mixed week...the broad indices closed on both sides of the UNCH line. The DJIA closed up about 8/10 percent...but, did NOT make a new intraday high. One count suggests that the DJIA completed a "horizontal triangle" on Wednesday and is in the process of tracing out the final "c" wave of a triple three combination pattern (see first chart). A look at the DJIA's point and figure chart, however, allows for counting the action of the past several weeks as a "diagonal triangle" top. In either case, it suggests that the entire rally since the July low (as well as March low) is nearly over. An acceleration to the upside would obviously negate this bearish vew. Frankly, I am not sure how this possibility would be counted within the context of a corrective wave from the March low. But, if it happens, I'll deal with it. Some other items noted in the charts above: (1) the bollinger bands are narrowing as volatility diminishes...this formation often occurs at reversal points; (2) the long term resistance line on the NDX chart still appears to be effective...and if it holds could turn the index substantially lower; (3) the dollar index appears to have made a solid reversal to the upside...and, if the recent inverse dollar/stock market relationship continues, it should assist in weakening equities. |
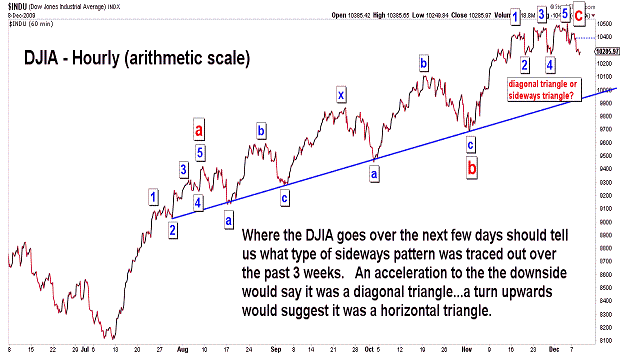
| December 8, 2009 update...Forgive me for the brevity of tonight's update, but I have been battling a serious sinus infection which worsened over the past two days. My medication was changed today...and I keep nodding off even as I try to write these few sentences. We may be witnessing the early stages of a change in the character of the market...especially in terms of its reaction to news events. I see a clear diagonal triangle formation on the DJIA chart through last Friday's high...but, it requires a sharp selloff right from here. With today's decline, it is also possible to view the pattern as a completed horiztonal triangle. In that case, a sharp rally is next. Of course, it is possible that there could be no significant movement in either direction...but, I am not yet sure what that would imply. |
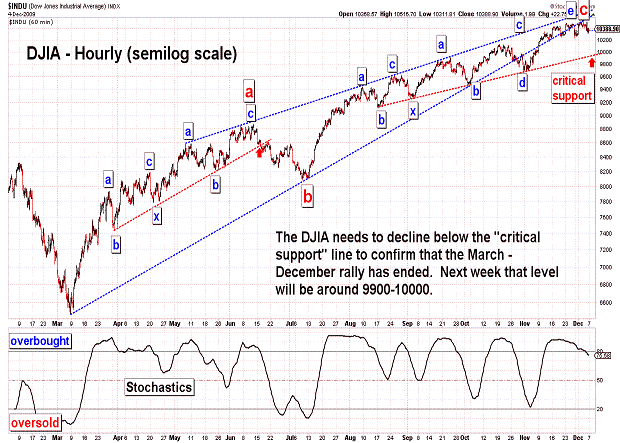
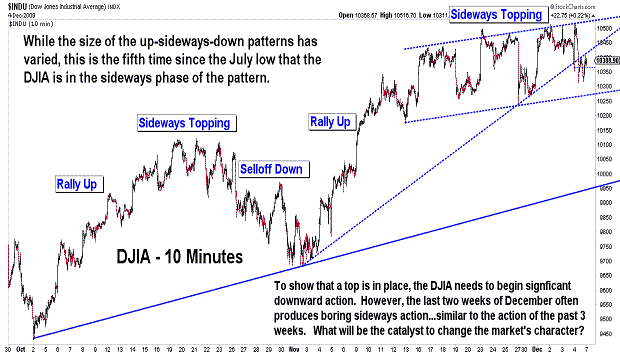
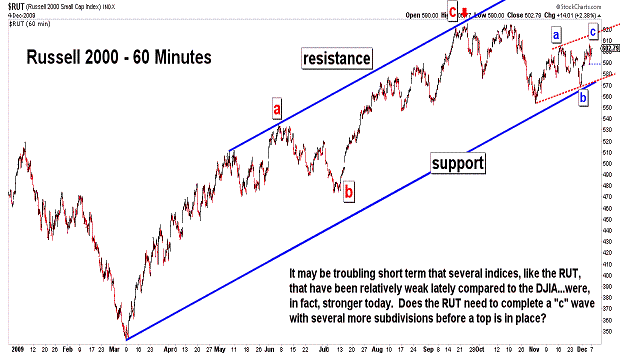
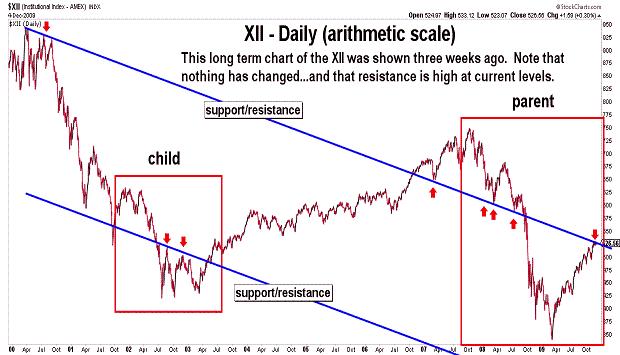
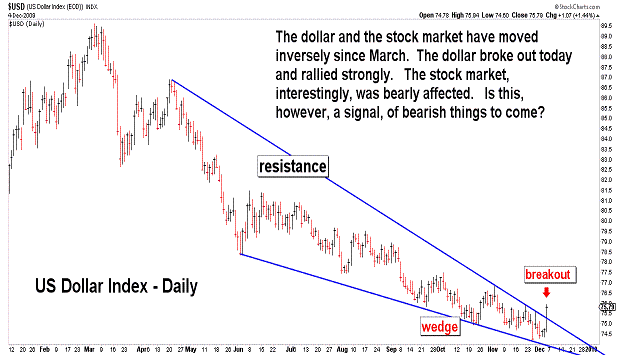
| December 4, 2009 update...The DJIA rallied above the 10500 level 4 times this week...each time reversing and declining further away from it than it did the previous time. It produced a very unusual short term chart...suggesting that there are a lot of sellers up there when compared to buyers. On a closing basis, the DJIA has not gained a single point (in fact, lost 19 points) in 14 days. You would have thought with today's unbelieveable (and I do mean UNBELIEVEABLE) unemployement data...that the market would be hundreds of points higher making new highs. I guess I must be naive and lacking in economic understanding...because all the analysts I see on the business channels keep making giddier and giddier market forecasts. I guess everything is solvable by spending borrowed funds and printing money on top of that. This must indeed be a new economic golden age. Markets only go in one direction...up and only those investors who can't find the logic in any of this lose out because it makes no sense to participate. The only thing I know is that wave patterns like the current one from July are eventually retraced in whole or in significant part. The unknown factor is whether or not some strong upside volatility first occurs...leading to a spike and then a reversal. I will keep watching for clues. I did find a Fibonacci one today. The NDX declined for 13 months from October 2007 to Noveber 2008. It has now rallied for 13 month from November 2008 to December 2009. |
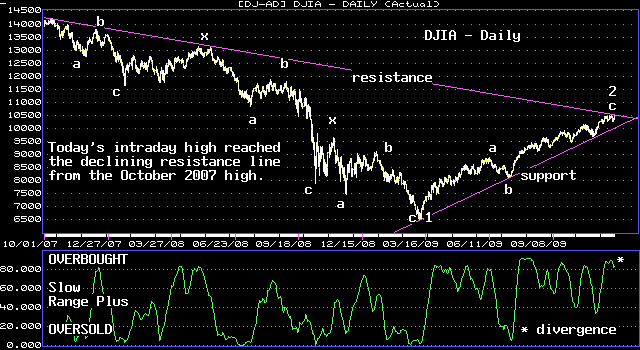
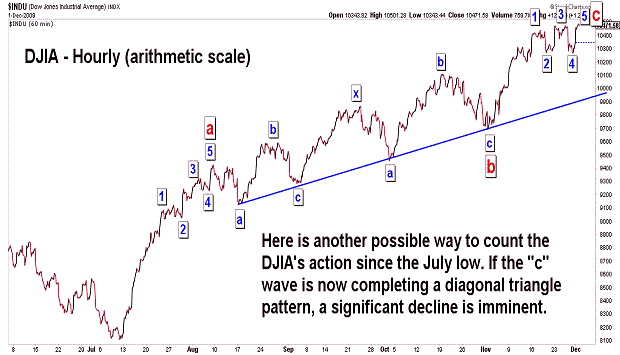
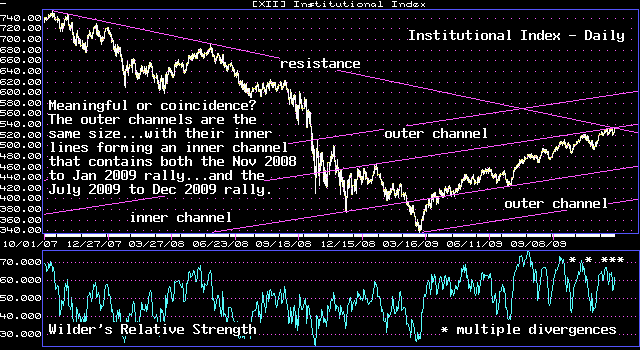
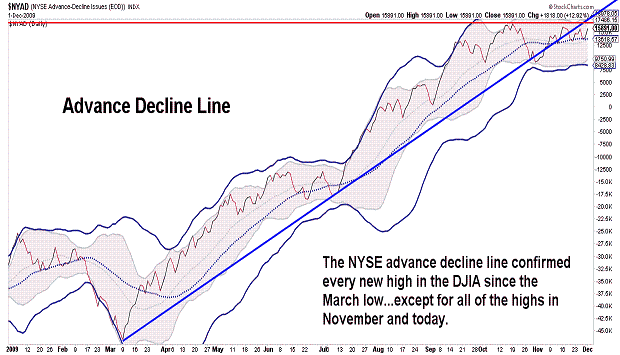
| December 1, 2009 update...My hunch about the "fundamental backdrop" behind Friday's sharp decline and the clear a-b-c pattern it left in place...resulted in a rally back to "new" highs again today. Actually, there were very few new highs in the indices that I follow: the DJIA, the Dow COMPOSITE, and the XMI. In the past 1/2 month, most of the broad indices have, in fact, lost ground. One of the exceptions is the DJIA, but it is only up 6/10ths of a percent. Over the past 4 months, each time the DJIA has rallied back to the top of its range and made a new high, it has done so with an increasing number of divergences...and there was no deviation from that pattern today. Speaking of patterns, there appears to be a "not quite perfect" (but still valid) picture of a complete (or nearly complete) diagonal triangle pattern in the DJIA (and some other indices). If so, a significant decline is imminent. A quick decline below Friday's low would likely confirm it and mean a retracement of the entire rally since November 2nd was underway. Finally, an interesting factor which may support an important top right here is that December is starting near the top of the DJIA's range. The past three months have all started closer to the bottom of the recent range. |
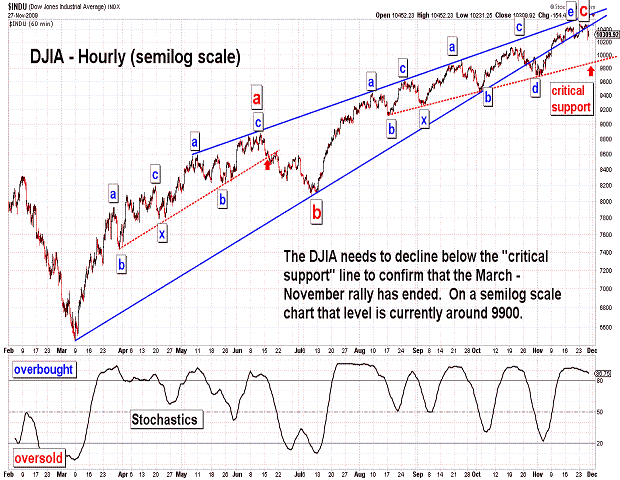
| November 27, 2009 update...Today's (short trading session) decline left most of the broad market indices nominally lower for the week (the exceptions were the NDX, OEX, SPX and XII.) The action today would have been more meaningful had it been purely technical in nature and occurred in the absence of a fundamental event, i.e., Dubai's debt situation. So, we will have to wait until next week's action to see if today's decline is the trigger to a wave 3 decline...or, is just the completion of a short term a-b-c correction from Monday's high. Enjoy the rest of your holiday weekend! |
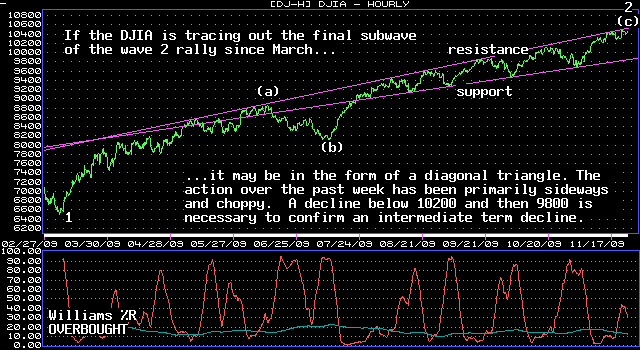
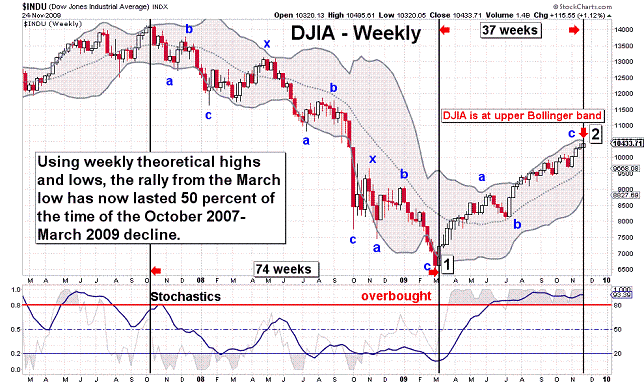
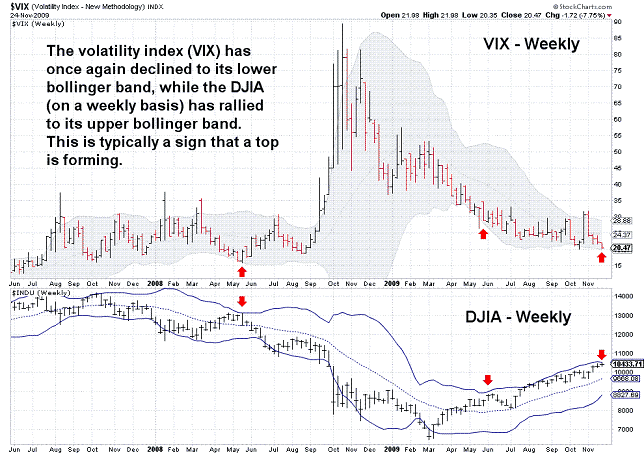
| November 24, 2009 update...The week began with the third straight round of Monday morning buying. Short term, the market is overbought...but, it may be tracing out a diagonal triangle top and postponing a collapse until this typically positive holiday period is over. On a weekly basis (using theoretical prices), the DJIA's rally since March is now 50 percent of the duration of the October 2007 to March 2009 decline. That means that we are still within the price, time and pattern window for an important top. A bit more call buying to trigger a put/call ratio sell signal would be helpful now, but most other technical indicators are already aligned for a reversal. As I have said for weeks now (and forgive me for repeating it once again), momentum is the only technical factor supporting higher prices. An intermediate term decline is coming...but, the DJIA needs to break below 10200 and then 9800 to confirm that it is underway. Barring any unusual or surprising action tomorrow or Friday, I'll have more to say next Tuesday. In the meantime, have a HAPPY THANKSGIVING! |
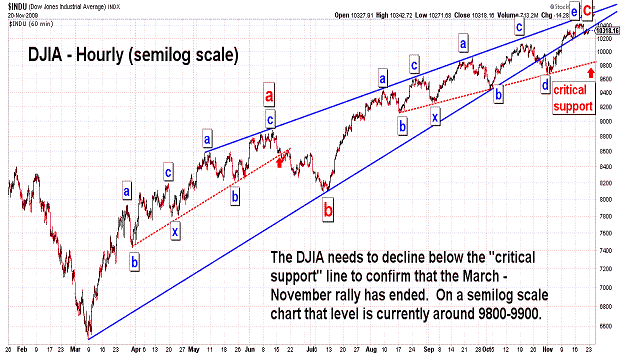
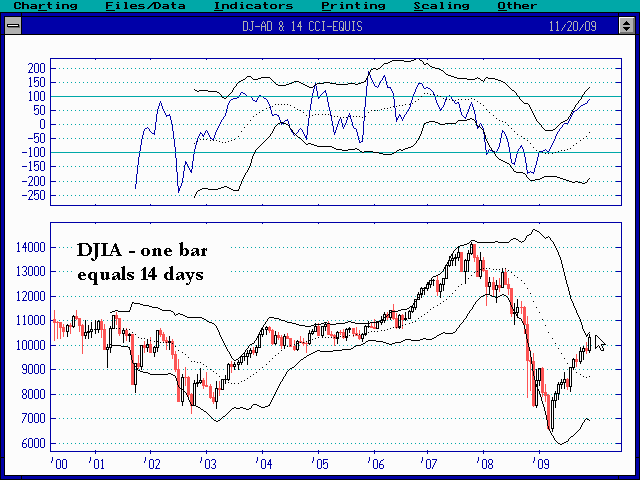
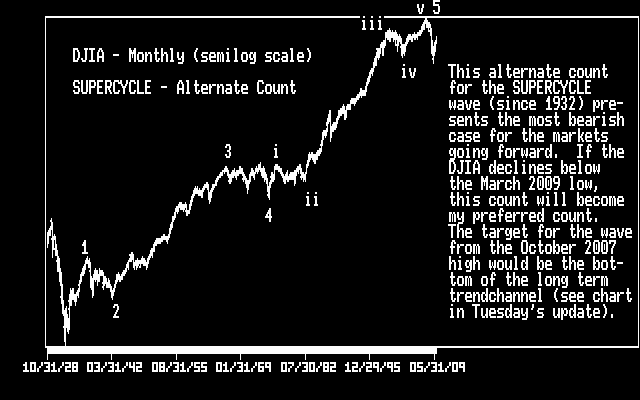
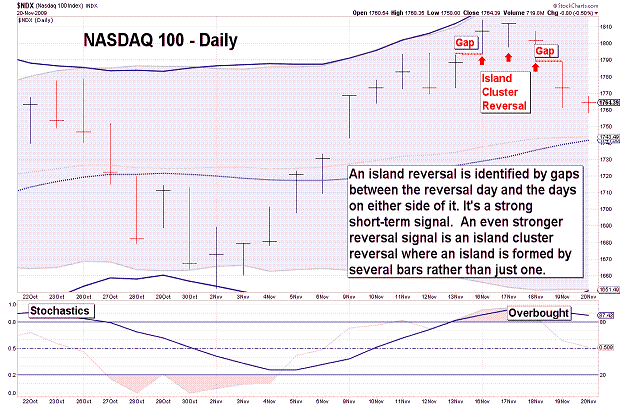
| November 20, 2009 update...Despite the third consecutive day of declines, the broad indices ended the week on a mixed note...the DJIA was slightly higher...the NASDAQ lower. Certainly, there was no confirmation that the rally from the March low is over...but, there were a number of nonconfirmations at Tuesday's high. For example, the advance-decline line, for the first time since the March low, did not make a higher high along with the DJIA. Also, the NASDAQ 100 formed a bearish island cluster reversal pattern (see NDX chart). The critical support line for the DJIA is the one shown in the first chart above. It has held 4 times since August. Next week that line will be between 9800 and 9900. That's over 400 points away from today's close...and, given next week's holiday trading, it may be a difficult task. Should it do so, however, it would reveal significant weakness in the market considering the effect of positive seasonal crosscurrents. Finally, I posted a long term chart of the DJIA showing an alternate count for the SUPERCYCLE wave (since 1932). The validity of this count depends on whether or not this year's lows hold on a retest. If the lows are exceeded, the DJIA will likely test the bottom of its long term trendchannel (see Tuesday's monthly chart of the DJIA). |
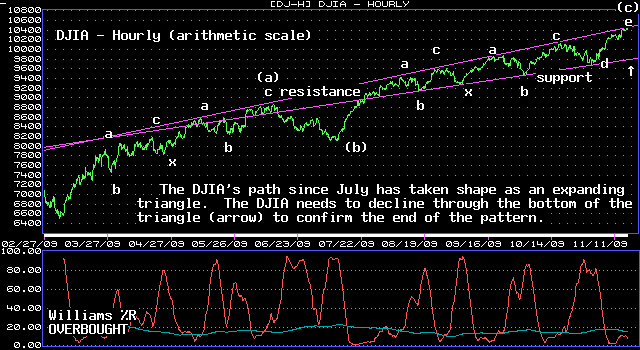
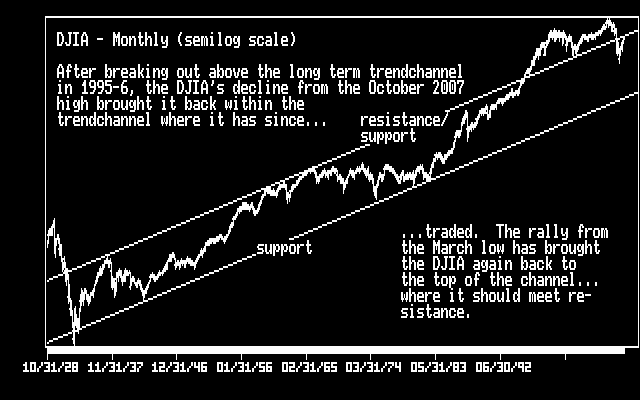
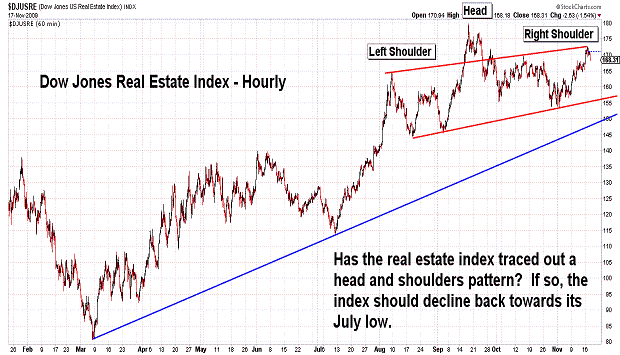
| November 17, 2009 update...For some time now, I have posted chart after chart showing the market's weakening technical condition. Yet, the market has chopped its way steadily higher...based (in my opinion) primarily on its own momemtum. I read an article today that agrees with this assessment at thestreet.com. Apparently, a
"portion of the sharp rise (in the market) over the past few months could be the dominance of quant funds that worship at the altar of price momentum (and the self-fulfilling prophecy of the fund flows that follow the price momentum induced by the quants)!" If you have the time, read the full article written by Doug Kass. I posted an update of the DJIA's long term chart today showing the DJIA's position relative to its long term trendchannel...it's at the top. (Bear in mind that trendlines drawn on long term charts are not exact and can sometimes vary by several hundred points or more.) I also posted a chart of the real estate index. It sold off precipitously at the end of the day and has the look of a head and shoulders topping pattern. If so, it may be providing a signal for the broader market indices as well. We'll see. |
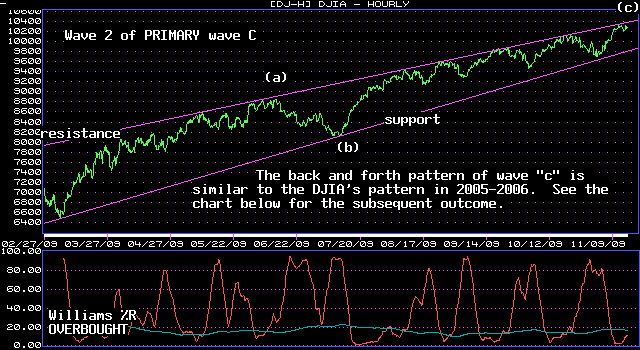
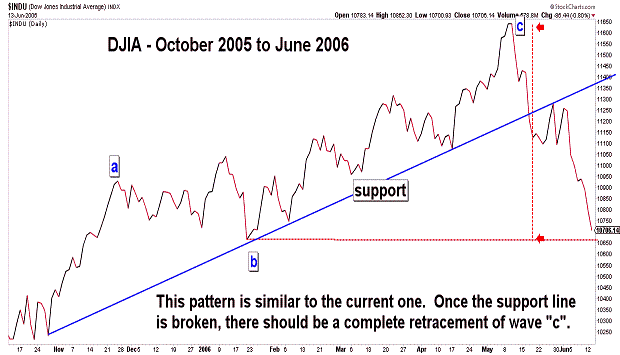
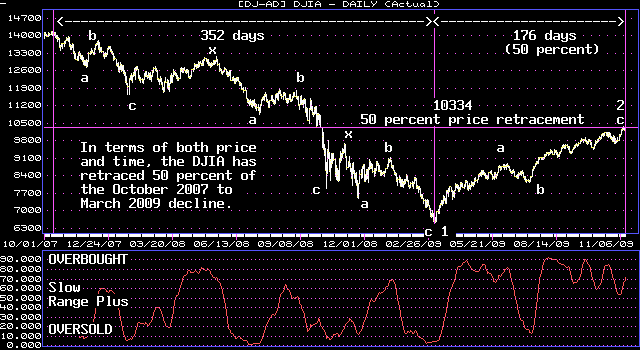
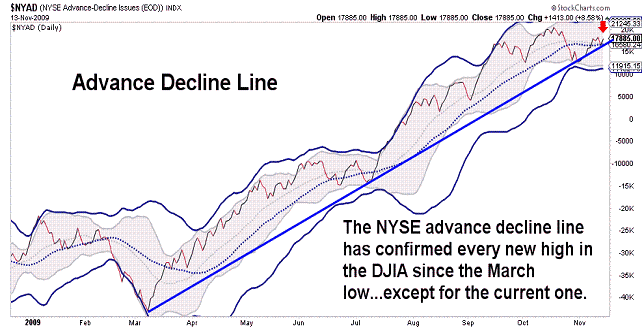
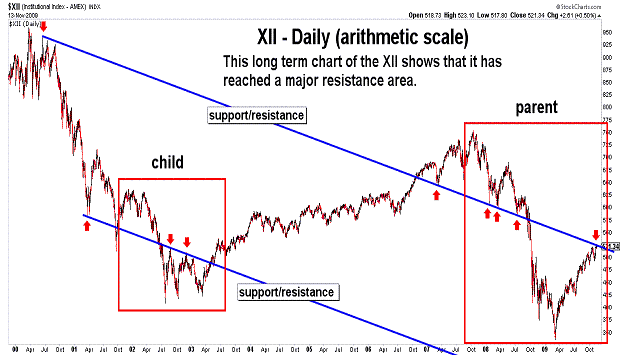
| November 13, 2009 update...Today is the third Friday the 13th of the year. The first two surrounded the March low...so, will this one follow (or preceed) a November high? This week the DJIA reached the 50 percent retracement point of the October 2007 to March 2009 decline (wave 1)...in BOTH price and time. While this does not gurantee that the rally since March is complete (wave 2)...if you combine that with the fact that the technical underpinnings of the market have shown increasing deterioration with each new high...you have to worry. But, until support is broken (currently around 9800), the market's own momentum could keep it moving higher. At this point, however, it would require breaking through substantial resistance...which the DJIA (and other indices) has so far failed to do. The second chart above shows one type of resolution given the market's choppy wave "c" pattern since July...i.e, a quick retracement. The other resolution is just the opposite...a powerful acceleration in the present upward trend...certainly this is the hope of the bulls. I don't see it...but, I have been wrong before! |
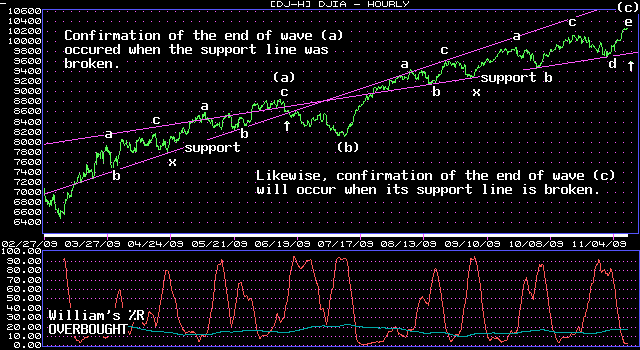
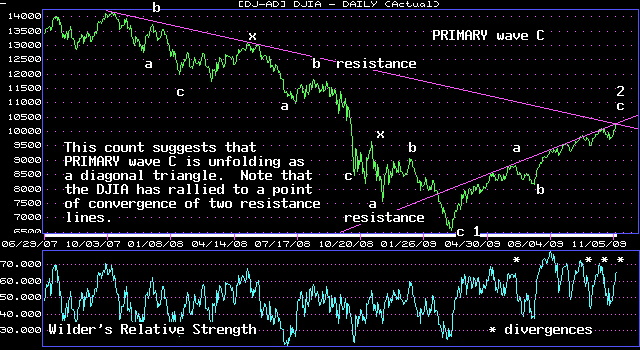
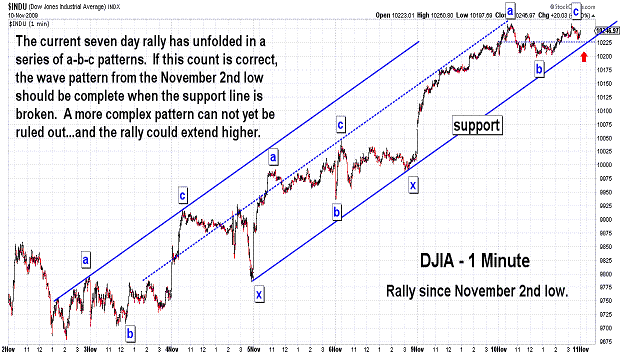
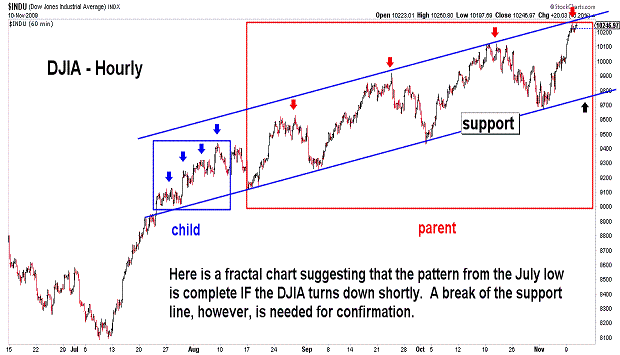
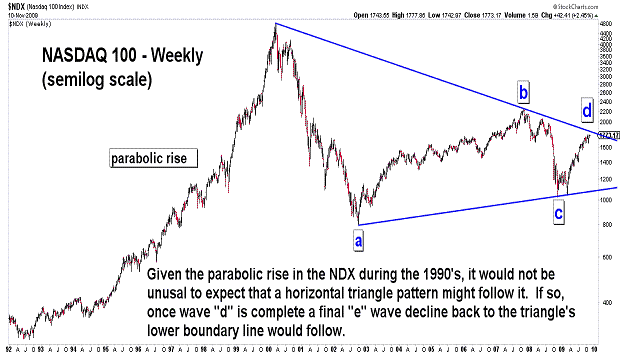
| November 10, 2009 update...The 60 Fibonacci day CYCLE has now failed in its two most recent iterations...so, I guess it will have to be layed to rest with the other CYCLES (i.e., 21/22 week...71 day) that have ceased to work during the past few months. With this week's advance, the "market" has now rallied back to the top of its rising range for the 5th time. So far, however, ONLY three of the broad indices that I follow have made new intraday highs, i.e., DJIA, XMI, and XII. A few are near their October intraday highs...but, the midcaps (S&P 400) and smallcaps (Russell 2000) are much further away given their relative weakness. On a closing basis, the DJIA is testing the convergence of two resistance lines...one long term and one intermediate term (see chart above). The weakness of the market's technical condition suggests that the DJIA should turn lower from near current levels...but, a breakout above the resistance lines would be problematic for the bearish case. This Friday will be the 176th (trading) day since the March 6th low. Timewise, that will be the (Fibonacci) 50 percent point of the decline from the October 2007 to March 2009 low (352 days). |
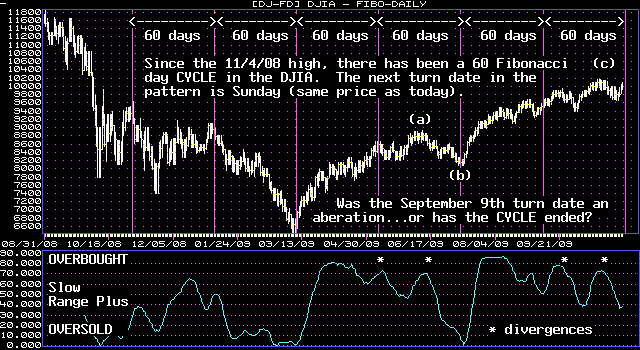
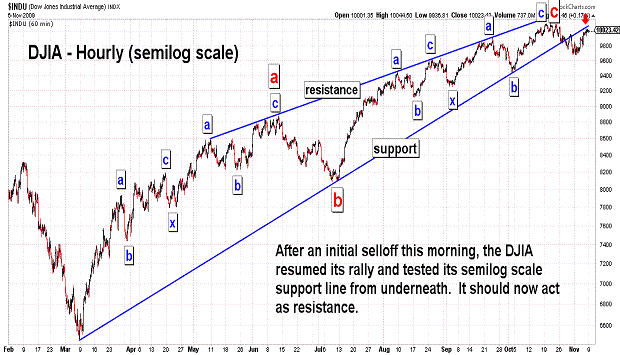
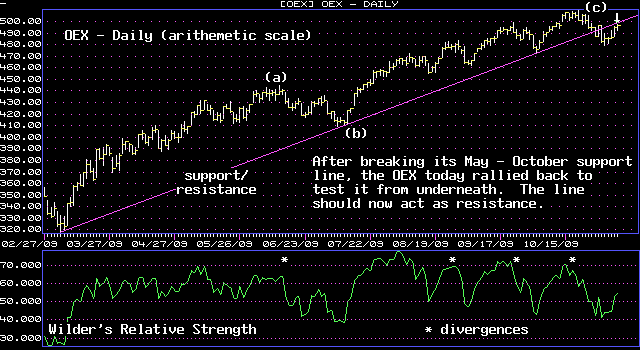
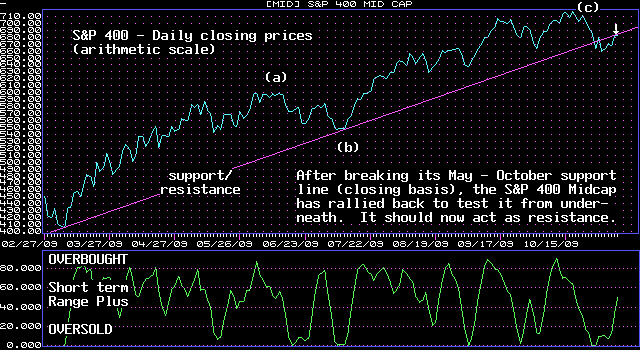
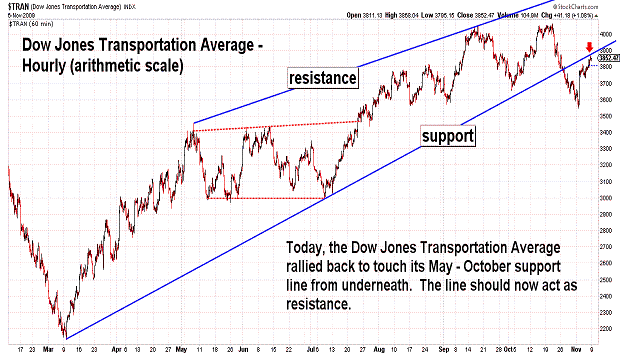
| November 6, 2009 update...Most of the major stock averages gained 3 percent or so for the week...recovering a prortion of the losses over the past two weeks. Interestingly, on a weekly closing basis, the DJIA surpassed its October 16th Friday closing high by 27 points. This sets up the possibility of adding one more technical market divergence (to the many that are already in place) if the DJIA fails to make a new intraday high next week. While it varies from index to index (see charts above), this week's rally brought a number of the indices back to test their broken May to October support lines from underneath. Assuming that the intermediate term trend has shifted to the downside, these support lines should now act as resistance. Finally, as I pointed out in Tuesday's update, the 42 day and related 60 day Fibonacci day CYCLES are upon us. The 42 day CYCLE (+/- 2) on Wednesday caught Monday's low (within 2 days). The 60 Fibonacci day CYCLE is next (November 8th)...will it be a high? |
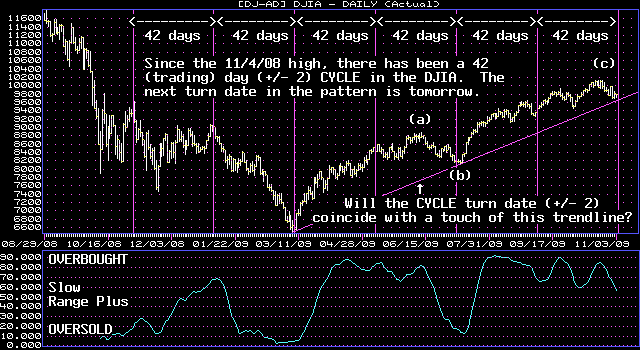
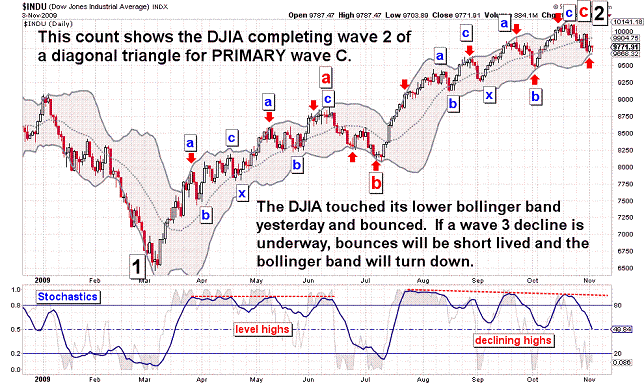
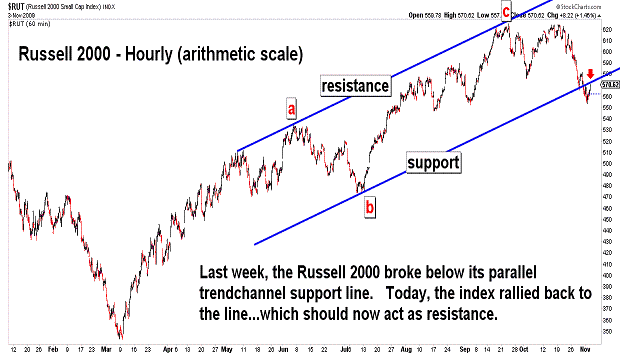
| November 3, 2009 update...The DJIA's declining pattern since its October 21st intraday high is, to say the least, sloppy. The DJIA is 100+ points above its March to October trendline...and is one of the few indices that has not yet reached it (or declined through it). On a short term basis, a number of indicators are now in oversold territory. That circumstance, taken together with the fact that a number of indices have reached their lower bollinger band on the daily chart, suggests that some type of countertrend action is likely near term. The 42 day CYCLE turn date is due tomorrow...and has been within 2 days of significant market turns since November 2008. Its related 60 Fibonacci day CYCLE turn date is November 8th. The Fibonacci day CYCLE was perfect until its last iteration on September 9th when it missed by 6 days (so keep that in mind). Hopefully, the DJIA's pattern will become more discernable by Friday's update. |
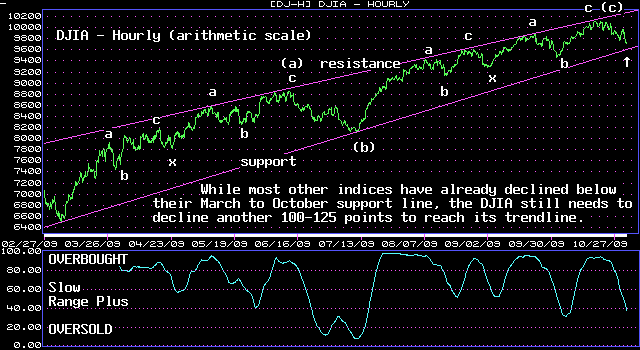
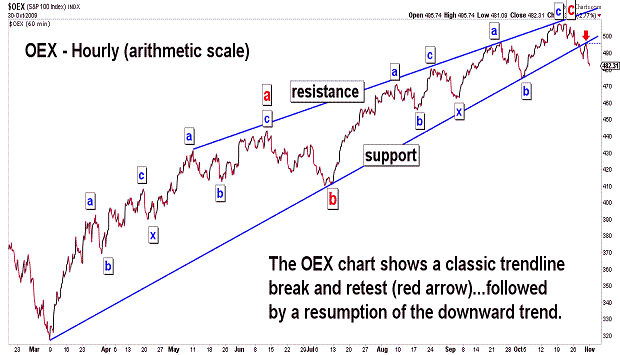
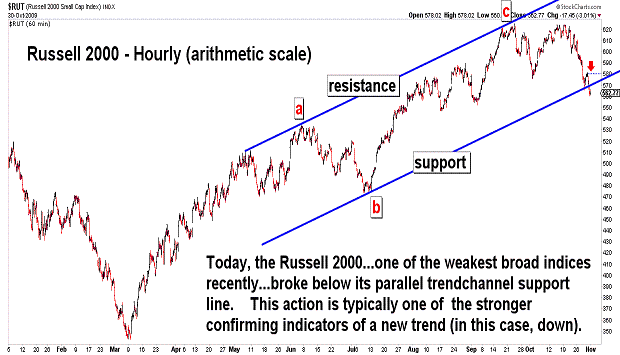
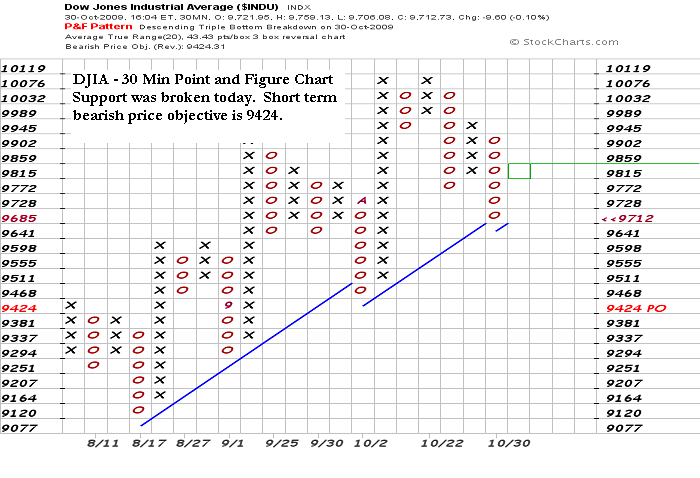
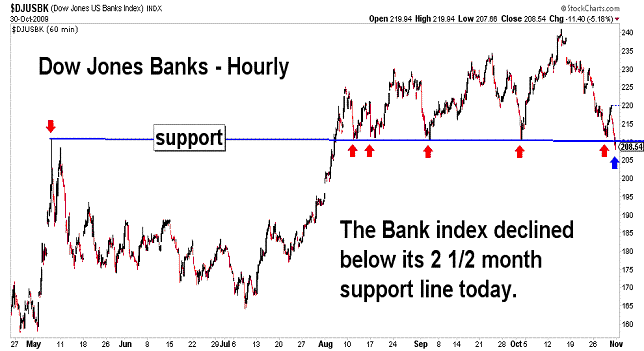
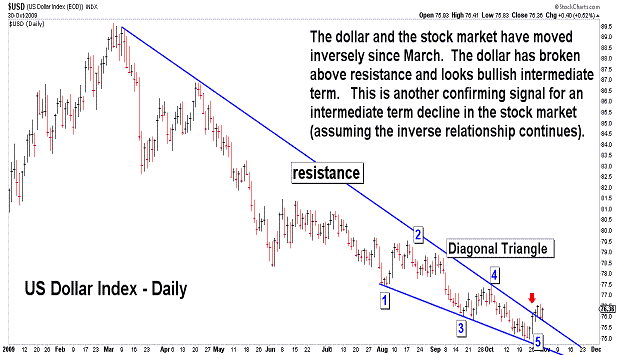
| October 30, 2009 update...Except for the DJIA, all of the other broad stock market indices that I follow closed lower for the month of October...forming key reversal patterns on those indices' monthly charts. This reversal pattern also happened in June, but the technical condition of the market is substantially weaker now than it was four months ago...this is especially the case among the smaller stocks of the Russell 2000. Last June/July the DJIA lost almost 800 points. This time (so far) the DJIA has only lost about half that amount since its intraday high last week. Compare that with the Russell 2000 which has already lost more points since its September high than it did last June/July. Maybe the DJIA will catch up in the coming weeks. (On a historical note, remember that the Russell 2000 peaked in 2007 before the DJIA.) Shorter term, the next target for the DJIA is 9600, currently the level of its March to October support line. Many of the other indices have already broken this support line (and some, like the OEX...see chart above...have retested it from underneath). Obviously, the market is not going to continue in a straight line down...more rally days like we witnessed yesterday are likely. Hopefully, the DJIA's short term pattern will clear up to make it possible to determine when the bounces are most likely to happen. Timewise, the 60 Fibonacci day CYCLE is again approaching. I'll post a chart next week. |
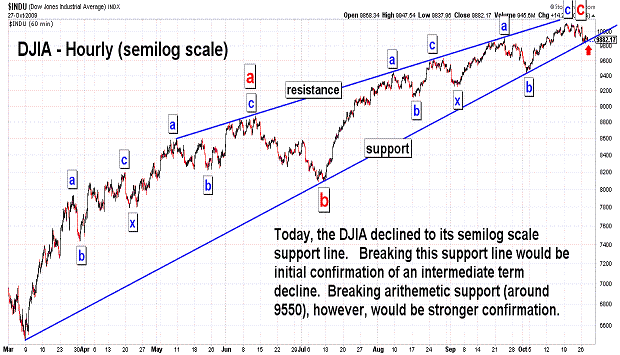
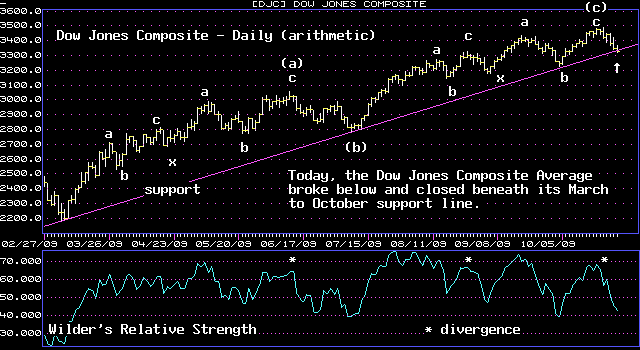
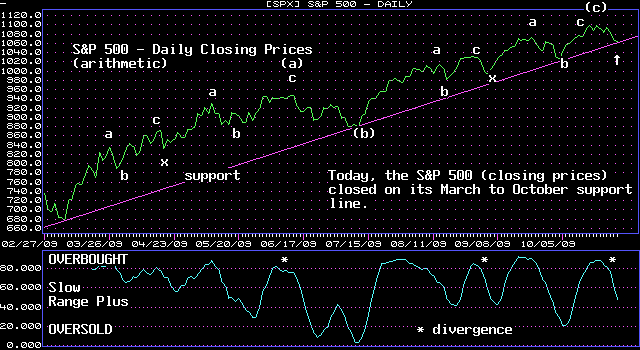
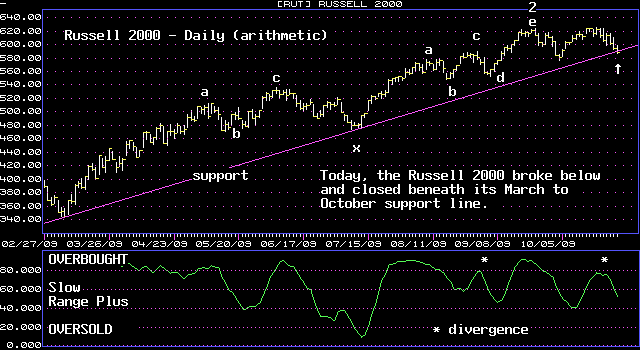
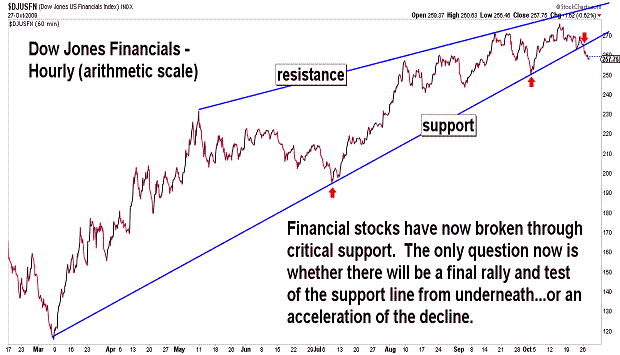
| October 27, 2009 update...While the Elliott wave pattern from last week's high is, to say the least, messy...the market as measured by the broader stock indices is either approaching, at, or has broken through the critical March to October support line. More downward action is needed, however, to confirm that the high is in place for the year...and that an intermediate term decline is underway. The DJIA did decline to semilog scale support today...but, more important arithmetic support lies about 300 points lower. Any bounce in the next few days must stay beneath Friday's high of 10072...or, the likelihood of a new recovery highs would rise in probability. Patternwise, the recent top appears more rounded than the previous three highs (since the July low)...which may be signficant. In any event, if a signficant decline is underway, any rally in the next day or two will be shortlived and quickly retraced. |
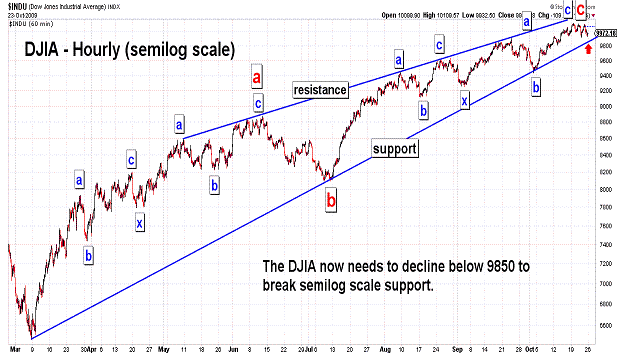
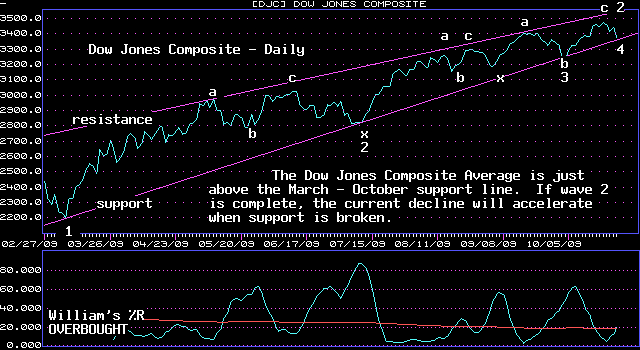
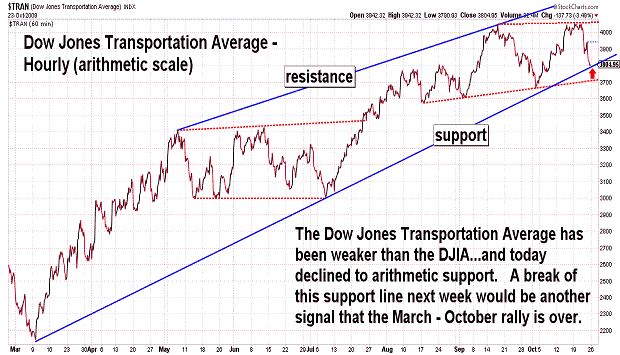
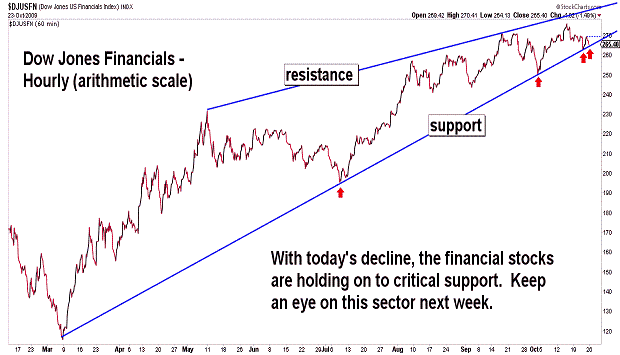
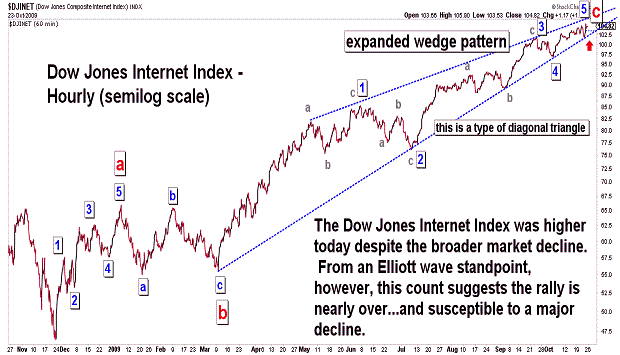
| October 23, 2009 update...Except for the NASDAQ 100, all of the broader market indices that I follow lost gound this week. Smaller stocks (in terms of the Russell 2000) were especially weak. Some of the indices (including a number of sector indices) are now near or approaching critical support. Given the current state of the market's technical condition and overly bullish sentiment, I believe that breaking the March - October support line will trigger an acceleration on the downside. This should finally confirm that wave 2 is complete and wave 3 is underway. Since my primary count suggests that the DJIA is tracing out a diagonal triangle for PRIMARY wave C, wave 3 will unfold as a corrective a-b-c type pattern. I think that it is quite likely that a retracement of most, if not all, of the July to October rally will occur as part of the initial wave lower. Of course, if the market bounces next week above today's high, then wave 2 is extending. If that should happen, I don't expect all of the indices to make new rally highs. |
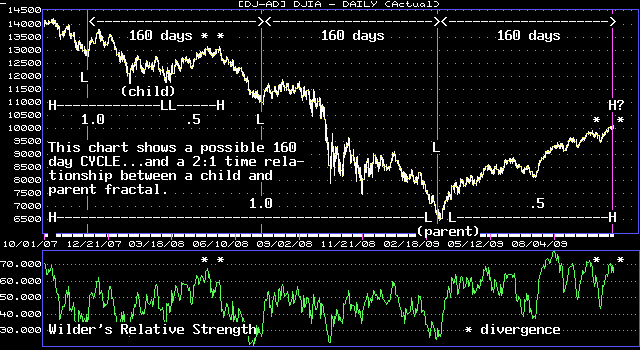
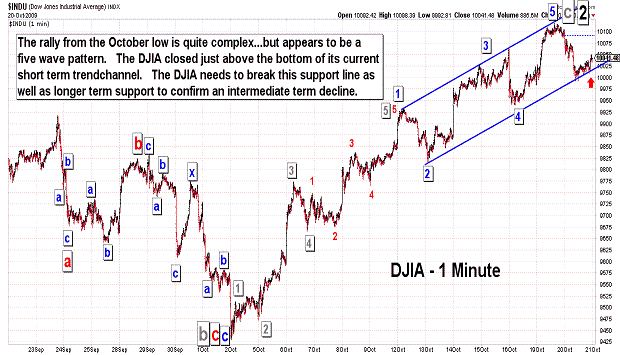
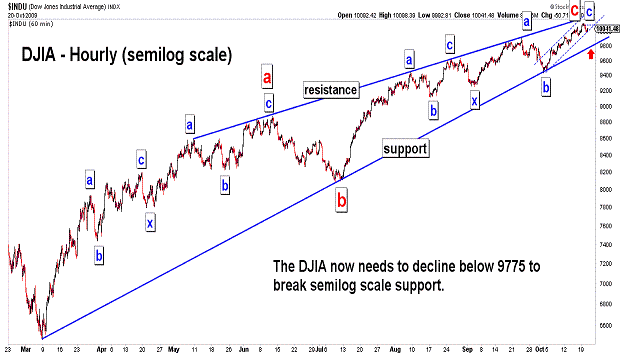
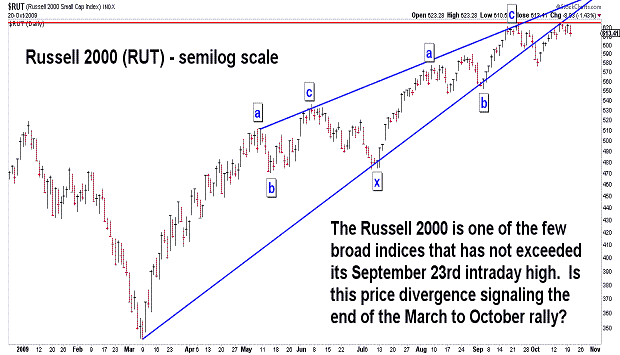
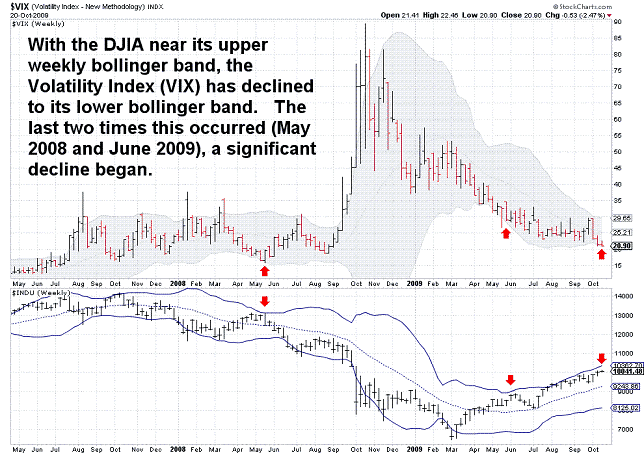
| October 20, 2009 update...The DJIA has yet to prove that the wave "2" rally from the March low is complete. Most technical measures say it should happen soon...but, each of the recent declines, including the one today, has only taken the DJIA back to short term support. I think a broad based decline of 200 points or more would signify that the intermediate term trend has shifted to the downside. Semilog scale support is currently around 9775...so, breaking that level would be additional evidence that the March to October bounce is over. Take a look at the first chart above. It relates to the fractal chart I showed last Tuesday. If indeed, the child/parent fractal realtionship exists between the noted waves in terms of pattern...the relationship also may exist in terms of time. If it does, we are now within the time window for a major trend change. |
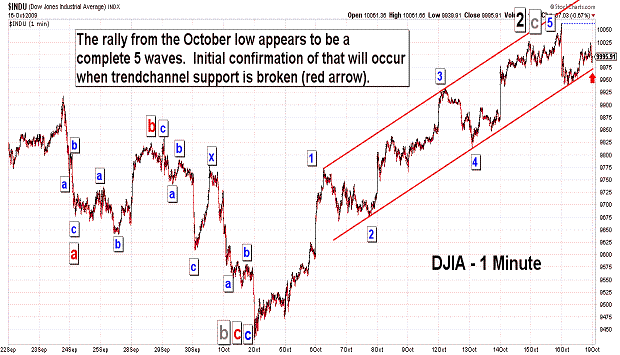
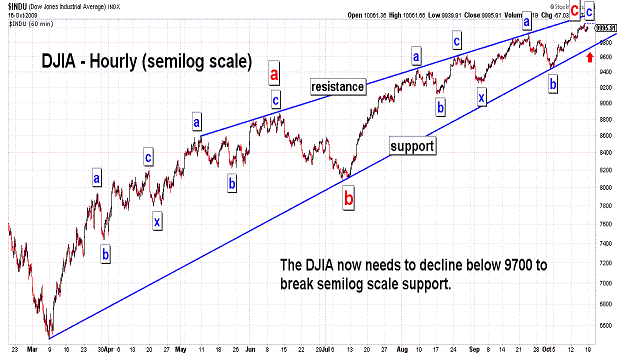
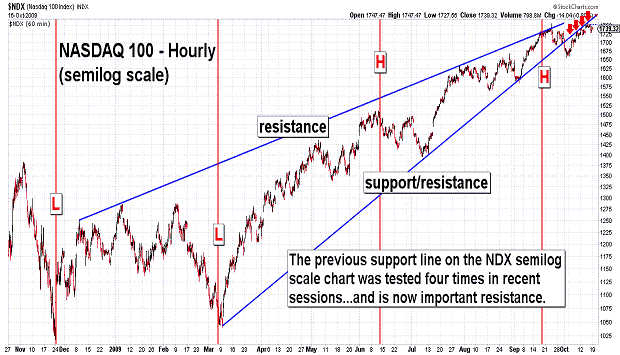
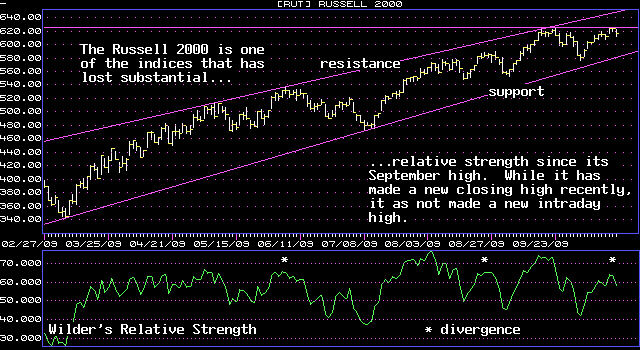
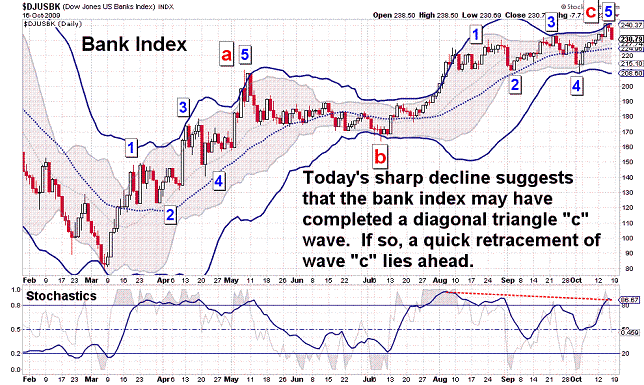
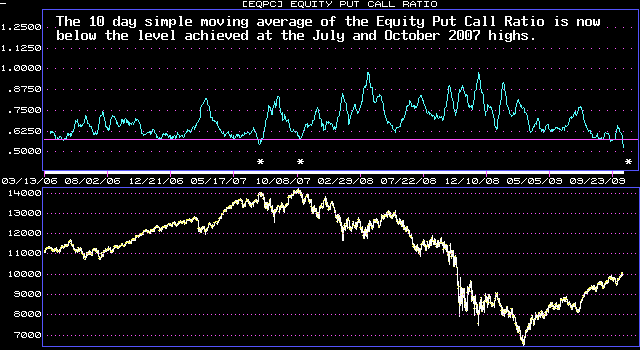
| October 16, 2009 update...The DJIA closed above the 10,000 level two days this week, but ended the week just below it. The DJIA had not closed above 10,000 since early October 2008. As we all now know, at that time it found no support there at all. It quickly sliced right through 10,000 and continued to lose another 3500 points before bottoming in March (wave 1), Since the March lows, the DJIA has been tracing out wave 2 of a diagonal triangle pattern for PRIMARY wave C (my preferred wave count). There are some other alternate wave counts...but, at this point they all suggest the same thing, i.e., that the market is ready to decline (the only difference among the wave count alternatives is how far). I have said this several times before, but for weeks now it has been a battle between market technicals and market momentum. The technicals continue to suggest that the market advance is weak...but, the upward momentum has sucked in buyers every time there is a pull back. In fact, that very thing happened today. The market was down more than 120 points at one point this morning, but rallied and only closed down 67. Talk about frustration! Most of the price divergences I discussed in the past two updates have now cleared up. One that has not is the Russell 2000. It is the one index that I follow that has not made a new intraday high above its September high. If it fails to do so next week, that may be the one indication that the intermediate term trend has finally turned downward. |
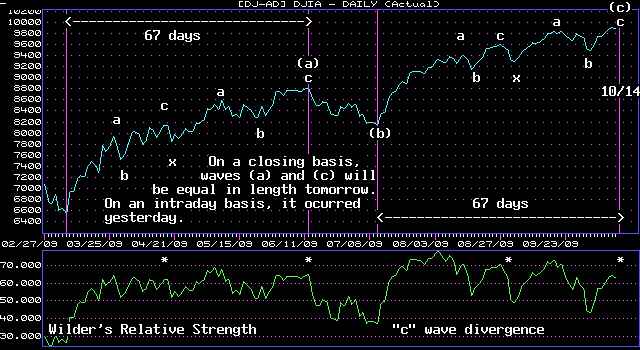
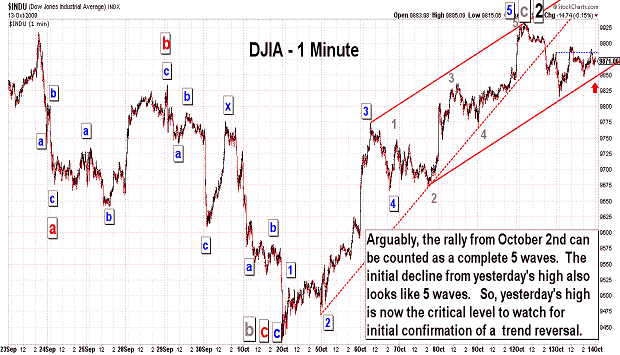
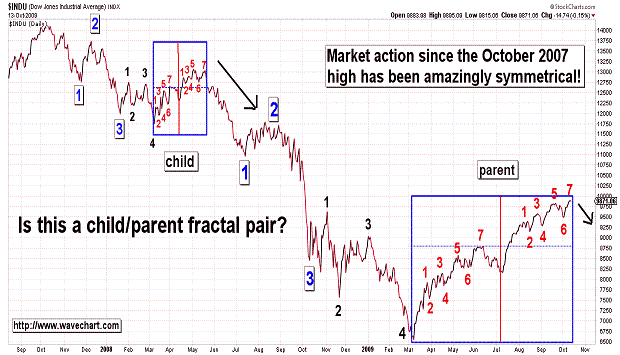
| October 13, 2009 update...As of today's close, the broad market indices are fractured (note: this could be negated with a strong rally tomorrow). This week, two indices made new intraday and closing highs: Dow Jones Industrial Average (DJIA) and Major Market Index (XMI). Four indices made new closing highs without making new intraday highs: NYSE Composite (NYA), S&P 100 (OEX), S&P 500 (SPX) and Institutional Index (XII). Others that I follow neither made new intraday nor closing highs: Dow Jones Composite (DJC), S&P 400 (MID), NASDAQ 100 (NDX), and Russell 2000 (RUT). So, the topping action that I discussed in recent updates continues. Yesterday, the rally from the July 8th low (wave "c") reached 67 trading days...equaling the length of the rally from March 6th to June 11th (wave "a"). Tomorrow, the same will occur on a closing basis. We now have symmetry between waves "a" and "c" of PRIMARY wave 2 in terms of both time and pattern. Speaking of symmetry, I created a fractal based chart of the DJIA going back to the October 2007 high. If indeed there is symmetry in the market, this fractal chart indicates to me that we are on the brink of a major decline (PRIMARY wave 3). We'll see if the pattern continues to work. If it fails, fractal rules suggest a new pattern is underway. |
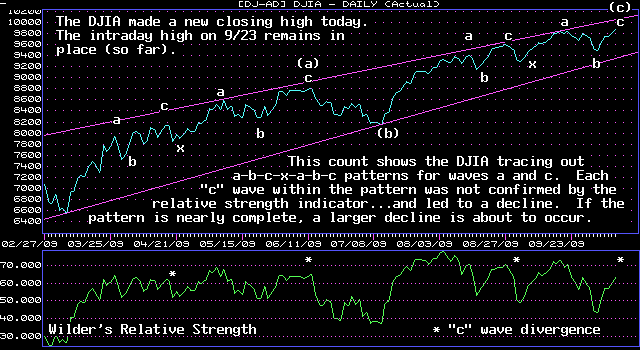
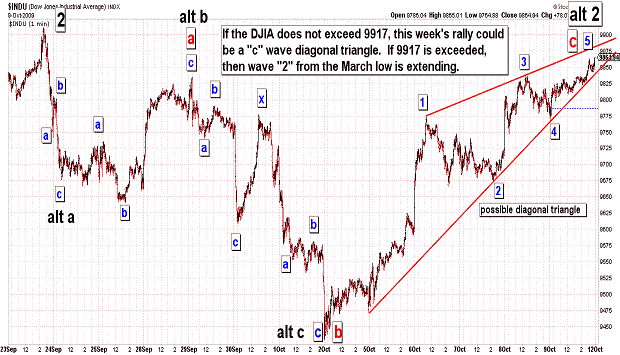
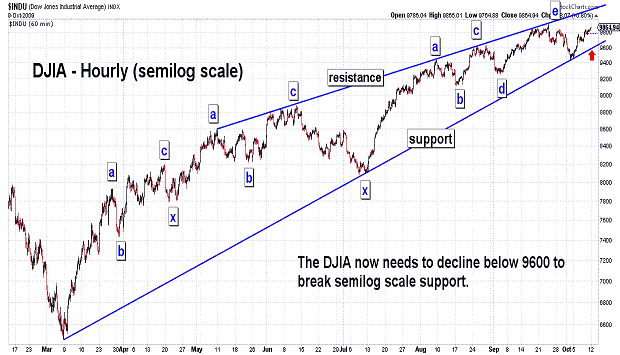
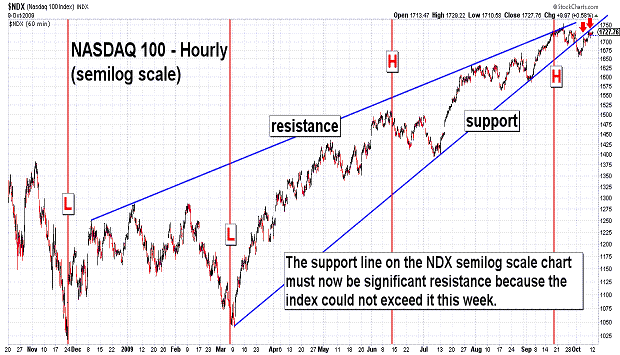
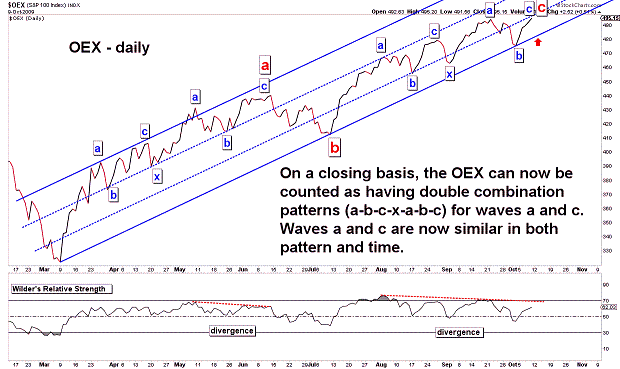
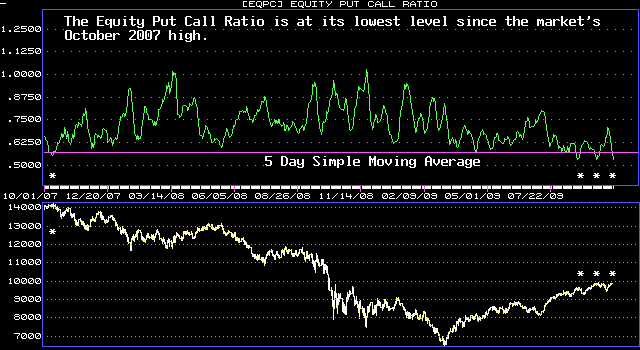
| October 9, 2009 update...Four indices that I follow made new closing highs today: Dow Jones Industrial Averge (DJIA), S&P 100 (OEX), Institutional Index (XII) and Major Market Index (XMI). None of these indices, however, exceeded their intraday highs of Sepember 23rd. Other indices...including the Dow Jones Composite Average (DJC), S&P 400 (MID), NASDAQ 100 (NDX), NYSE Composite (NYA), Russell 2000 (RUT) and S&P 500 (SPX)...did not exceed either their previous intraday or closing highs. So, we now have a significant number of price divergences in place among the broad market indices...which will probably be resolved early next week. Given the CYCLE turn window that occurred two weeks ago and the weakening technical condition of the market I would expect the market to turn lower. But, let's face it...this market has been resilient...and, for the past several months, the buyers have taken charge every time the market has any type of mild decline. I wish I could rule out the possibility of an extension of the recent rally, but I can't...since there are some complex topping patterns out there which theoretically could take weeks to complete. I have drawn some important support lines on the charts above. Until they are broken and a downward trend is confirmed, some flexibility is required. Keep an eye on the VIX...it is now dropping precipitously and may issue a sell signal if it continues to decline next week. Sentiment indicators, i.e., put call ratios, have already given a sell signal. |
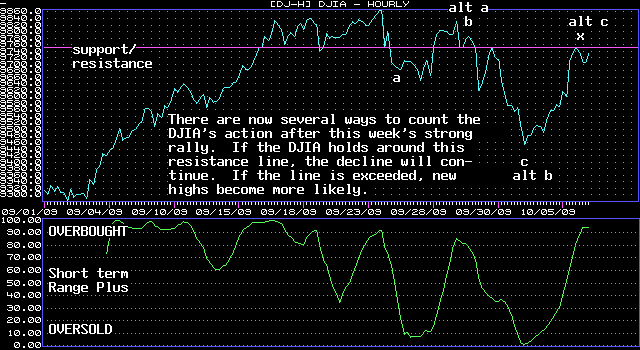
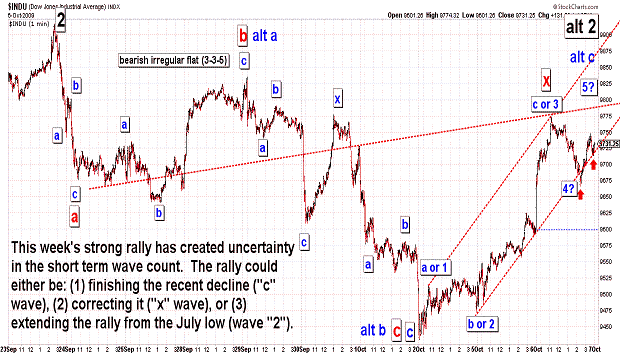
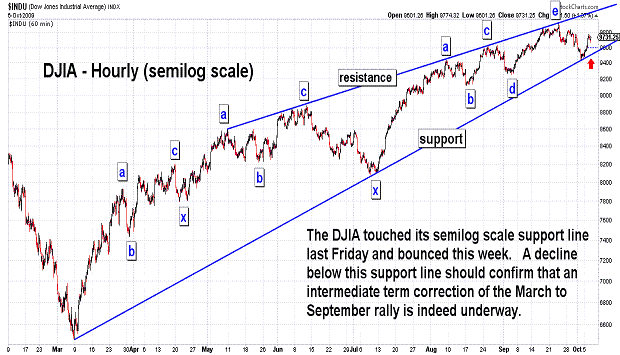
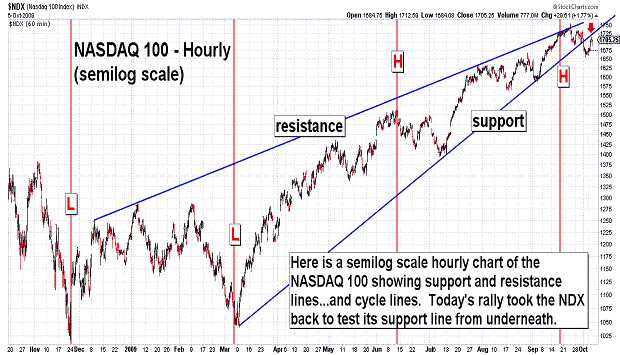
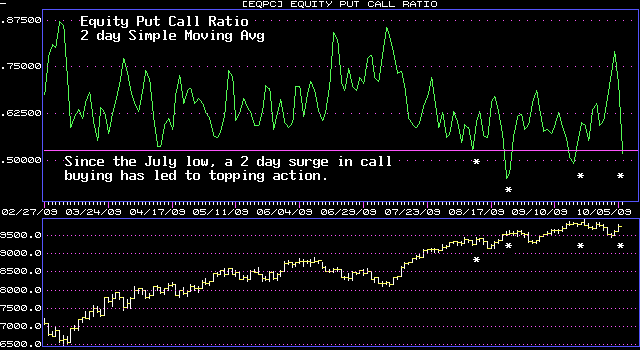
| October 5, 2009 update...On Friday, I mentioned that "the DJIA tested its lower Bollinger band on the daily chart...and bounced." That bounce continued yesterday and today...with the DJIA gaining about 2 1/2 percent. The two day rally has taken the DJIA to an important resistance area...which, if exceeded (more than just nominally), is likely to force me to change the intermediate term wave count. A new rally high becomes probable. If it holds, the decline should continue and important support lines should be quickly broken. One thing I noted today in the DJIA's pattern since July is that the largest hourly decline during any rally phase has been 115 points. Accordingly, any hourly decline below 9634 increases the odds that the intermediate term decline is still ongoing. A close below 9500 will break semilog scale support (see third chart)...and (IMO) lead to a test of arithmetic support around 9250-9300. |
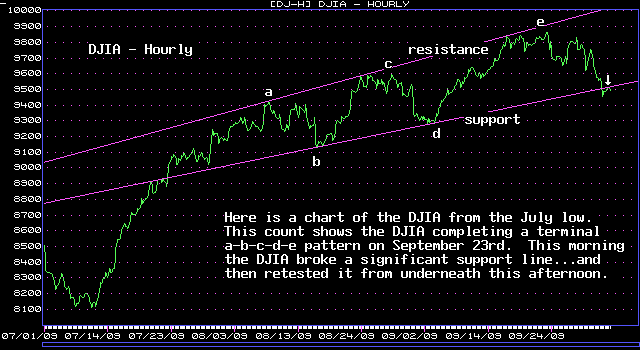
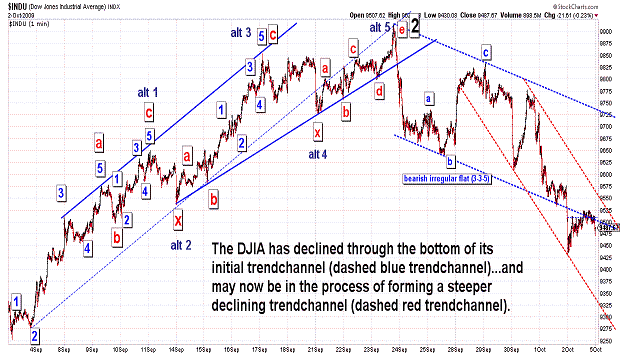
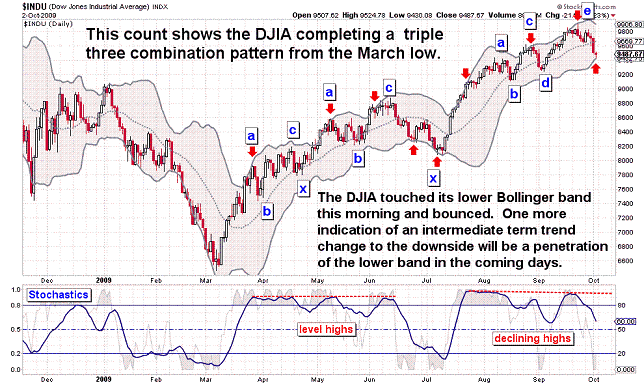
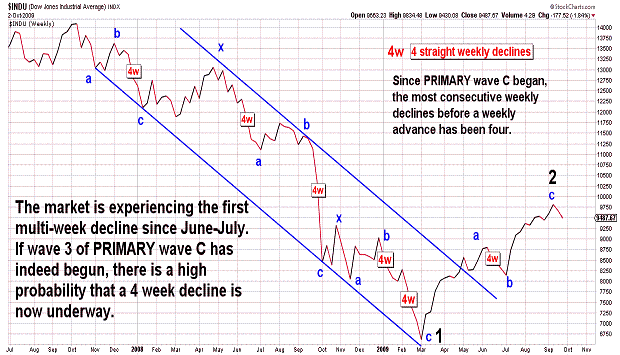
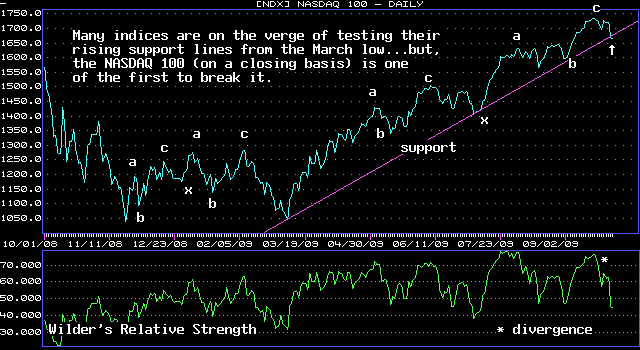
| October 2, 2009 update...On Tuesday I said: "What's needed now to really confirm an intermediate term decline is a massive down day...with a low significantly below last week's low (9641)." Well, that did occur (finally) yesterday! And, it occurred accross the board...in all of the major stock indices. For the first time since the June/July correction, the market declined for a second consecutive week. Price, pattern and time parameters pointed to an intermediate term market turn last week (see recent updates)...and it is looking more and more like that is indeed the case. The support line from the March line is the next target for this decline...and breaking it should be the final nail in the coffin of the March to September rally (on a closing basis, the NASDAQ 100 broke that line today). Note that the DJIA tested its lower Bollinger band on the daily chart today...and bounced. That is very common. The bands are quire narrow at the moment and the market will have to accelerate its downside force to widen the bands and turn them downward. When that happens any bullish support underneath the market should dissipate until the bands are tested on the longer term (i.e., weekly, etc.) charts. |
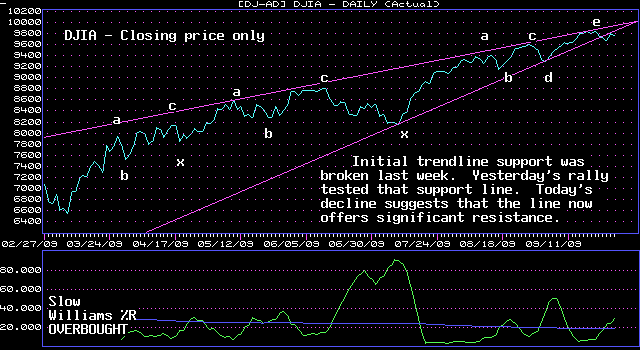
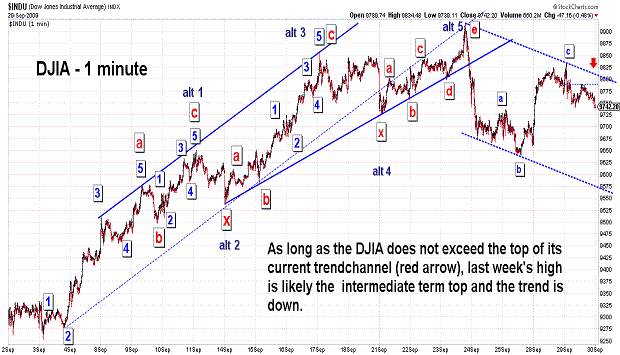
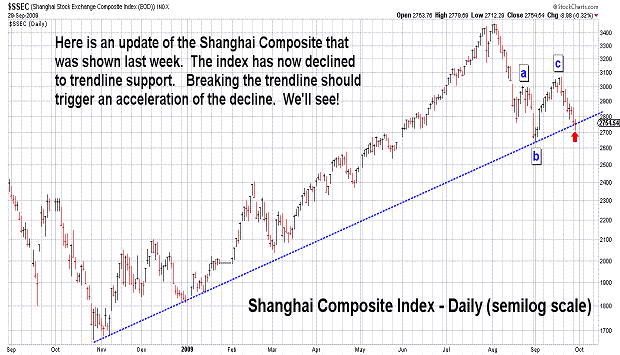
| September 29, 2009 update...As long as yesterday's rally was merely countertrend to the decline that began last week, I think an intermediate term decline has begun. The key level at tomorrow's open is 9810 (red arrow on second chart). That level cannot be exceeded...or something else is probably unfolding. What's needed now to really confirm an intermediate term decline is a massive down day...with a low significantly below last week's low (9641). The 15 minute point and figure chart suggests the initial level to break is 9585. With the Shanghai Composite on the brink of breaking intermediate term trendline support...hopefully the wait will not be too long! |
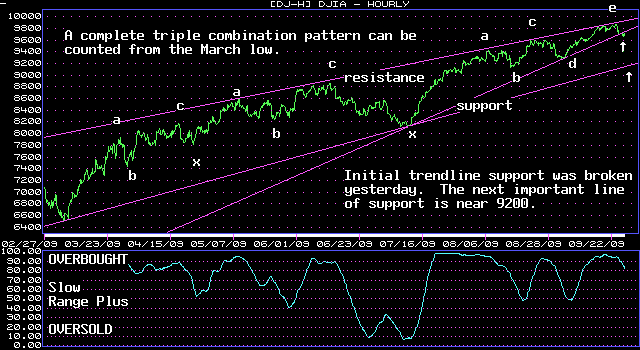
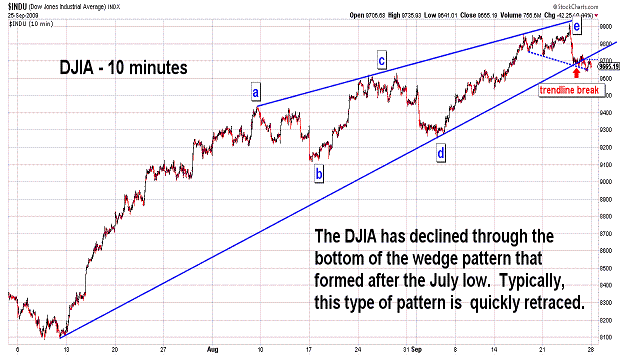
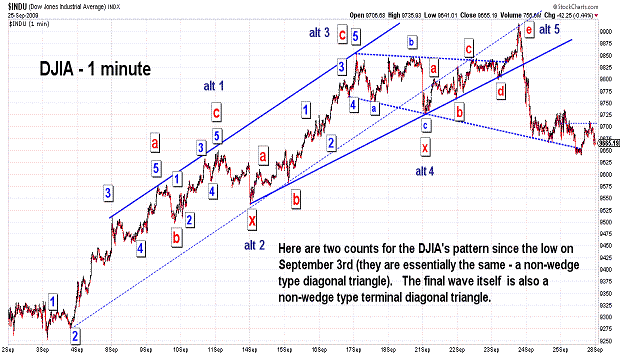
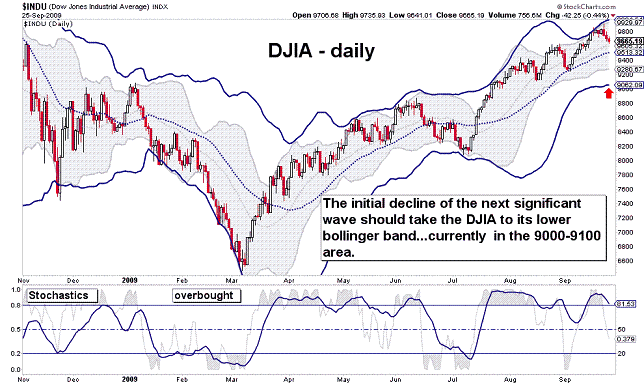
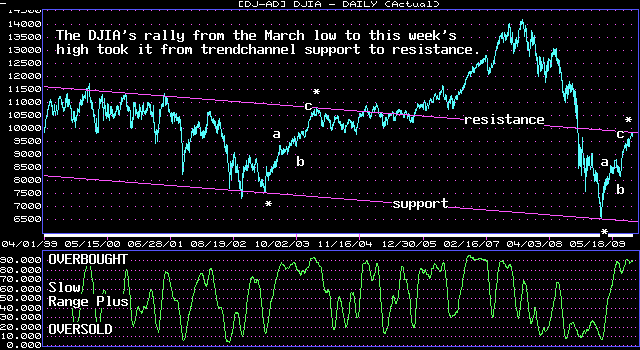
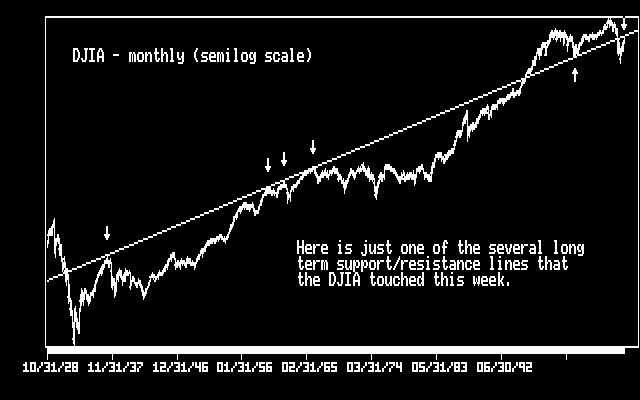
| September 25, 2009 update...On Wednesday, price action finally joined pattern and time in signaling an intermediate term trend change. By week's end the DJIA was down 155 points...with a key reversal pattern nicely formed on the weekly chart. A three wave corrective pattern from the March low can now be clearly counted as complete. If this pattern is counted as the second wave of a diagonal triangle pattern for PRIMARY wave C (one of several possibilities), then the next wave will be another corrective wave (wave 3) back toward the March lows. As of now, I do not think that the March lows will be violated...but, things can certainly change as the pattern unfolds. It is much too early to predict precisely how the next wave is likely to unfold. I can only say that it will be of the three wave corrective variety. Since the daily and weekly bollinger bands provided significant guidance during the rally from the March lows...it is likely that they will provide similar guidance during the forthcoming decline. By the way, I found it interesting to observe that even long term trendlines from the 1930's can now be drawn showing resistance at this week's high. |
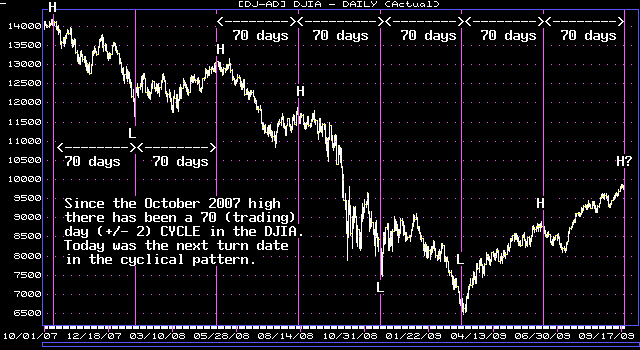
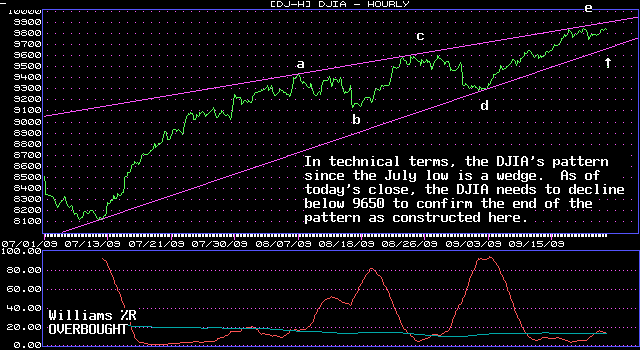
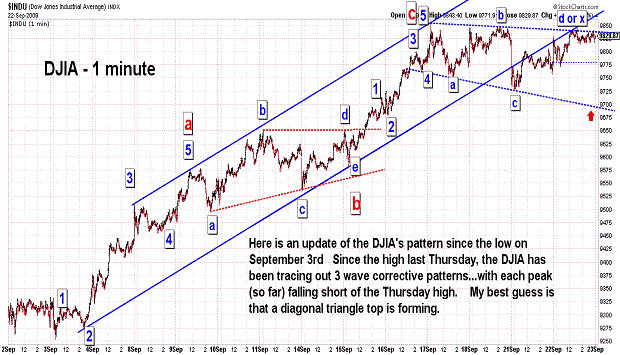
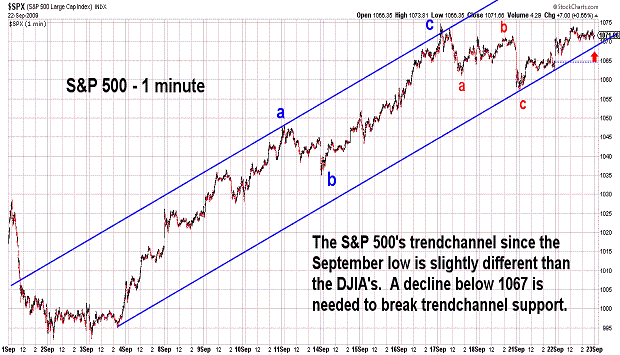
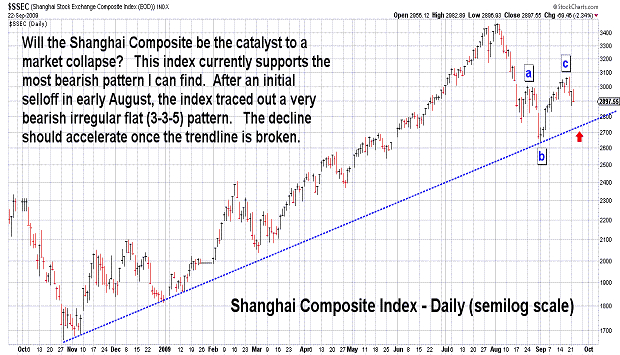
| September 22, 2009 update...Over the past several weeks, I have posted charts of various market CYCLES and their turn dates...some of which appear to be no longer effective...others of which are still waiting for confirmation. Well, one of the CYCLES that has worked consistently (+/- 2 days) since the October 2007 high came due today. That was the 70 (trading) day CYCLE. (There is a variation of this CYCLE: the 71 day CYCLE of closing prices that turns next Tuesday). So, the time is ripe for an end to the rally since early March. Given that the intermediate term pattern looks complete (to me)...and, sentiment, in terms of the put call ratios, is overly bullish...we only await clarification of the short term pattern and the necessary price action to confirm a reversal. Waiting for the market to ring the bell has been tortuous over the past several days...as the market meanders within a narrow range. In fact, this action caused the VIX to drop over 4 percent today...it needs one more sharp drop below its lower Bollinger band to generate a sell signal. |
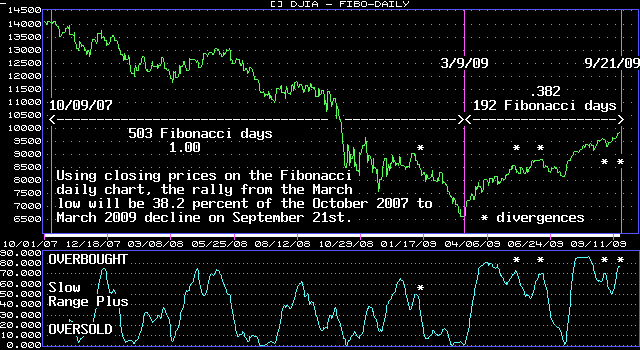
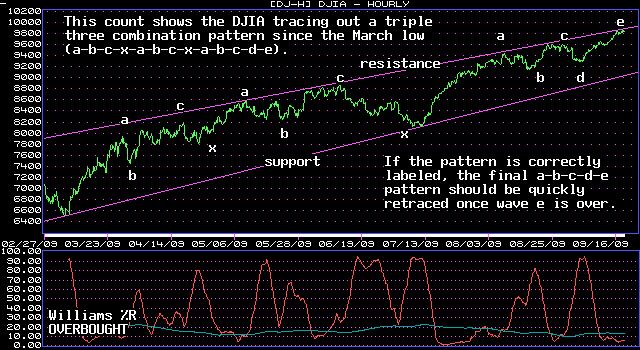
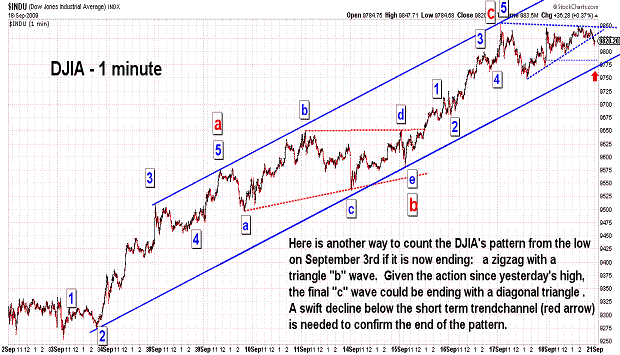
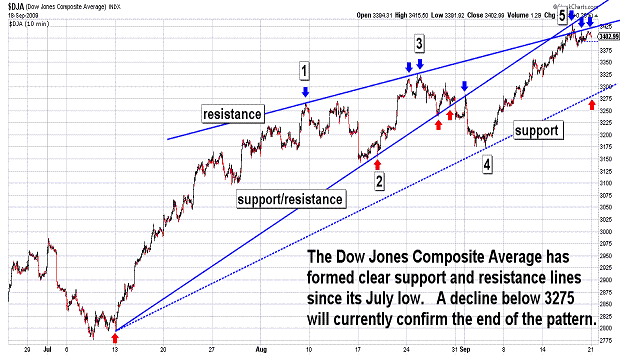
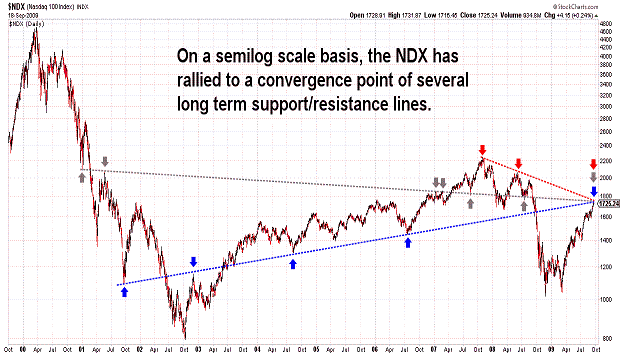
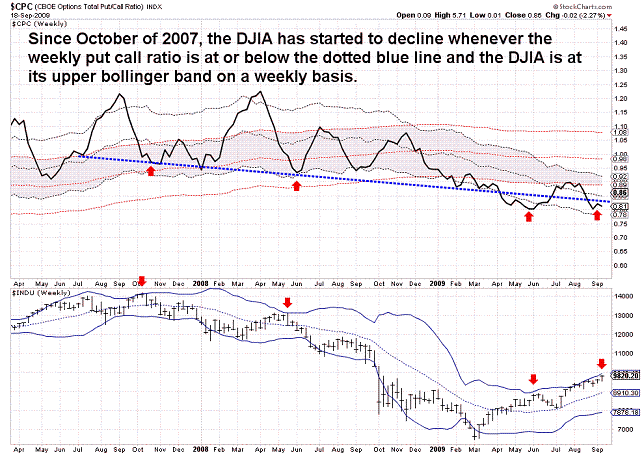
| September 18, 2009 update...Although the DJIA failed to exceed yesterday's intraday high during today's session, it did mangage to close at a high for the week. The market continues to produce many extremes and divergences among various indices and technical indicators...but, it did not give any classic price signals of a major reversal. As I have discussed in recent updates, various cycles and Fibonacci time periods suggested that this was the week for a reversal. Since price patterns from the March lows were completing, a reversal seemed to be almost a slam dunk. Unfortunately, price action itself did not deliver the goods. On Tuesday, I said a clue to a reversal would come from "the market's action itself...because the action following the completion of a diagonal triangle should be sharp and violent in the opposite direction." That did not happen. Instead, the market, since making a high yesterday morning, has meandered in a narrow range. Market's often change direction with the changing of the season. Last year, the market experienced an acceleration of its decline right after the Fall Equinox. Maybe, history will repeat itself. |
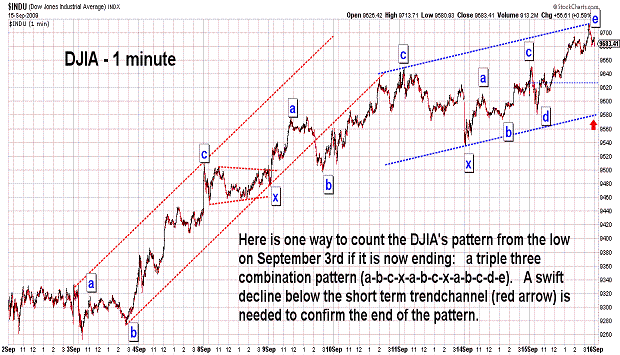
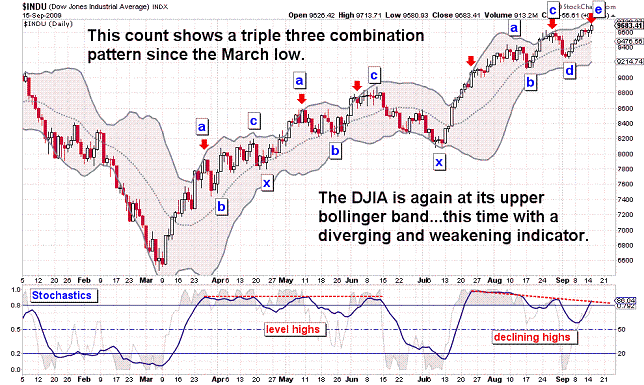
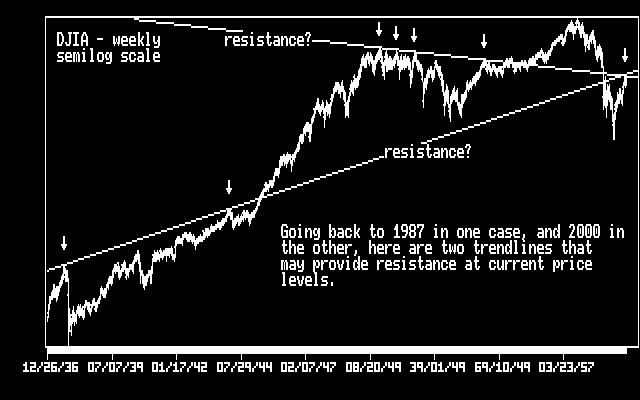
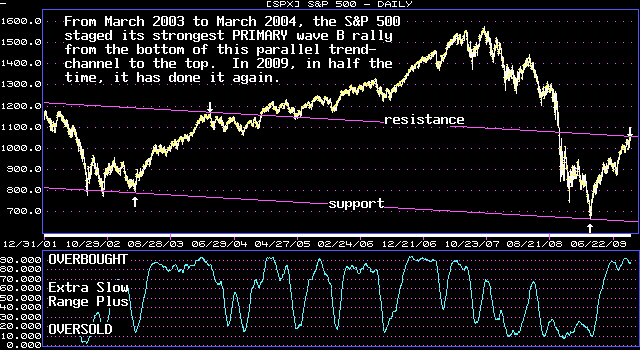
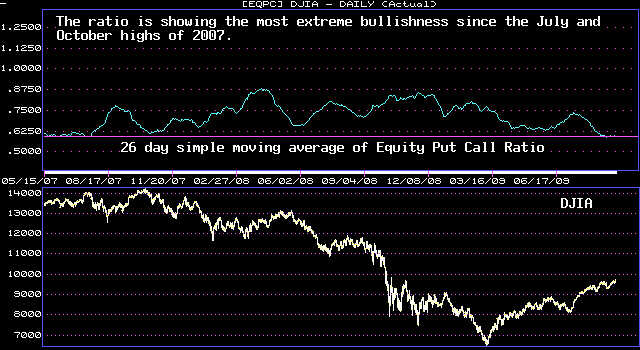
| September 15, 2009 update...As I have discussed since last week, the markets are now moving through a time window that suggests a major reversal is at hand. In terms of the Elliott wave pattern, I believe that the DJIA has traced out a diagonal triangle pattern since the July low. Last week I said that the DJIA had not yet "...(argueably) traced out a three wave pattern for the fifth wave (which is required)." Today's rally and higher close fixes that problem and makes the 5th wave a clear three wave pattern. The 5th wave pattern could still extend and become more complex...but, I think a decline below yesterday's low of 9535 should be enough to confirm the turn lower. A better clue will be the market's action itself...because the action following the completion of a diagonal triangle should be sharp and violent in the opposite direction. Mild corrective action would make me suspect that something else is transpiring. I posted some longer term charts in today's update to show how the rally since the March low is now up against some significant resistance lines. We'll see shortly if they still have a role to play in terms of the market's long term pattern. |
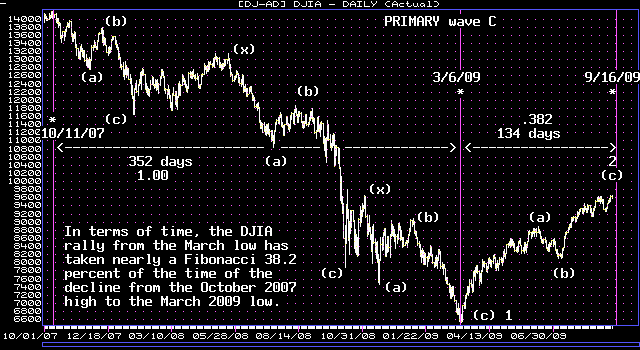
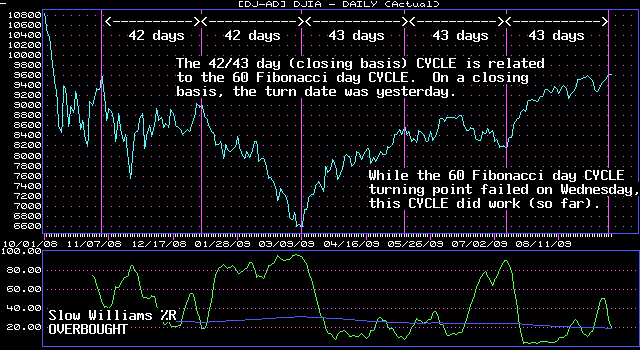

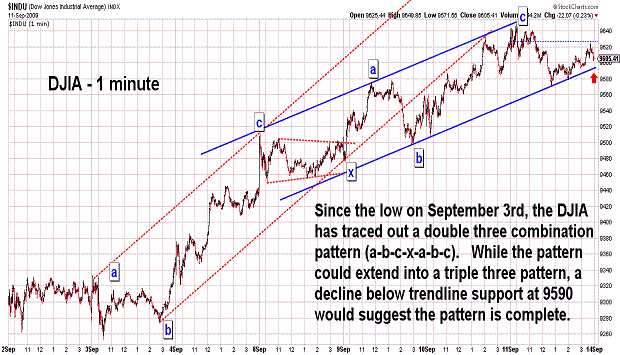
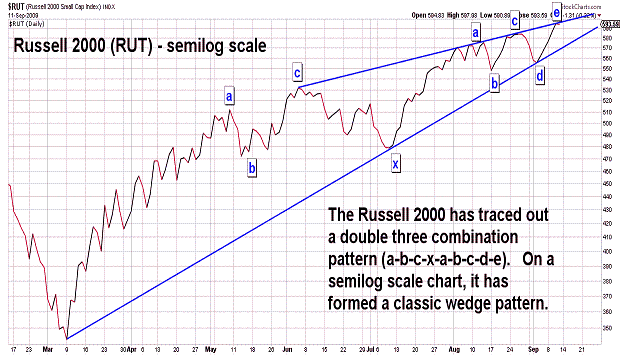
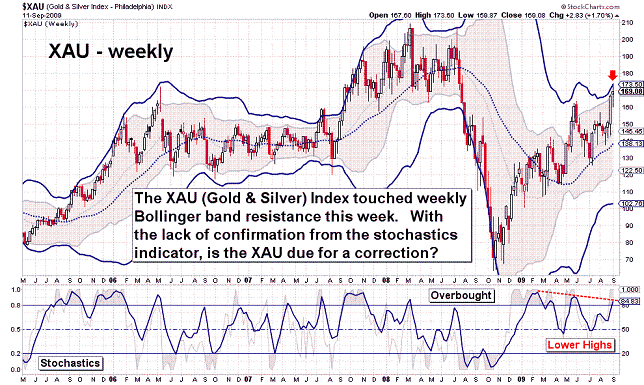
| September 11, 2009 update...As the first three charts suggest, the market is currently within a time window that calls for an important reversal. In addition to daily and weekly cycles that occur this week and next, the DJIA is fast approaching a Fibonacci 38.2 percent time relationship between the current intermediate term rally and the preceeding long term decline from October 2007 to March 2009. Given that the DJIA...and other indices like the Russell 2000 (see chart above)...have completed Elliott wave patterns...with a majority of technical indicators showing extremely overbought conditions and Bollinger band resistance levels (both daily and weekly) being reached, it is hard to see what will keep the market moving higher any longer. Over the past six months, the market's own momentum has been its strongest propellant...and that has caused a shift in sentiment from extreme bearishness to extreme bullishness (just compare the number of bullish vs bearish analysts now on CNBC). On a fundamental note, back in 2002-03, the market continued its corrective action until the unemployment rate stopped rising. I expect the same to occur this time as well. |

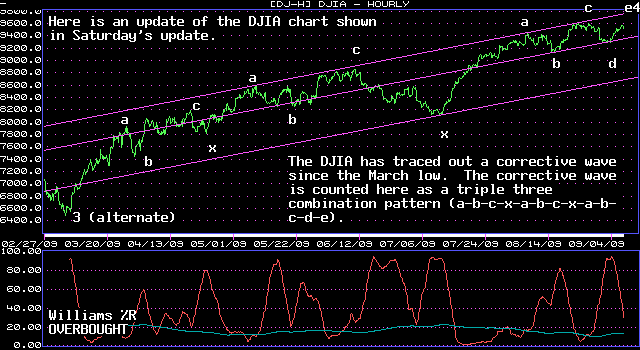
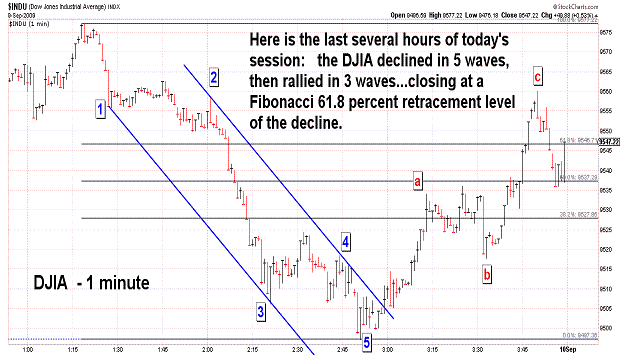
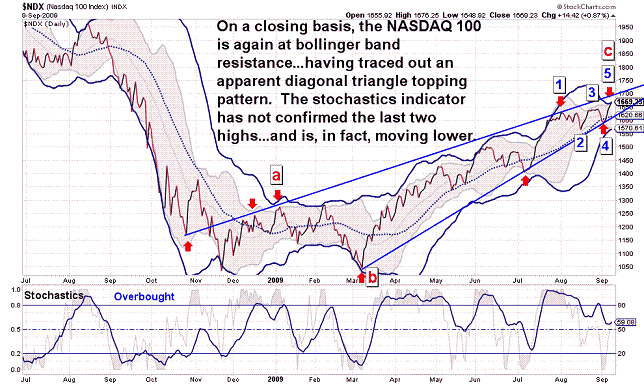
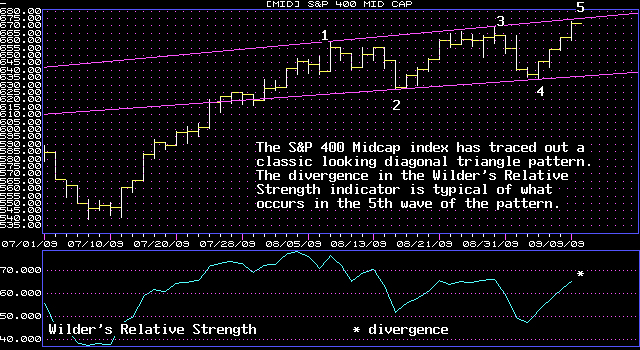
| September 9, 2009 update...Elliott wave analysis involves the examination of relationships between price, pattern and time. Today was a date that I have focused upon for the past few weeks, i.e., the 60 Fibonacci day CYCLE turn date...which has produced important market reversals each of its last five iterations. Will it do so again? Maybe...but, there is a possible fly in the ointment (at least to me) right now...namely, price and pattern. When I first suggested today as a possible turn date I also suggested that the DJIA would reach this date by tracing out a diagonal triangle pattern. While a number of indices (like the S&P 400 - see chart above) have traced out such a pattern, the DJIA (among others) has not. The DJIA has not exceeded the third wave of the pattern...nor has it (argueably) traced out a three wave pattern for the fifth wave (which is required). It could be that the DJIA (and other indices that did not make new highs today) topped out at the end of August and are tracing out different patterns...which also will lead to the substantial decline that I believe is coming. I dislike hedging here, but I think it is important to, at least, mention that there is a possibility that a final top is not yet in place. The 85 week CYCLE turn window occurs next week...and, if it is still functioning, may invert and produce a high (rather than the lows it has delivered since 2003.) We'll see! |
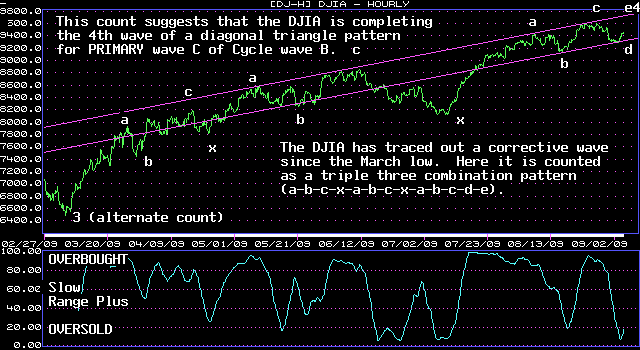
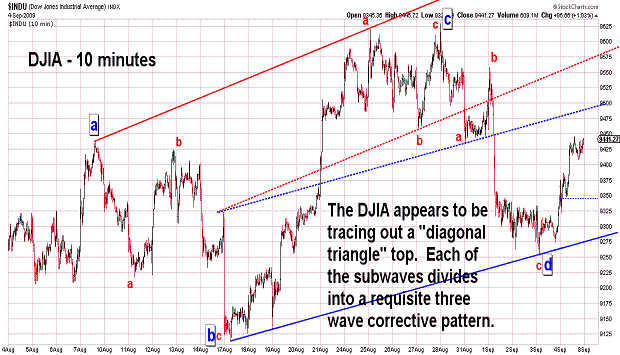
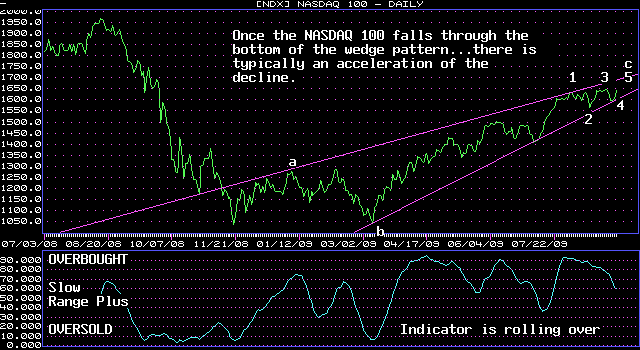
| September 5, 2009 update...On August 21st, I first conjectured that the DJIA could trace out a diagonal triangle top into the Sepember 9th Fibonacci 60 day CYCLE turn window. With the ocurrence of the past two day's 160 point rally that possibility is looking more likely (at least more likely than it did on Wednesday). If, in fact, the market does rally following the Labor Day holiday...watch for important divergences to occur between various market indices, as well as among various market indicators. The hallmark technical characteristics of a market turn would then be in place...together with the alignment of the Elliott wave elements of price, pattern and time. |
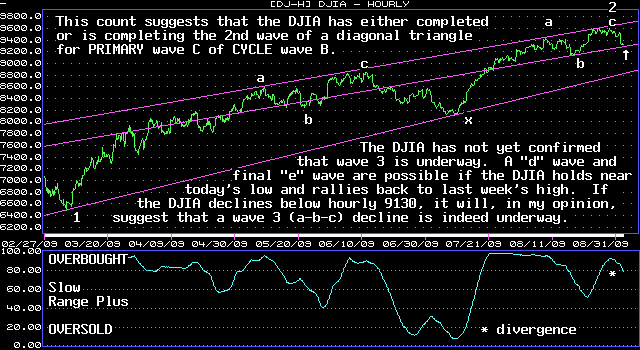
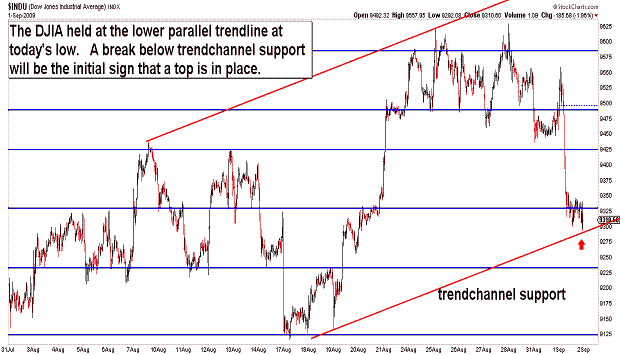
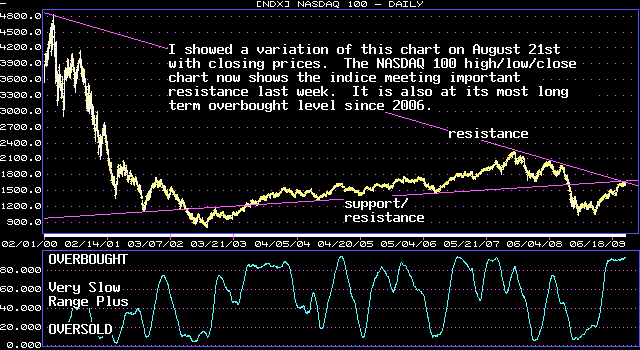
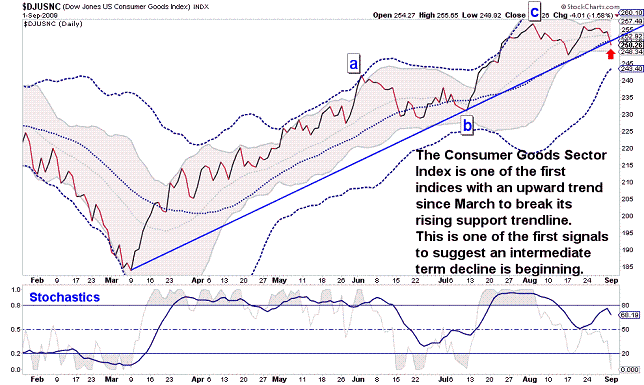
| September 1, 2009 update...The new month began today with a sizeable across the board sell off. I said on Friday that last week's high could be an important top...but, that it would "...only be confirmed, at this point, by a decline below the August 17th low (9116)." Today's decline only took the DJIA to 9292. As the second chart above shows, the DJIA held at the bottom of its short term trendchannel. If it continues to hold and the DJIA rallies, today's low could be the 4th wave (or "d" wave) of a diagonal triangle pattern. If today's low fails to hold, the odds increase that last week's high will not (in the near term) be exceeded...but, it would be best, in my opinion, to wait for a decline below 9116 to conclude that the top is in place. The 60 Fibonacci day CYCLE may play a part here if, in fact, it is still functioning. It is now only 5 trading days away. Market indicators and sentiment have been forecasting a top for some time now...so, it is possible that the turn date will be less significant than its six previous iterations. We'll see! |
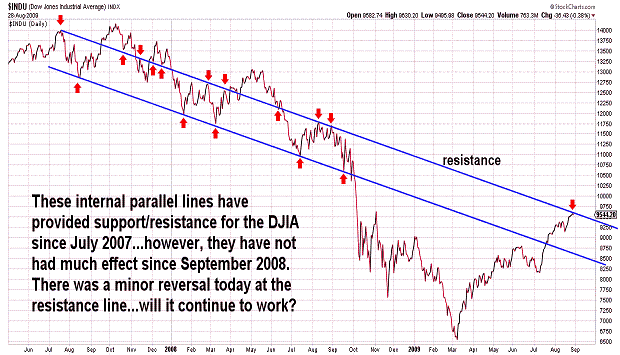
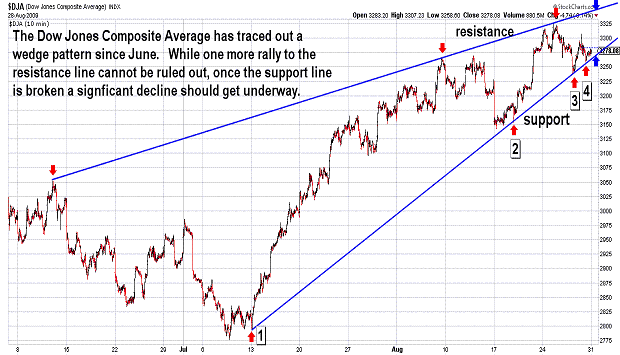
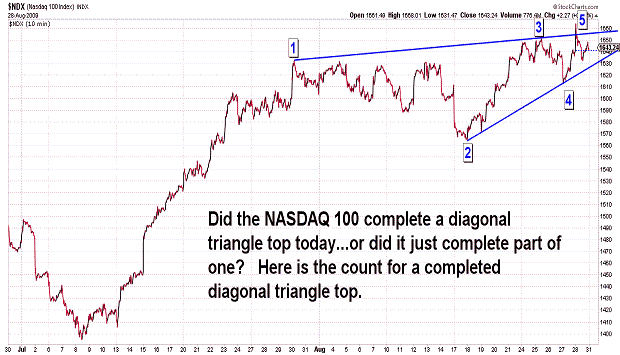
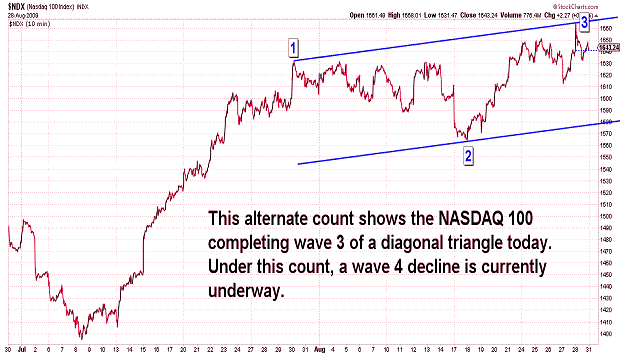
| August 28, 2009 update...For the week, the stock market was mixed...most indices were nominally higher, but a few ended nominally lower. The DJIA closed the week just 5 points from Tuesday's close...so, not much has changed since Tuesday's update regarding my opinion that an important top is forming. Timewise, the week of September 9th would seem to be the most logical for a final top...given the ocurrence of the 60 Fibonacci day CYCLE. Patternwise, is it possible to count a top at today's high...but, that could only be confirmed, at this point, by a decline below the August 17th low (9116). Pricewise, there are a number of resistance lines running through today's high. Also, today's high was only 23 points away from the November 4, 2008 high (a 60 Fibonacci day CYCLE turn date). One more decline and a final rally would probably look best on the charts...but, given market sentiment figures, a major decline that begins right now would probably fool the majority. |
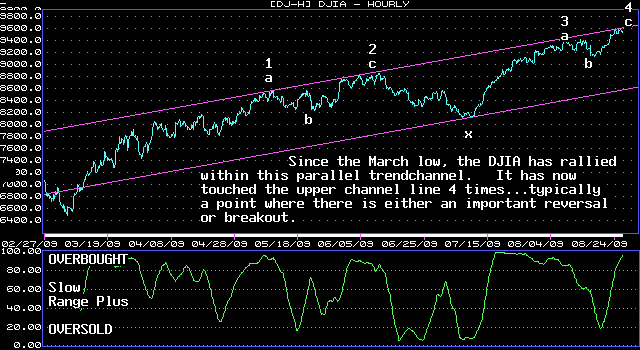
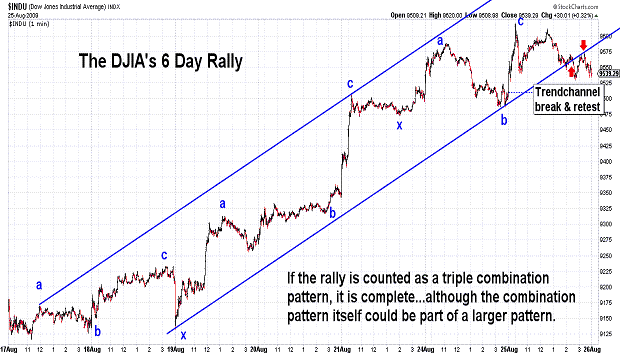
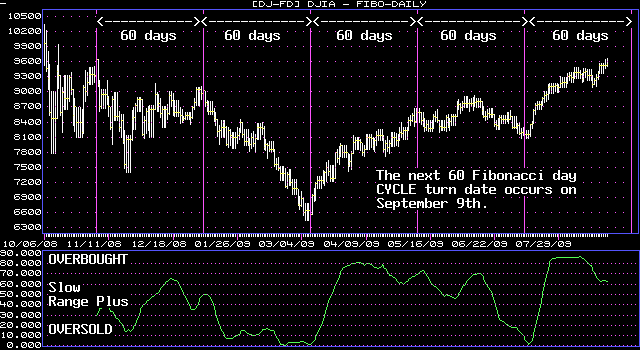
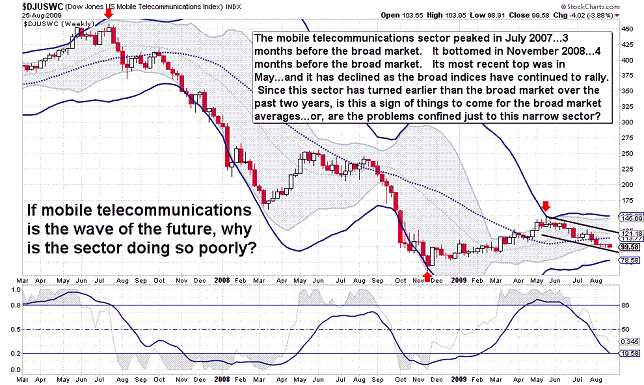
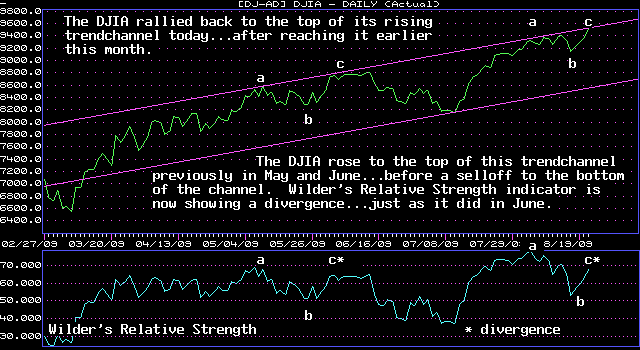
| August 25, 2009 update...Today, the DJIA closed well below its intraday high...but, it continued its streak of consecutive higher closes...now at six. As you can see in the first chart above, the DJIA has rallied to the top of its 5 month trendchannel for the fourth time. The forth time is often the charm...as the market will often follow it with a strong move...either a breakout (a momemtum bet) or an important reversal (a technical bet). If the DJIA is to postpone its final high until the 60 Fibonacci day CYCLE turning point (see third chart), a downside reversal, should it occur, may only be for the short term. If the recent low holds on any decline, the DJIA may end up tracing out a diagonal triangle top. We'll see. By the way, what's wrong with the Mobile Telecommunications sector? I thought mobile computing was the future. Maybe the sector is just undergoing some short term problems...but, the sector's chart shows that is has turned ahead of important broader market turns over the past two years. Is it giving another signal? |
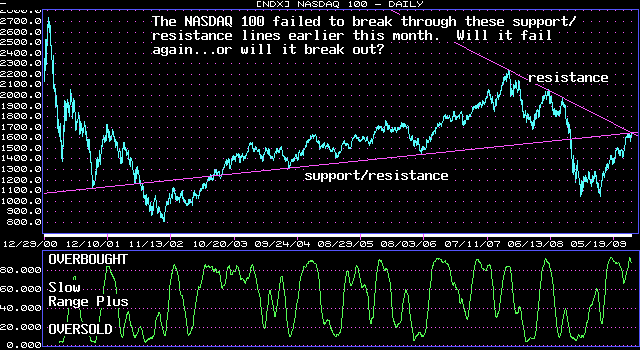
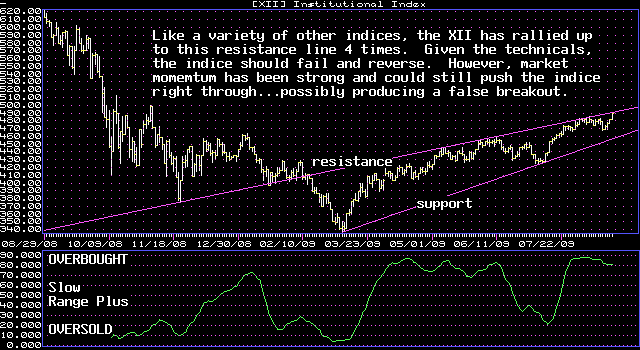
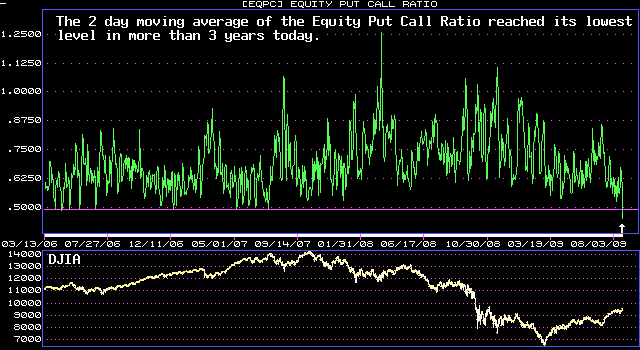
| August 21, 2009 update...Today's rally to a new rocovery high negated the signficance of the 21/22 week cycle top two weeks ago. One by one various cycles that have worked for the past year or longer are beginning to fail. The only one that has worked lately is the 60 Fibonacci day cycle...that coincided with the July low. That one occurs again on September 9th...12 trading sessions from now. It is too soon right now to tell if it will produce a high or a low. The suprising strength of the market over the past four days suggests (to me) it is not quite ready to roll over and begin an intermediate term decline from here (although it is certainly possible). One possibility is the formation of a diagonal triangle topping pattern...which could last into the September 9th timeframe. We'll see. One thing that I have found frustrating this year is that the traditional techncial indicators that I use have been failing more often than is typical. The market decline in February/March was overly extended...and now the rally from the March low is overly extended. If any of you have indicators that have been working well, I would appreciate it if you would let me know what they are! |
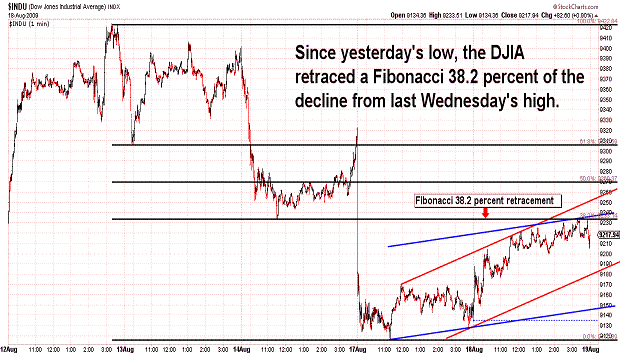
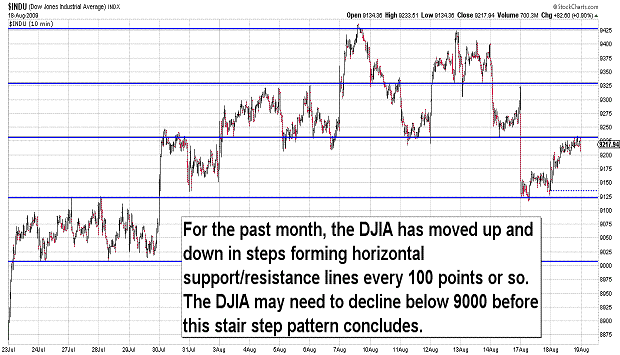
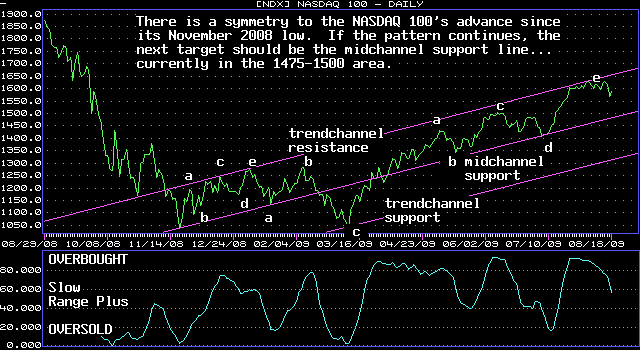
| August 18, 2009 update...There is not much to add to the past few updates. Yesterday's sharp decline helped to reinforce my view that the 21/22 week CYCLE top is solidly in place. The only question now concerns the manner and speed of the current decline as it unfolds toward the next CYCLE (low) turn window that occurs the week of September 14th. As the second chart above suggests, the DJIA may have to break the 9000 level before the selloff accelerates. By the way, there are a large number of Fibonacci day intervals (8, 13, 21, 55, 89, 144, and 233) between tomorrow's date and past reversal dates. This increases the odds of a reversal at some point tomorrow. |
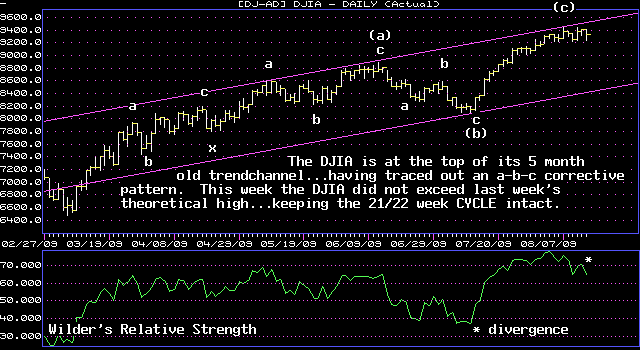
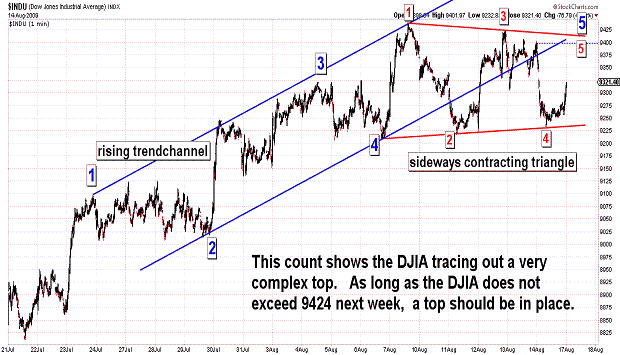
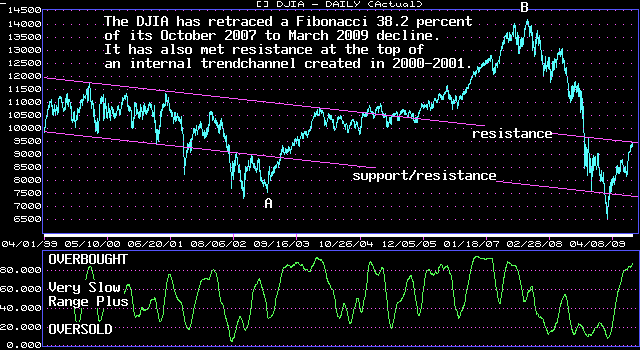
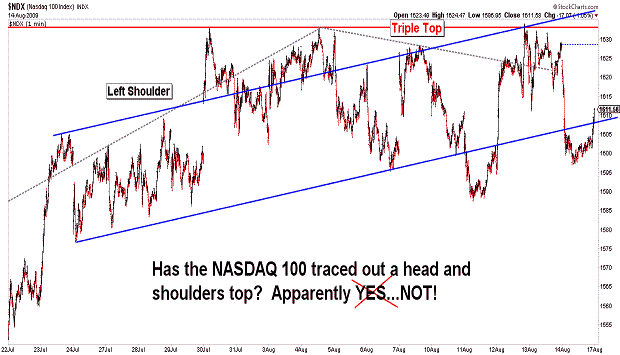
| August 14, 2009 update...The DJIA came close (within 18 points) to reaching its theoretical high of last week...but, in the end, it was not exceeded. As a result, the 21/22 week CYCLE remains in force. Whether or not it proves to coincide with a major turn in the market is yet to be seen. But, with each passing day, the market's technical condition weakens...and, at some point very soon (I think a decline below 9200 should do it), the intermediate term trend will shift to the downside. As I said in the previous update, the 85 week CYCLE low is due to occur the week of September 14th...and that CYCLE has EACH TIME over the past 6 years seen the market reverse lower anywhere from 5 to 14 weeks earlier (March 14, 2003 - 14 weeks; October 29, 2004 - 7 weeks; June 16, 2006 - 5 weeks; February 1, 2008 - 6 weeks). We are currently 5 weeks away. In the meantime, the key level next week is 9424. As long as that level is not exceeded, the top should be in place. |
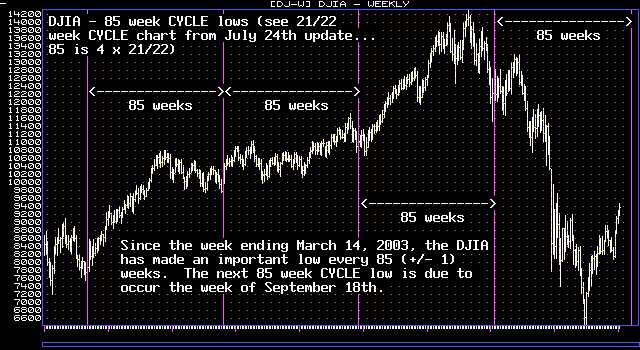
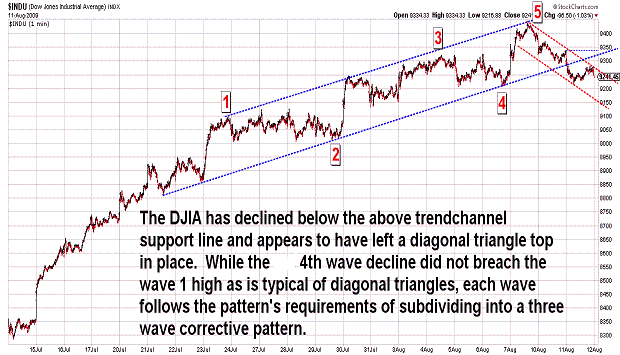
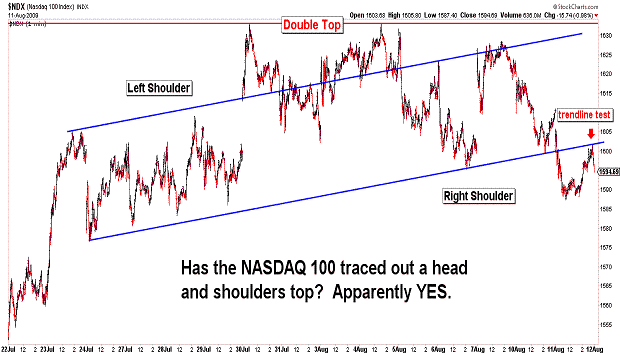
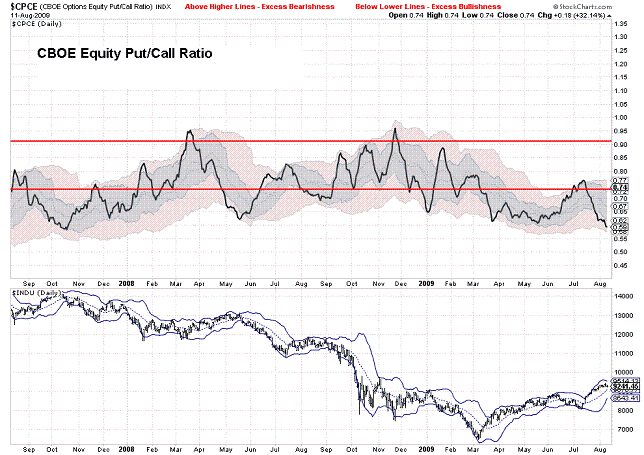
| August 11, 2009 update...Today, the DJIA closed 196 points below last Friday's intraday high. This increases the odds that the 21/22 week CYCLE is still working its will over the market...reversing the recent 4 week old advance. The first chart above shows a related 85 week CYCLE (21/22 weeks X 4) that has accurately called market lows (+/- 1 week) since the week ending March 14, 2003. The next occurence of that cycle is the week ending September 18th...5 weeks from now. It seems to me, assuming that this CYCLE is still in effect, that the decline beginning yesterday is likely to be quite substantial. In past updates, I have indicated that the DJIA is likely to test its lower Bollinger band on the weekly chart...I still think that is the case. We'll see! |
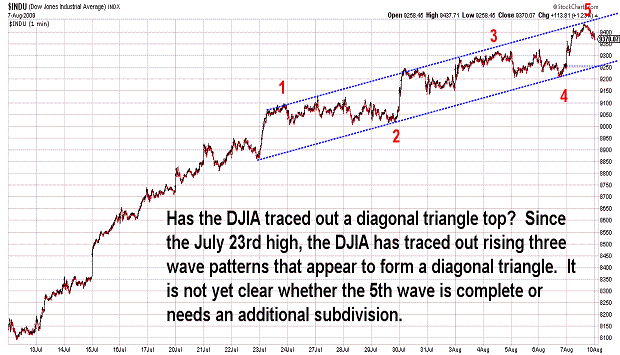
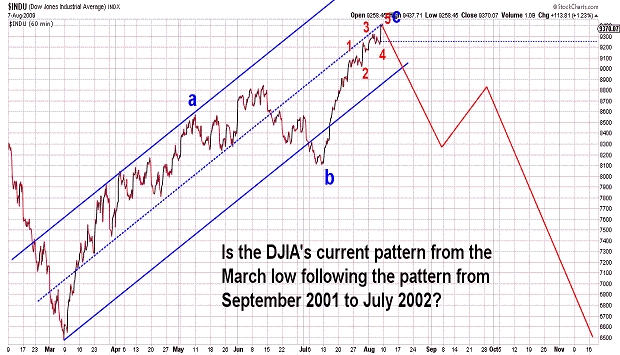
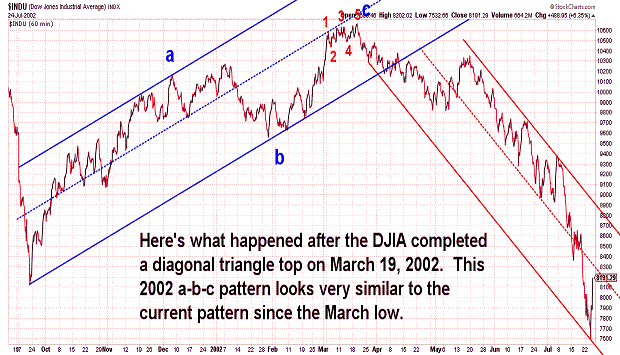
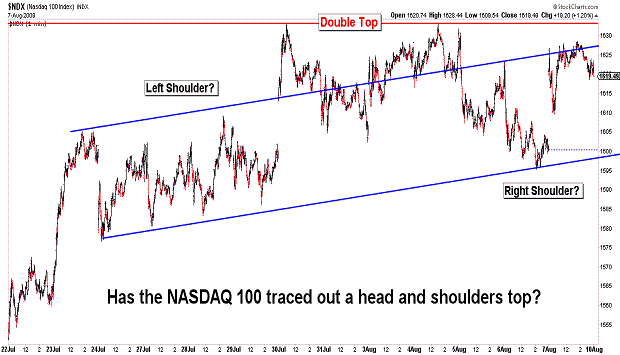
| August 7, 2009 update...The battle is on! It's market momentum vs. market technicals. Today's DJIA rally reached the Fibonacci 38.2 percent retracement point of the decline from the October 2007 high to the March low. Since the pattern from the March low is corrective in nature, this would be a logical place to look for a reversal. Cycles also suggest that the market should now decline...this was the 21st (Fibonacci) week since the March (theoretical) low (see 21/22 week cycle chart in July 24th update). All of the broad market indices are overbought on a daily and weekly basis...with divergences appearing in many indicators. Two of the indices that I follow closed today below their Tuesday high (NDX and XII - indice price divergence). Most of the indices are at their upper bollinger bands on both the daily and weekly charts. The DJIA's pattern strongly resembles a pattern from 2001-2002...which was subsequently followed by a powerful decline. Market sentiment is excessively bullish, i.e, put/call ratios are at levels that occurred at important market tops. The case is certainly formidable that the risk of a significant decline is high. The one factor that the market has in its favor is momentum...which, while losing strength, has kept the market moving higher. So, here we go...the rubber band is extremely stretched...will it now snap back? |
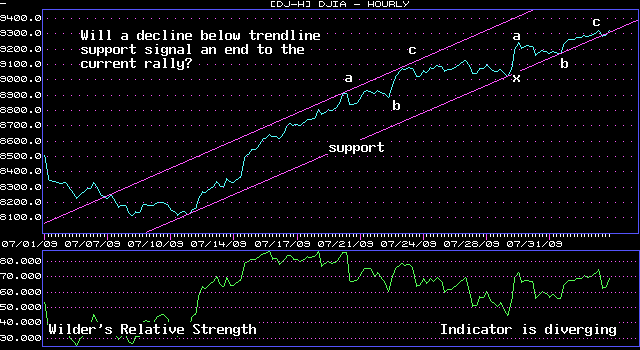
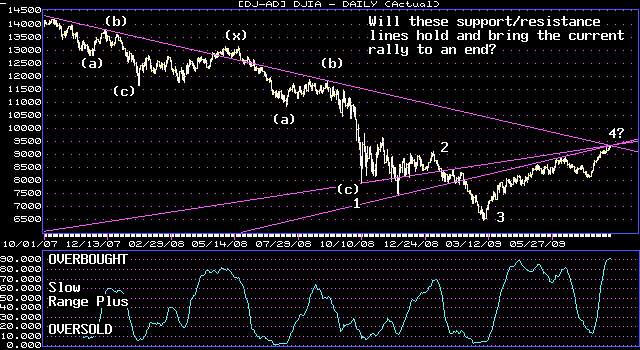
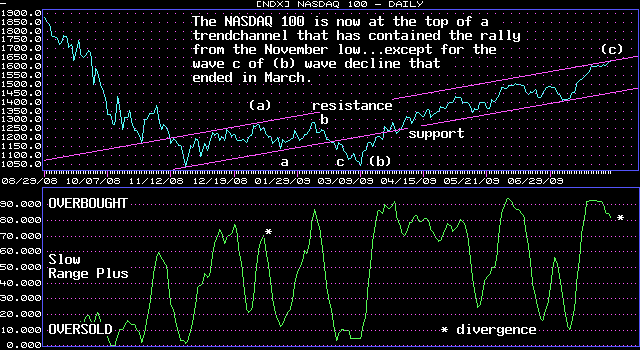
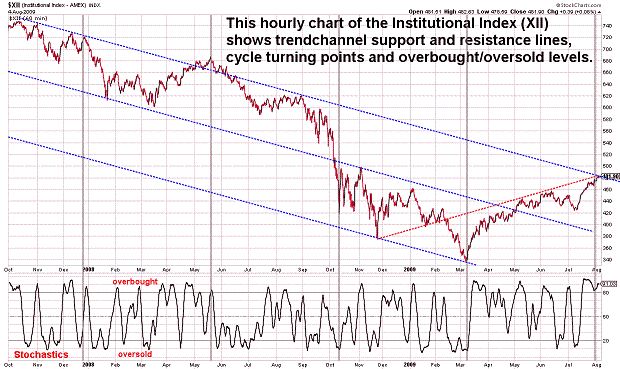
| August 4, 2009 update...As discussed in recent updates, the market is currently being pressured by both daily and weekly cycles...but, it has yet to show a decisive turn. The DJIA has eeked out an additional 75 points since last Thursday's intraday high (100 trading day cycle)...negating the one day variability of the cycle since March 2007. The 21/22 week cycle is still in play for a reversal...so, we'll see if that does, in fact, happen before the end of the week. Various trendlines, trading bands, and overbought/oversold indicators currently suggest a decline is likely...but, momentum keeps pushing the market higher. In line with the current rally, CNBC and other business networks are bringing out the bullish experts saying business and the economy look great...and stocks should continue higher. Sentiment indicators (put/call ratios, etc.) agree with their bullishness...which should set the stage for a near term top. |
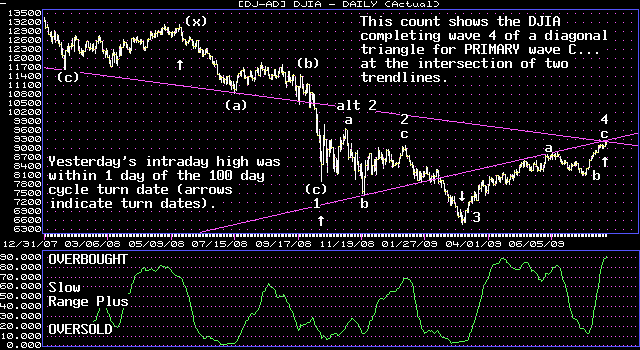
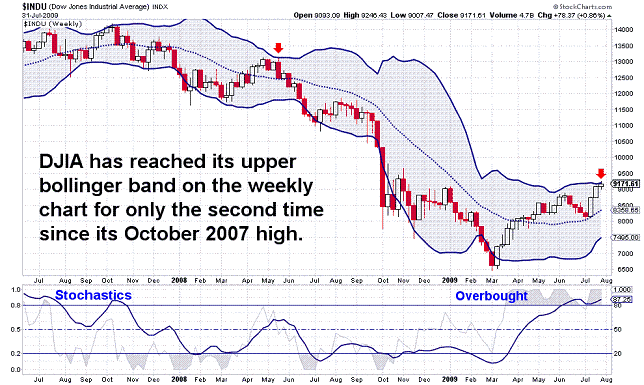
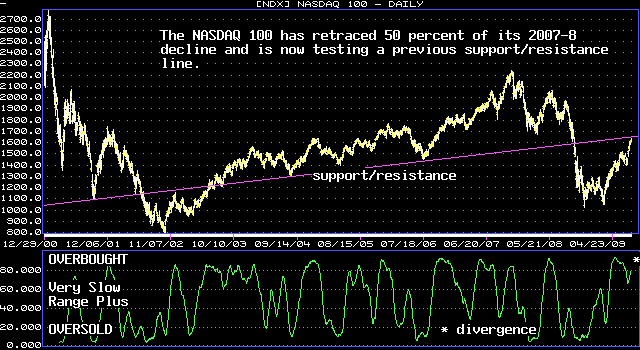
| July 31, 2009 update...Sorry about the lateness of tonight's posting. Severe thunderstorms knocked out our power for hours. Maybe it is an omen that the market's recent upward power is about to be knocked out! The DJIA made an intraday high yesterday...within one day of the 100 trading day cycle turn date (as it has done three times previously since March 2007). We'll see shortly if this cycle works for the seventh consecutive time. Of the previous six, the smallest point reversal was 537 points in August 2007. Next week brings the turning point of the 21/22 week cycle (see last Friday's chart)...but, that cycle has a one week leeway...so, an allowable turn could be this week or the following week. Given various resistance trendlines that are currently being tested and various market technicals, I am leaning for a turn lower to occur sooner rather than later. (BTW, this month was a Fibonacci 21 months since the October 2007 high...and a Fibonacci 8 months since the November 2008 low.) |
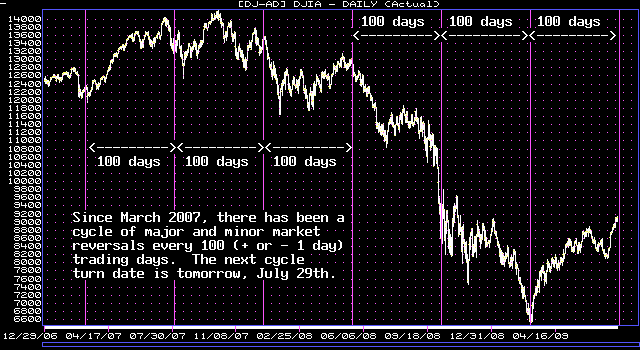
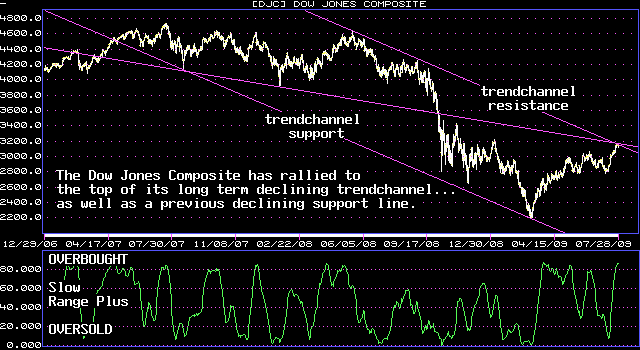
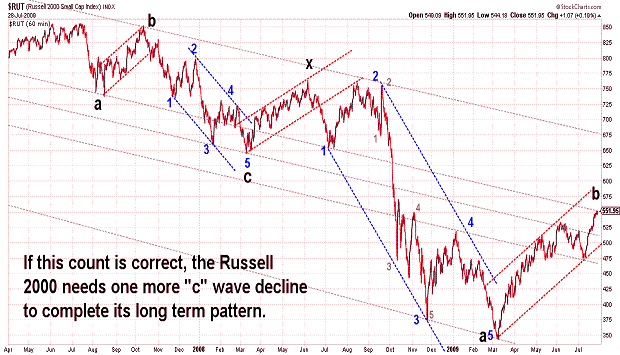
| July 28, 2009 update...There is not much to add to this past Friday's update. Pricewise, the market is essentially where it was on Friday. Timewise, the DJIA is now one day away from its 100 trading day cycle turn date. Since March of 2007 (6 consecutive times), the DJIA has reversed course within one day of the cycle turn date...and 5 of the 6 times saw the reversal lead to a significant rally or decline. I am not sure how the 21/22 week cycle will reconcile with this turn...since that cycle does not indicate a turn until next week. One possibility is that the market will move sideways until the beginning of next week...and then begin a 5th wave decline. We'll see! (FYI, I am now out of all equity long positions.) |
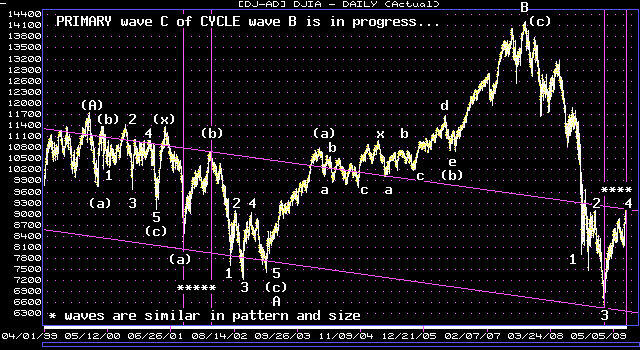
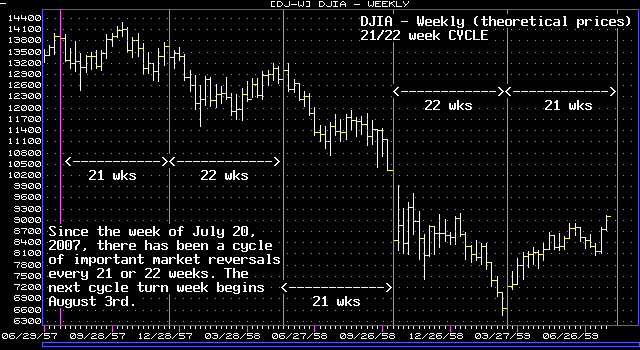
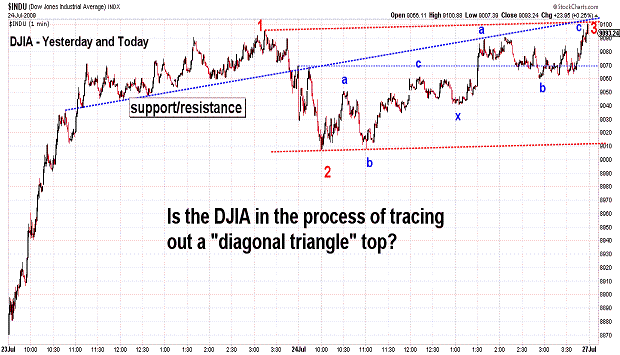
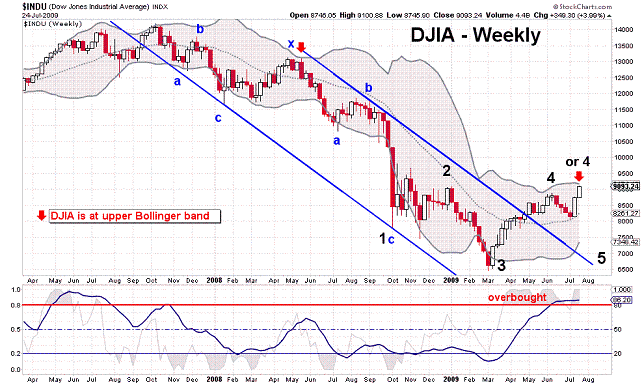
| July 24, 2009 update...For the tenth consecutive day the DJIA made a higher intraday high and low. Historically, I do not know the record for this type of advance, but "uncorrected" moves usually have strong reversals upon their completion. Today's high was only 4 points above yesterday's high...so, it is possible the advance of the past two weeks is finally starting to wind down...possibly in the form of a diagonal triangle (see 3rd chart above). I took a look at the DJIA's long term chart today (see first chart above)...and noticed that the current pattern (from the March low) bears a strong resemblance to the pattern that occurred between September 21, 2001 and March 19, 2002. That pattern did, in fact, end with a diagonal triangle pattern (March 5th - March 19th). Maybe, it will happen in the present case as well. Naturally, there is no guarantee that it will. The current pattern may resolve differently as compared to the one in 2001 (although I do think there will be some degree of similarity). The next important cycle turning points occur during the next two weeks...i.e, 100 trading day cycle (July 29th) and 21/22 week cycle (week of August 3rd - see second chart above). I think the next wave down is likely to begin at that time...AS LONG AS the market is then making a high and not a low. |
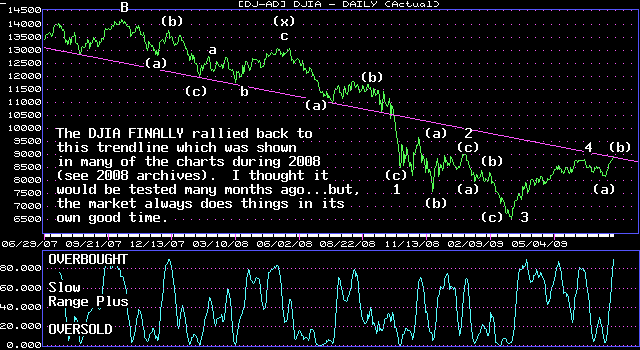
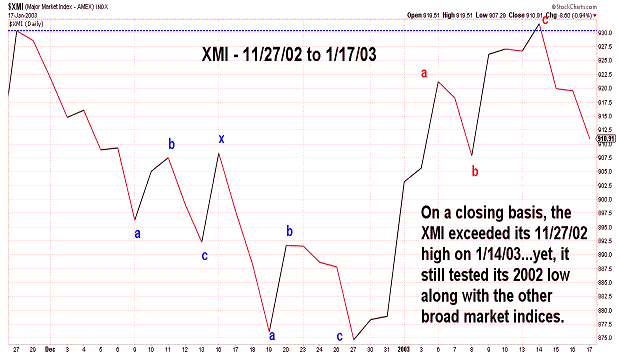
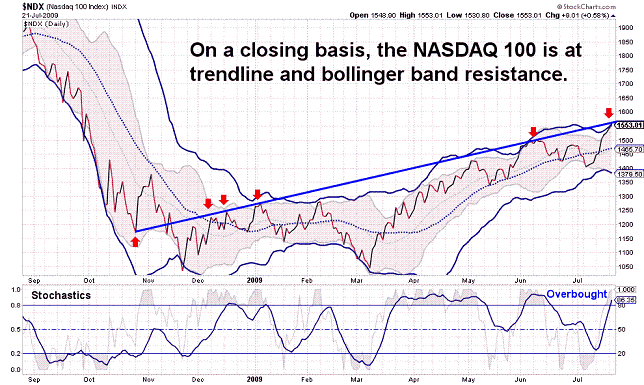
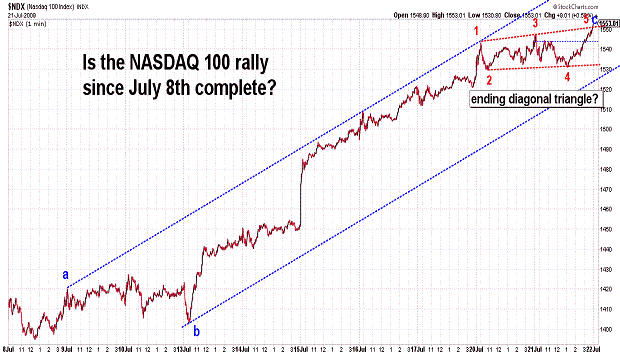
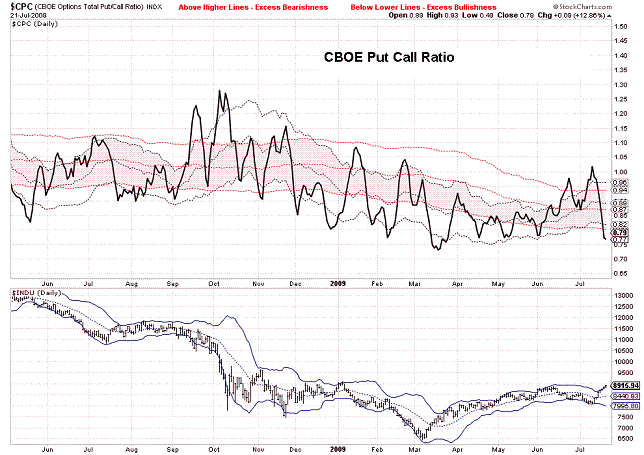
| July 21, 2009 update...Last Friday, I suggested I would watch for a high by the middle of this week. That was based on similarities between the DJIA's current pattern and its 2002-3 bottoming pattern, as discussed in recent updates. With today's rally above 8877 in the DJIA, however, the current pattern is no longer following the 2002-3 pattern precisely. (But, take a look at the XMI pattern in 2002-3 where the index did exceed its previous high - the index still declined subsequently and retested its 2002 low along with the DJIA and other indices). My preferred wave count nevertheless remains valid for the time being...i.e., wave "e" is now counted as a "flat" (3-3-5) (see last Friday's update) rather than a type of corrective wave where a previous high is not violated. Please note in the first chart above that the DJIA has FINALLY tested a trendline that had provided important support during the first year of PRIMARY wave C. If you look at the 2008 archives, you will see that I assumed this line would be tested...but, to be frank, I expected it to occur much sooner. So now, here we are at that line once again...and it should (at least theoretically) act as resistance. With many technical indicators also suggesting a market top (or the beginning of a topping pattern), a reversal should be close at hand...if not immediately, then possibly by July 29th (100 trading day cycle). |
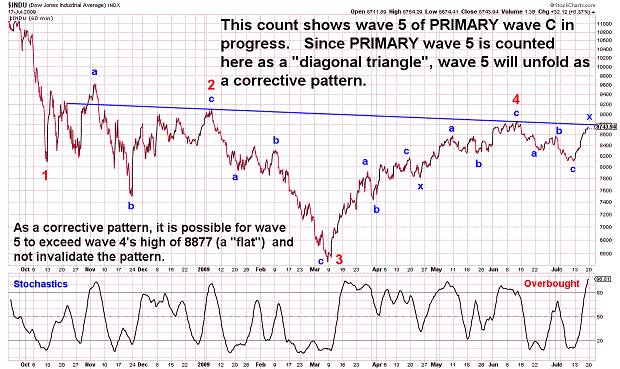
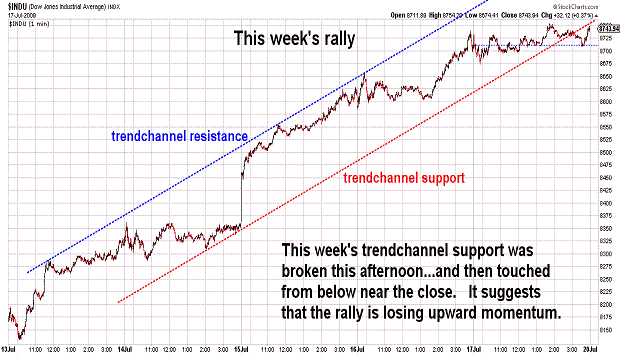
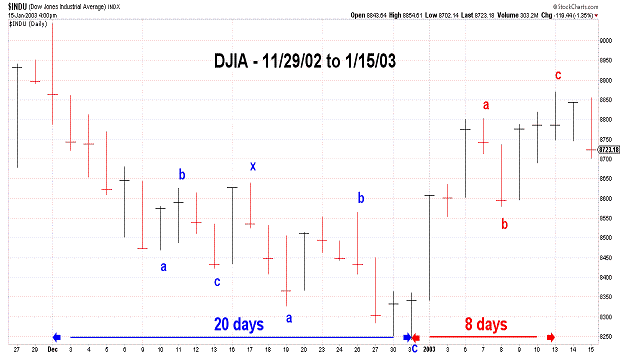
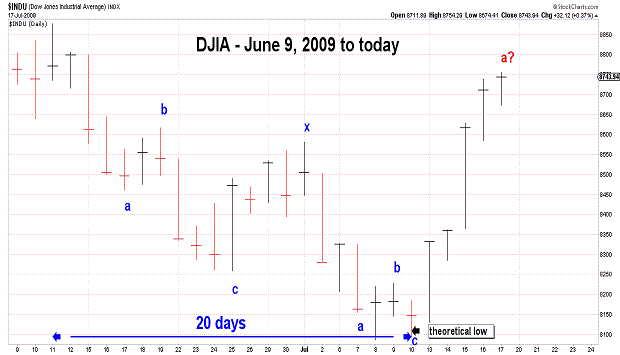
| July 17, 2009 update...The broad market indices ended the week on a mixed note...but, for the week as a whole, all were signficantly higher. As I pointed out last Friday, the odds favored a rally this week after 4 consecutive weekly declines. The DJIA continues to follow the 2002-3 bottoming pattern...i.e., rallying sharply after a 20 day selloff (see 3rd and 4th charts above). If the DJIA continues to duplicate the pattern, a high should occur next week...and a resumption of the decline from June 11th should follow. If the June 11th high is exceeded, however, that pattern will no longer apply...although it will not (at that point) invalidate my preferred wave count (see first chart above). As explained in previous updates, my count suggests that wave 5 of a PRIMARY wave C "diagonal triangle" is unfolding. Since the waves of a diagonal triangle are corrective in nature, it is possible for wave 5 to trace out a "flat"...in which case, the wave 4 high of 8877 will be exceeded. We are currently 134 points away from that high...so, let's see how close we get by the middle of next week. |
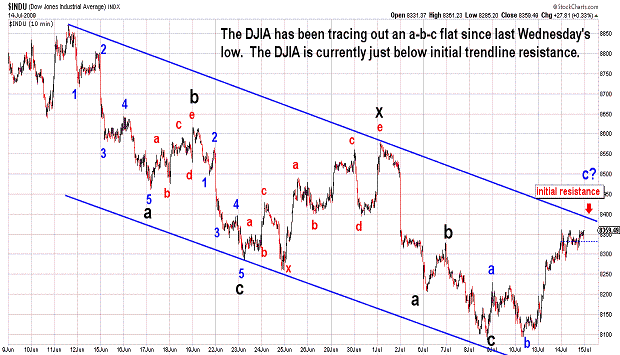
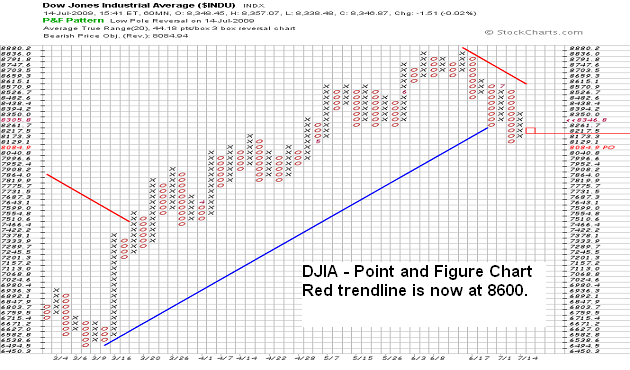
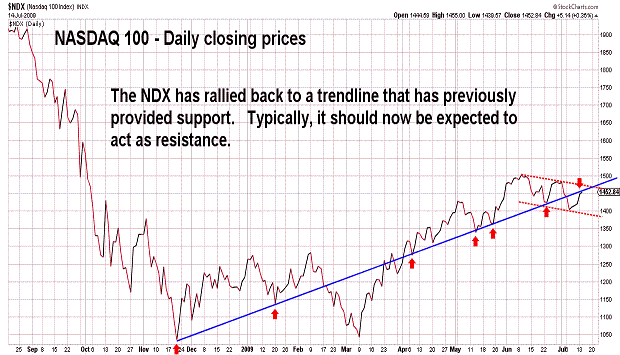
| July 14, 2009 update...Yesterday's strong rally assured us that the 60 Fibonacci day cycle is still in effect. The DJIA's theoretical low last Friday (the turn date) was the DJIA's lowest low in more than two months. In between the May and July lows, the DJIA make a high on June 11th. From the June 11th high the DJIA declined for 20 trading sessions through this past Friday's low. In recent updates, I have referenced the DJIA's 2002-3 bottoming pattern and pointed out its similarity to the current pattern. Interestingly, after the DJIA peaked on December 2, 2002, it initially declined for 20 (trading) days (just like the most recent decline). It then traced out an a-b-c rally for the next 8 days...before resuming its decline to a final bottom. If the DJIA is still replicating the 2002-3 pattern, the current rally should last until next week. We'll see! In the meantime, the DJIA is approaching a short term overbought condition...so (at a minimum) a "b" wave pullback is likely in the next day or two. |
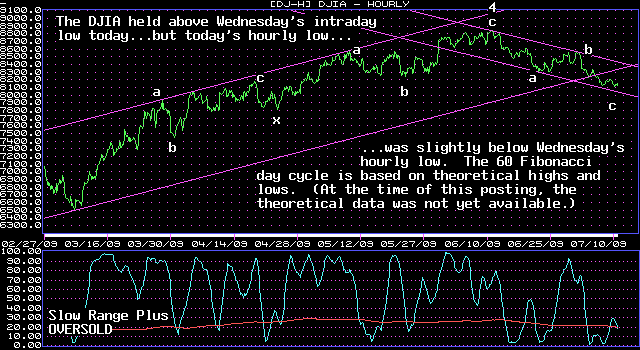
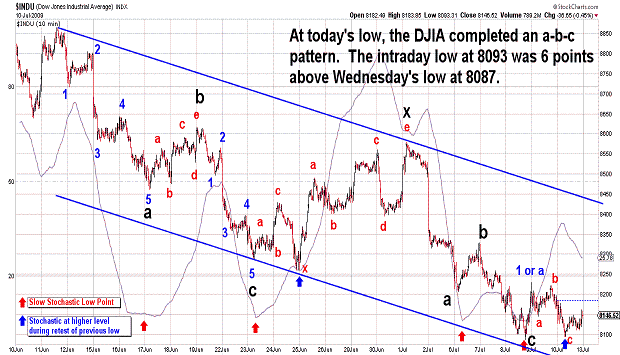
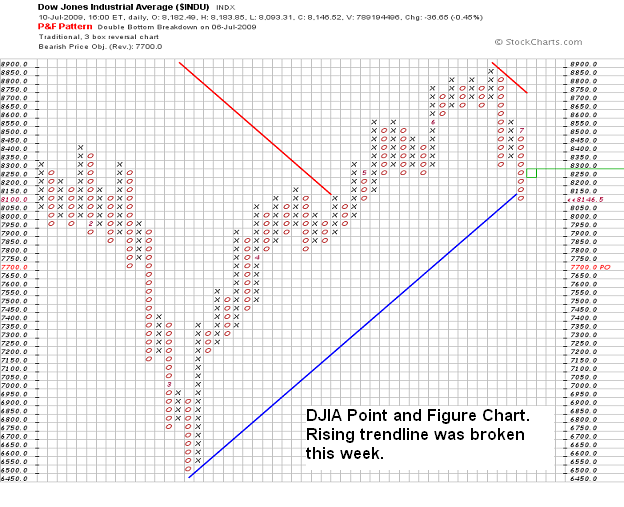
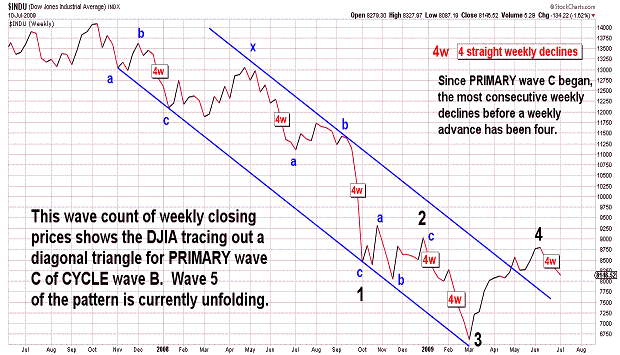
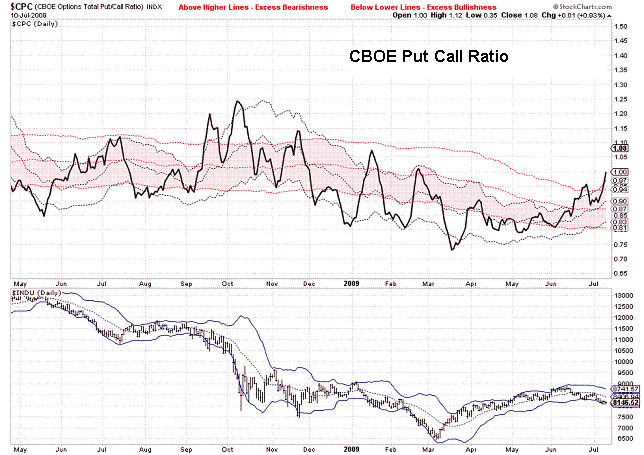
| July 10, 2009 update...For the fourth straight week, the DJIA ended with a loss. As I mentioned in the last update, there has not been more than four consecutive weekly declines since PRIMARY wave C began in October 2007. This is the sixth time it has happenend since then...so, it would be logical to assume that an advance (on a net basis) is likely next week. Other factors supporting a short term rally: (1) on a daily basis, many of the broad market indices have reached oversold levels; (2) if the DJIA is still following the 2002-3 bottoming pattern, a rally next week should be expected; and (3) the 60 Fibonacci day cycle suggests a turn is at hand. So, a short term bounce within the confines of an intermediate term decline is certainly on the table. Despite this fact, surprises can be expected to occur on the downside. |
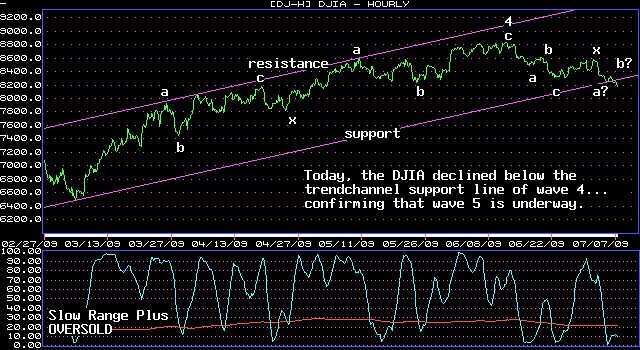
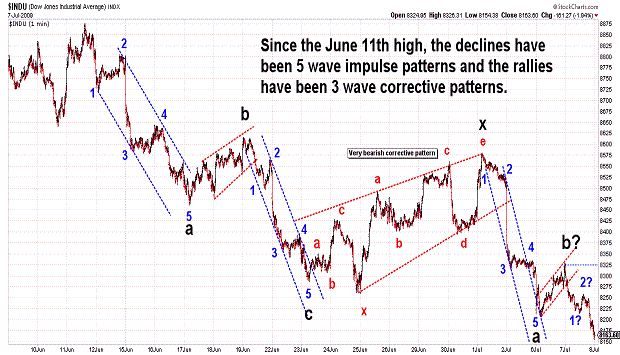
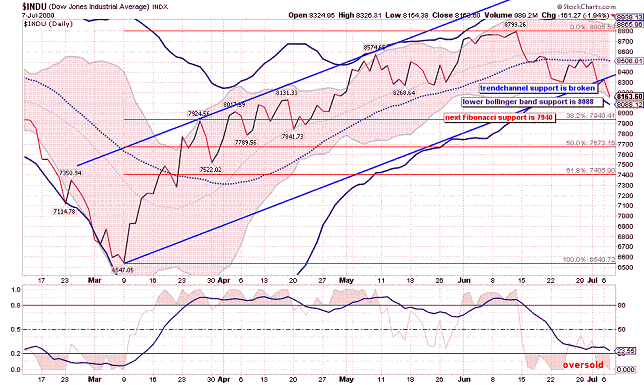
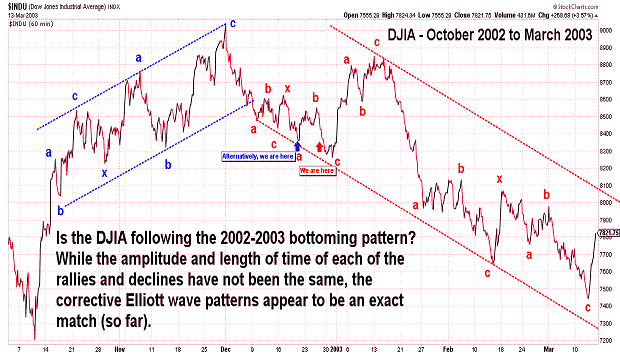
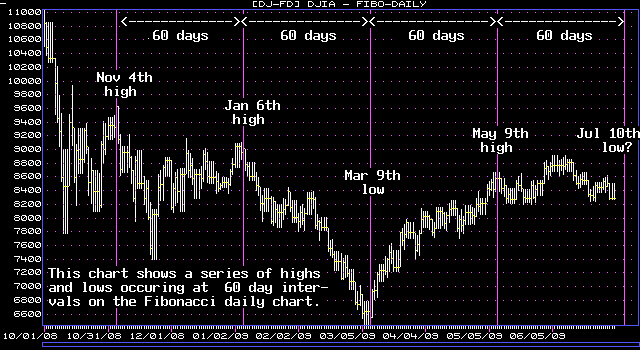
| July 7, 2009 update...This should be an interesting, if not critical, week in the market. Today, the DJIA declined below the trendchannel of the March to June advance...confirming (to me) that a wave 5 decline to test the March lows is underway. While the pattern of the decline is still open to various interpretations, a comparison of the DJIA's pattern with the 2002-03 bottoming pattern may present a clue. The recent March - June rally pattern (a-b-c-x-a-b-c) is similar to the October - December 2002 rally pattern (a-b-c-x-a-b-c). Now, it appears (to me) that the pattern of the decline from the June 11th high is showing a resemblance to the decline that began in December 2002 (and continued until March 2003). If the current pattern continues to unfold like the one in 2002-3, then we could see a short term bottom in place by the end of the week. This Friday is the 60 Fibonacci day cycle turn date...and, as you can see in the chart above, it has marked important highs and lows since November 4, 2008. In addition, if Friday's close is below 8285, it would be the fourth straight week in which the DJIA has declined. The last time the DJIA had more than 4 weekly declines in a row was August to October 2002 (6 weeks)...exactly 353 weeks ago. Based on the odds, it would seem probable there should be some type of short term bounce after this week (the daily chart shows various technical support levels not too far below today's close - see DJIA daily chart above). However, the last time the DJIA declined more than 4 weeks in a row, the market was tracing out an important bottom...something that may also be happening now. |
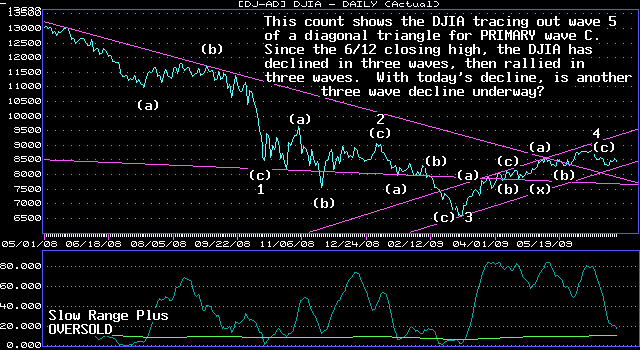
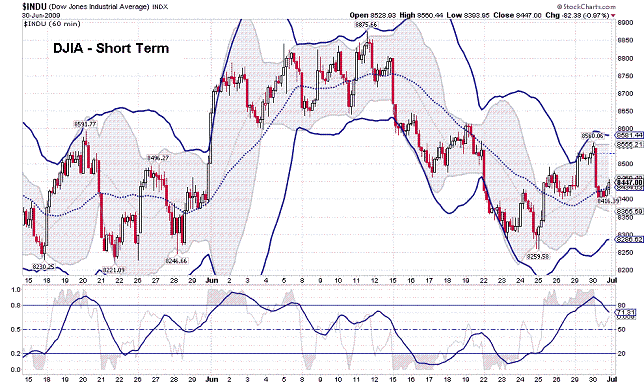
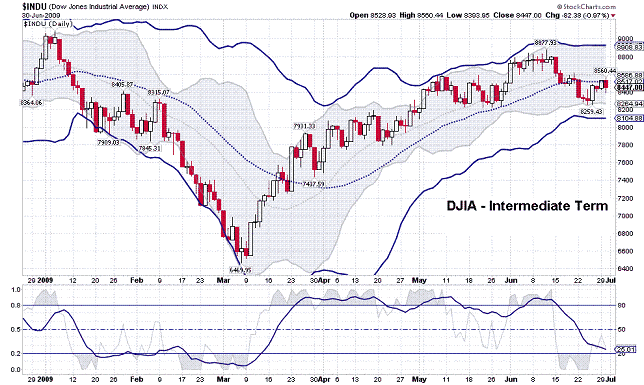
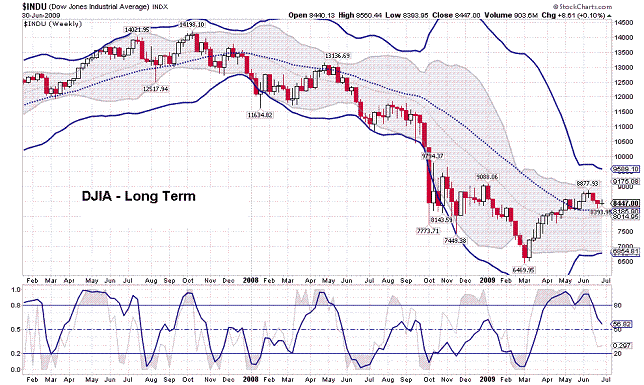
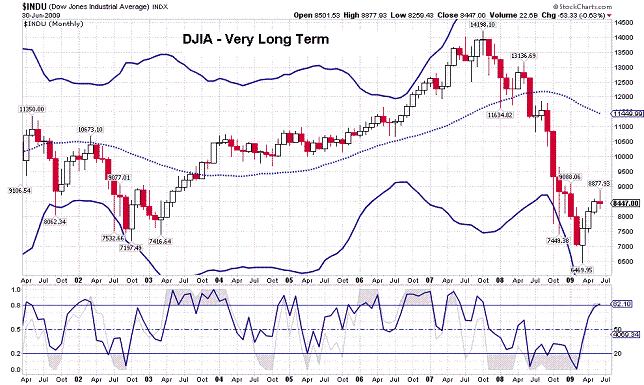
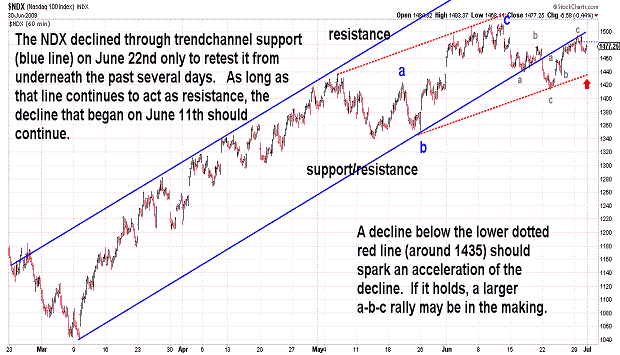
| June 30, 2009 update...Trading ended today for the month of June. For the most part, the averages limped along without direction...the DJIA was down slightly...the NASDAQ was a few percentage points higher. On Friday, I said that "(m)y primary wave count continues to suggest that a 5th wave decline began June 11th that will retest the March lows. I still think so...but, the pattern of that decline is anything but clear. On a closing basis, the DJIA traced out a decline in three waves through June 24th. That was followed by a three wave rally through yesterday. The question now is: with today's sell off, is another three wave decline underway...or, is something else going on? You can see charts of the DJIA in various time frames above...from short term to very long term...and, taken together, they are giving mixed technical signals. Until the DJIA declines below 8200, another rally to test the recent high cannot be ruled out. This is a holiday week...and, traditionally, it should be positive for the market. If it is not, it could be a sign that the decline from June 11th is about to accelerate lower. |
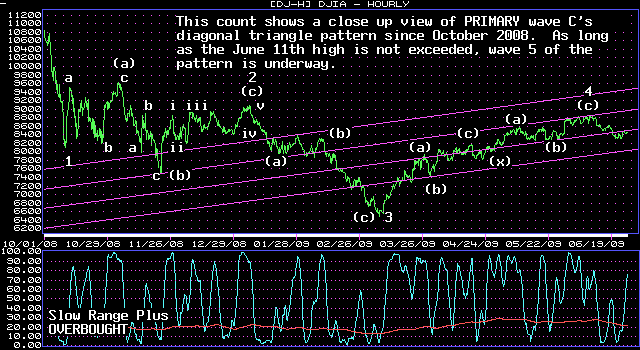
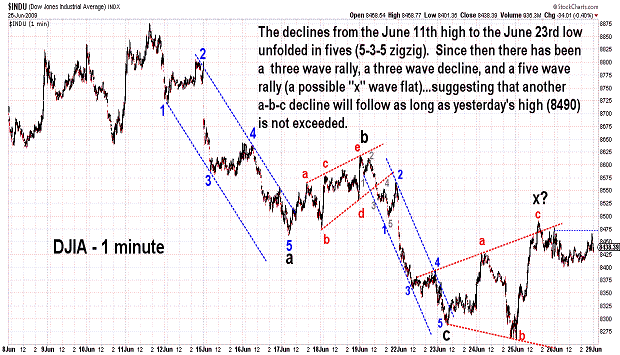
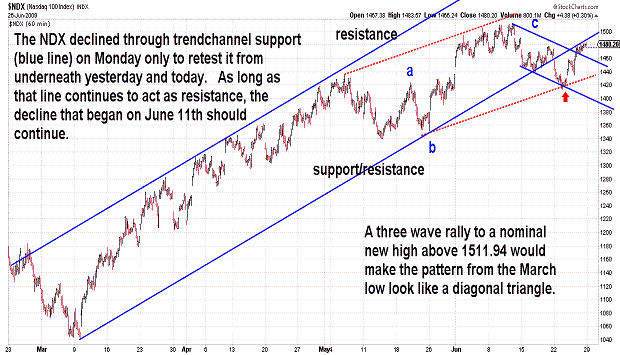
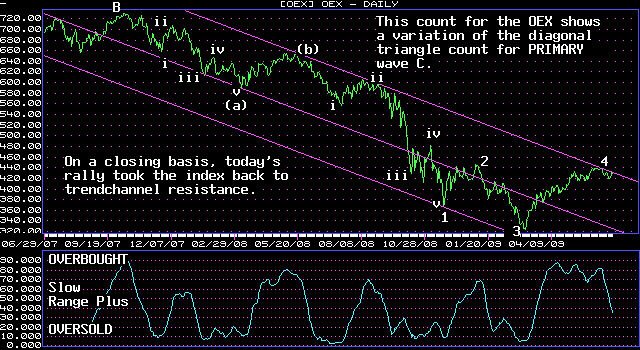
| June 26, 2009 update...It was a mixed week for the market...the DJIA lost just over 1 percent...the NASDAQ had a nominal gain. My primary wave count continues to suggest that a 5th wave decline began June 11th that will retest the March lows. The choppy nature of the 5th wave pattern, so far, has not been helpful in confirming the correctness of the count...but, I will continue to use it as long as the rallies keep on unfolding in three wave patterns. The NDX broke through a trendchannel support line this past Monday. Yesterday and today that support line (now resistance?) was retested from below. As long as that line is not exceeded, another (more powerful) decline should begin next week. |
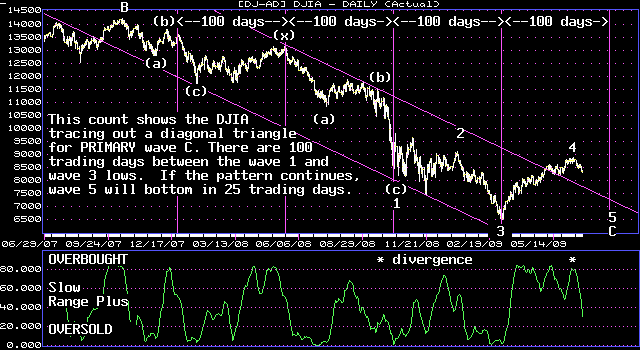
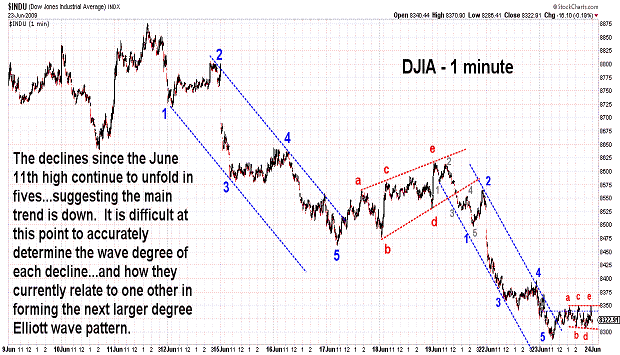
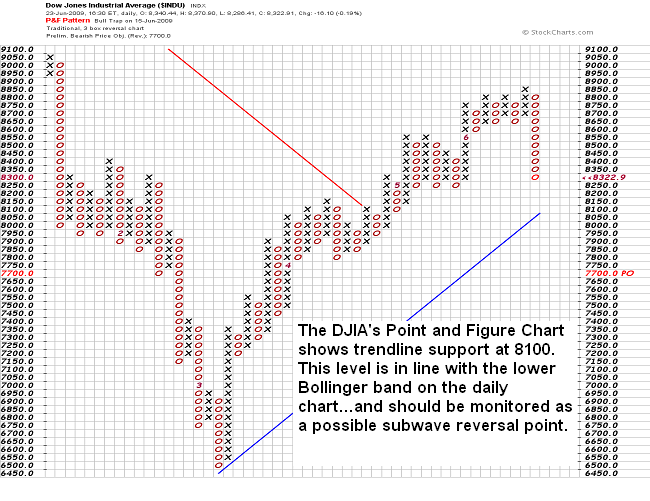
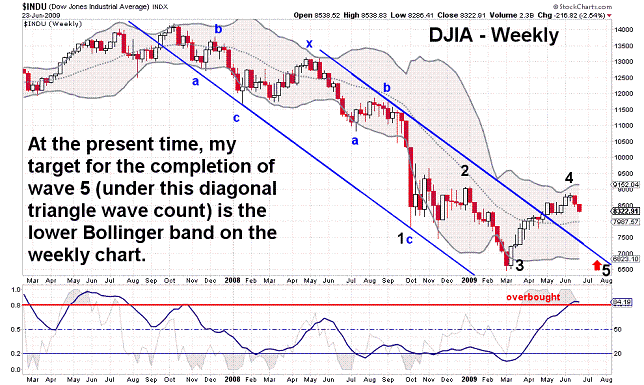
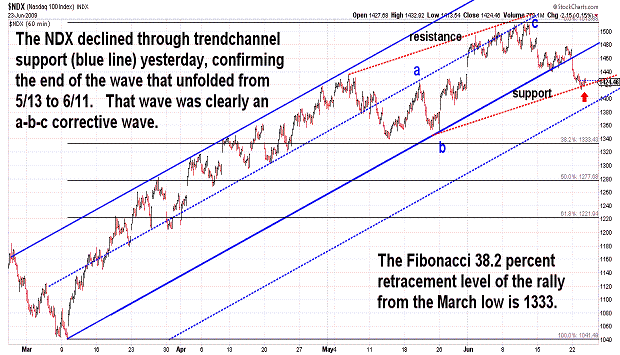
| June 23, 2009 update...Yesterday's sharp decline broke trendline support (see NDX chart)...and continued the pattern of 5 wave declines since the June 11th high. The DJIA completed another 5 wave pattern this morning and then traced out a corrective pattern for the remainder of the trading session. It is not yet clear how these patterns will mesh together into an Elliott wave pattern of one larger degree...so, focusing on various technical indicators and Fibonacci (and other) support levels is an important task in the short run until the current Elliott wave pattern becomes discernable. This much I do know, IF my long term diagonal triangle count is valid for PRIMARY wave C: the current decline (wave 5) should unfold in three waves (a-b-c or a variation thereof). The current decline is the first of those waves...so, there will be a sizeable countertrend rally that follows it. Presently, inital support lies in the 8100-8200 area...and, below there, it's 7800-7900. |
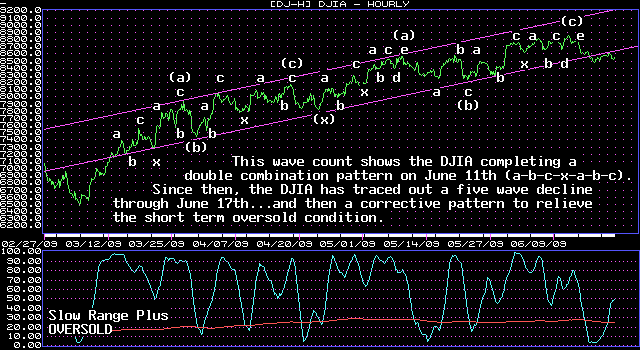
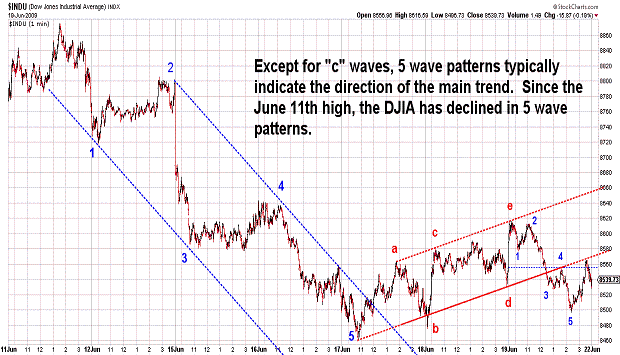
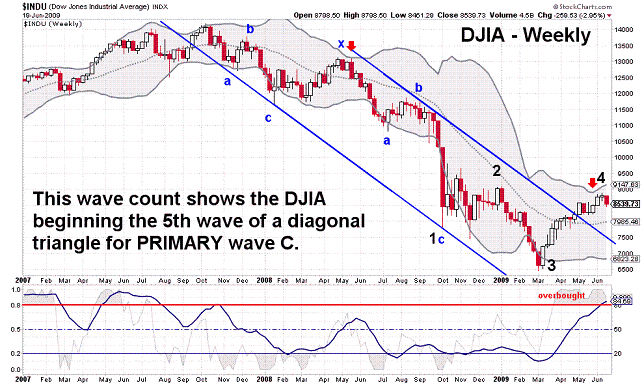
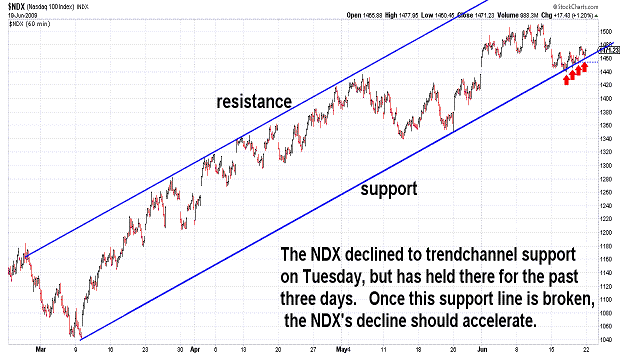
| June 19, 2009 update...The DJIA declined almost 3 percent this week...the NASDAQ about half that amount. Given this week's decline from last week's high, it looks like the 99 Fibonacci day and 15/14 week cycle patterns are still functioning (they began at the October 2007 high). The 71 trading day (closing prices) cycle this time around (yesterday) only produced a minor turn in the market...similar to the reversal that occurred on August 13, 2008. The next notable cycle date is July 10th (60 Fibonacci day)...but, that cycle has been effective only since November 4, 2008. After that there is another possible cycle turn date on July 29th (100 trading day). The market has been consolidating the past two days...since tracing out a five wave decline from the June 11th high. The DJIA and other indices have recently declined through trendline support and today tested it as resistance from underneath. The NASDAQ 100 (see chart), on the other hand, declined to trendchannel support on Tuesday/Wednesday and has bounced off of it several times yesterday and today. Once this support is broken, the next wave lower should begin...with, I believe, an accelerated pace. |
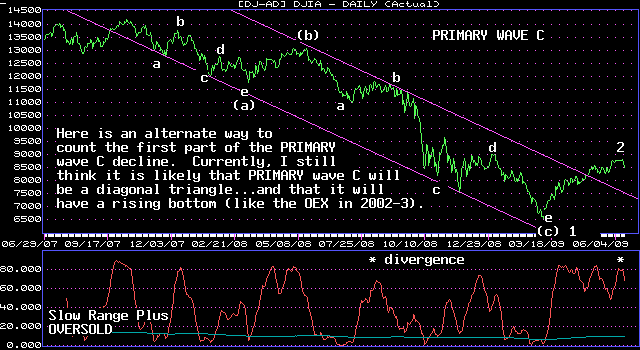
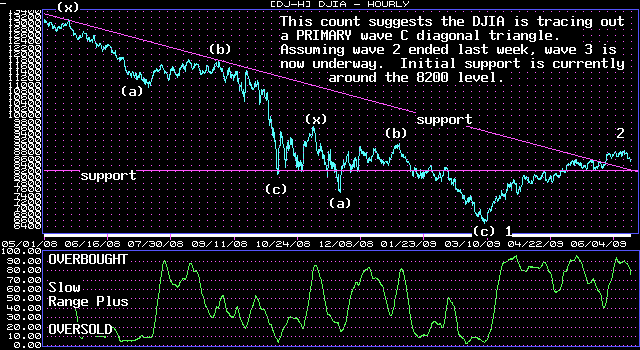
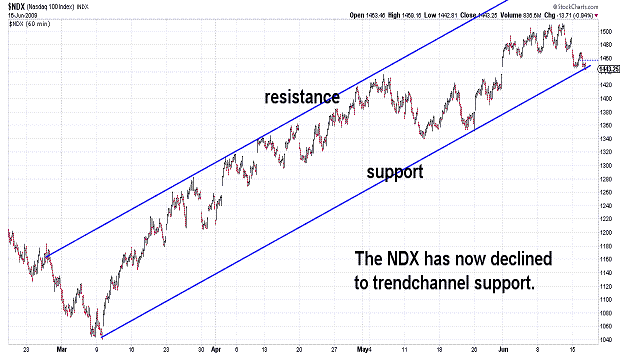
| June 16, 2009 update...Tonight's commentary will be short because my keyboard just died...and I am attempting to type with the on-screen keyboard and mouse (very slow). An intermediate term decline finally appears to be underway. Watch the 8200 area as an initial point of support. |
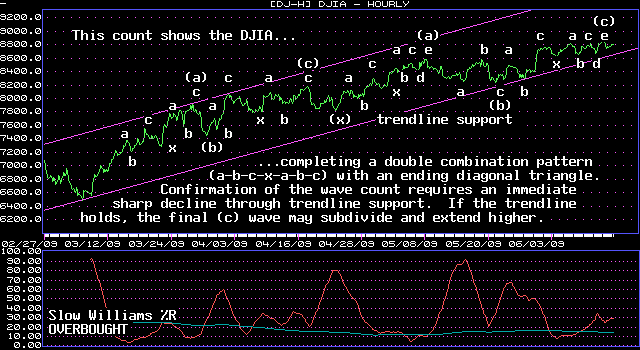
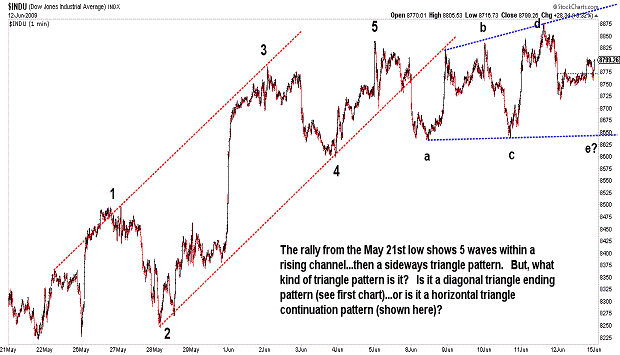
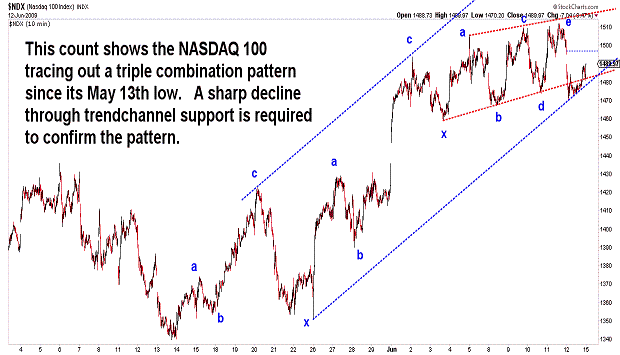
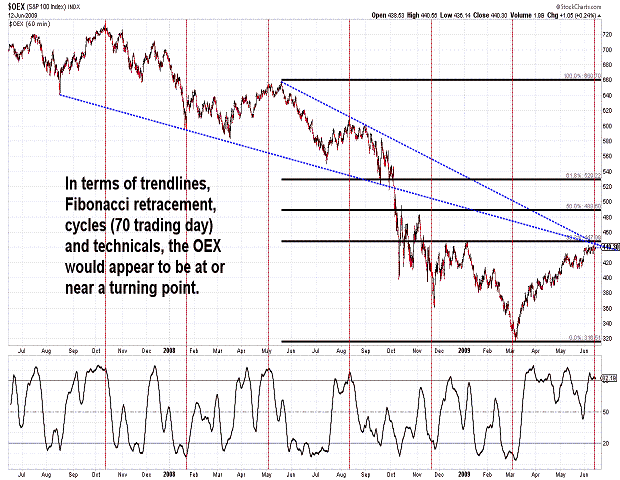
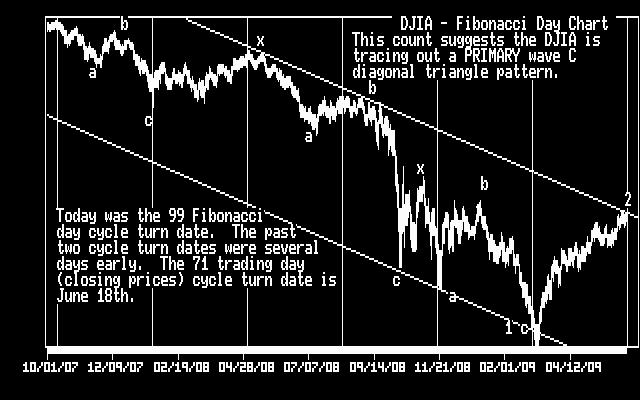
| June 12, 2009 update...If you like boring markets, you must have enjoyed the market since June 1st. Over the past 9 trading sessions, the DJIA has closed within 62 points (higher or lower) of the 8737 level. The entire trading range over the period has been limited to just 279 points. Just this week, the lack of market volatility caused the VIX to decline by 5 percent...it's lowest close since early September 2008 (just before the DJIA declined below the 11000 area). The back and forth action on the charts clearly suggests the formation of a triangle pattern. It is not clear, however, whether the triangle is of the ending variety, i.e., a diagonal triangle...or, the corrective variety, i.e, a horizontal triangle. The former suggests a sharp decline next week...the latter a sharp rally. The technical indicators over the past few weeks have given the market every excuse to sell off, yet it has held up and even inched marginally higher. Various cycles this week and next suggest an intermedate term turning point is at hand...yet the wave pattern (short term) still allows for the market to go in either direction. This may just be one of those cases where it's best to let the market give a buy or sell signal. A significant break below trendline support at 8600 should indicate that a top is in place. However, if the trendline holds, the current rally can subdivide and extend higher. I have a feeling that we are likely to find out early next week which way we are going...unless, of course, the market decides to continue its "boring" June sideways pattern! |
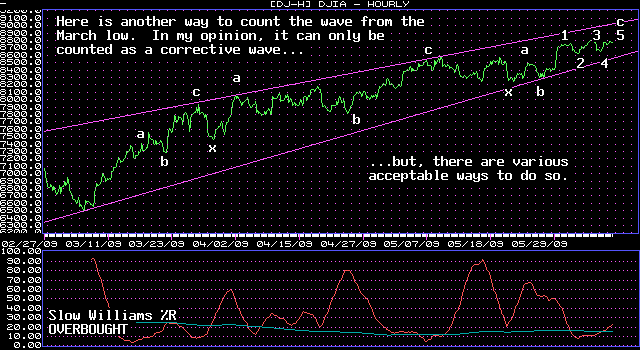
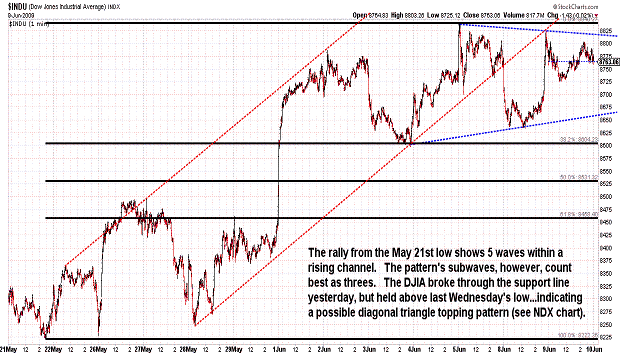
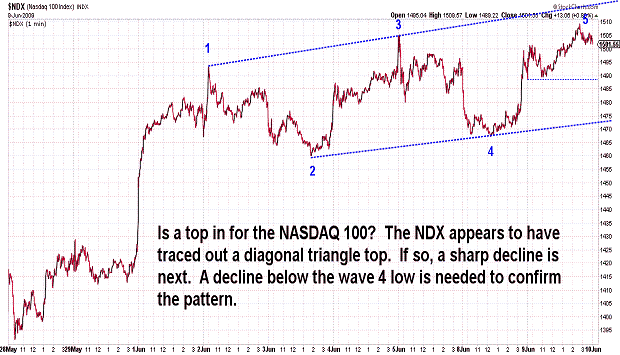
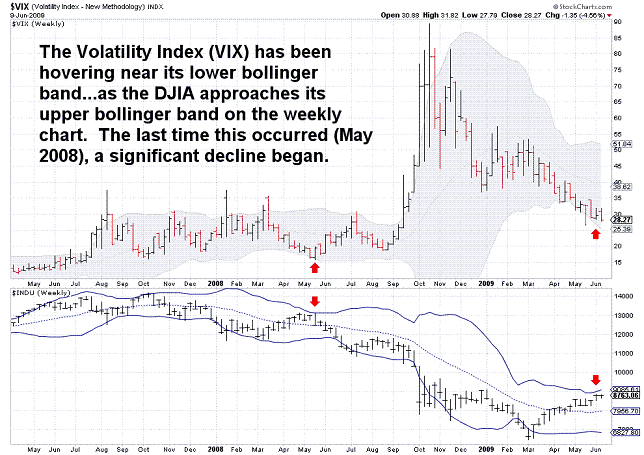
| June 9, 2009 update...After two trading sessions this week, the DJIA is essentially where it ended last Friday. I suggested last Friday that the market was likely to begin the week with a decline (it did)...by breaking below the channel support line it was sitting on at Friday's close. I also indicated that the DJIA's first test would be last Wednesday's low at 8598 (it was). I said that if it held, "the DJIA could rally one more time above (Friday's) high and trace out a diagonal triangle top". That is apparently what is transpiring...although the DJIA has not yet exceeded last Friday's high. If the rally from yesterday's low is a 5th wave failure, it won't! See the NDX chart for an a picture of a typical diagonal triangle pattern that appears complete (or nearly so). A sharp decline below the fourth wave low is now needed to confirm the reversal pattern. One other indicator that is now suggesting an important top is forming is the VIX. A setup similar to the one in May 2008 is clearly noticeable. |
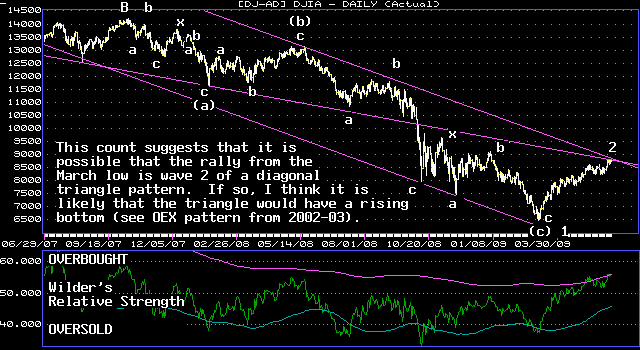
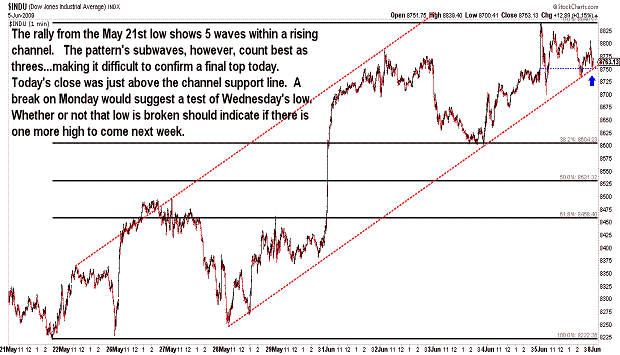
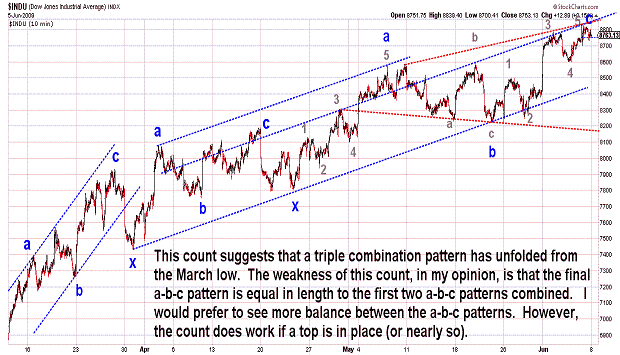
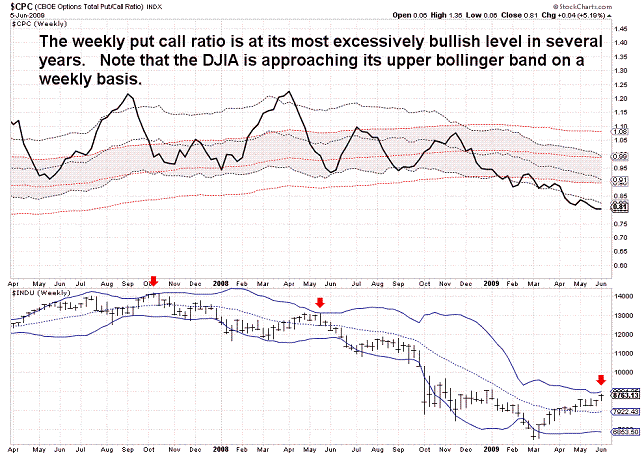
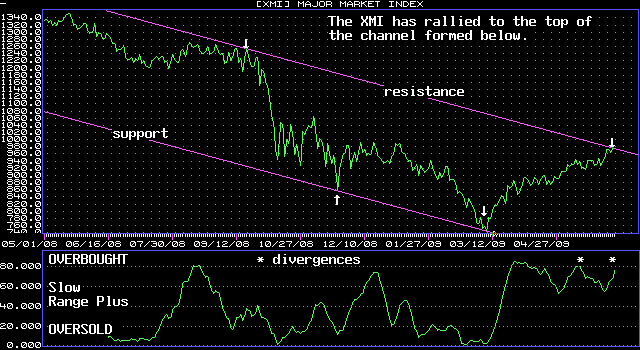
| June 5, 2009 update...It's happened for three straight weeks now...so I guess it's a pattern. During each of the past three weeks, the market soared during the week's first session..and then declined or traveled sideways over the remainder of the week. Will the same thing happen on Monday? I doubt it. Unlike the past three weeks, the DJIA will start next week at a short term overbought level. Like the past three weeks, it is sitting on a trendline...but, this time I think the odds favor breaking through the line. We'll see! The next crucial test will come when (if I am correct about a decline) this past Wednesday's low is tested (i.e., DJIA 8598). If it holds, the DJIA could rally one more time above today's high and trace out a diagonal triangle top. If it fails, today's high should hold and a selloff back toward the recent lows (or lower) should be underway. In addition to the various technical indicators which continue to forecast a near term top...there were price divergences this week among the major market indices. It appears they are no longer marching higher in lock step. The DJIA, OEX, NDX, RUT and others had their highest weekly closing prices today. The S&P 500, S&P 400 and the Dow Jones Composite made their highest close for the week on Tuesday. This type of action typically occurs at a significant turning point. |
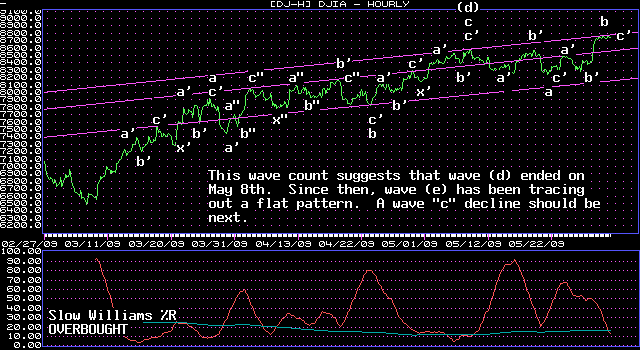
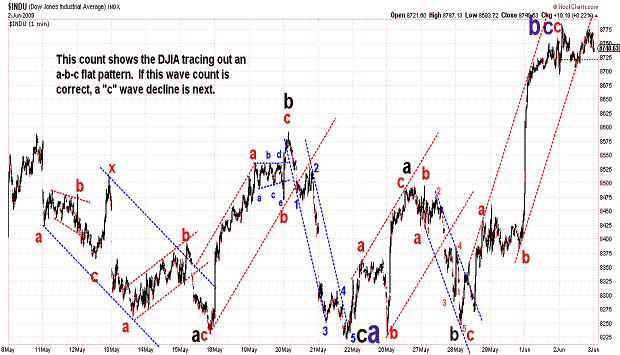
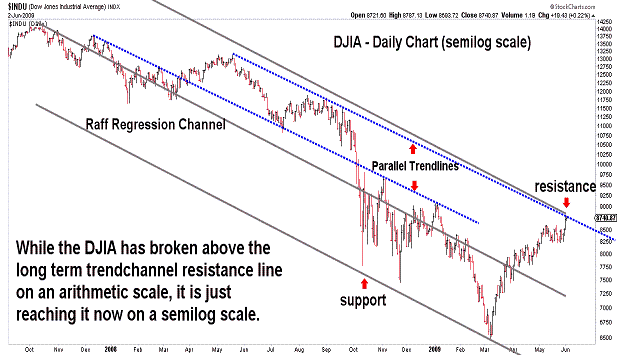
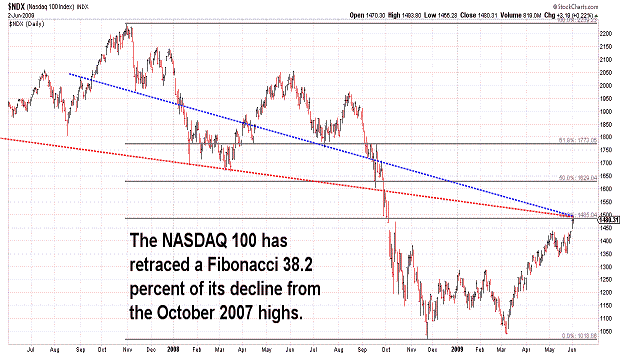
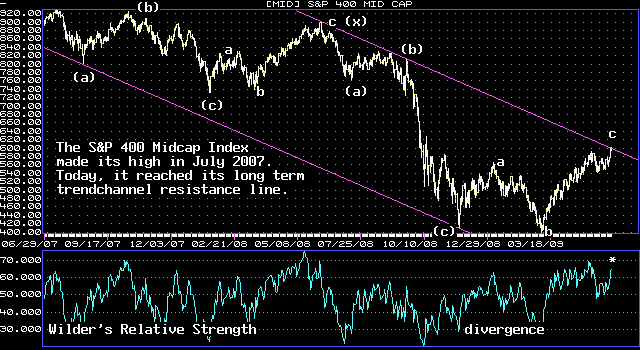
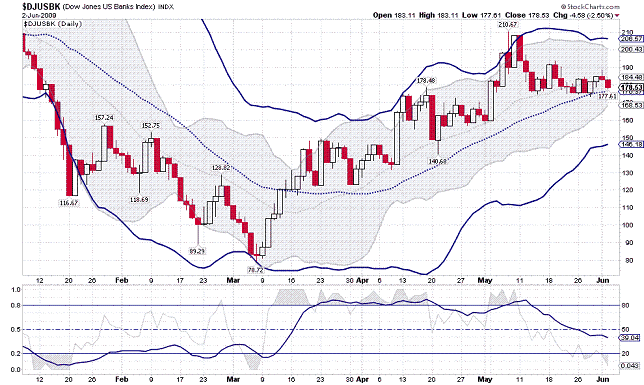
| June 2, 2009 update...The market has gone about as far as it go without negating my preferred wave count. Wave "d" can still be counted as having ended on May 8th (more or less in line with the top in the financial sector and the top in the bank sector the previous day)...as long as the next wave, wave "e", is counted as a flat. If it is indeed a flat, then a serious wave "c" decline needs to begin shortly. If I am wrong and the market continues to rally with increasing strength, I will have to relabel the wave from the March low. As you can see from the charts, however, various technical indicators, bollinger bands, resistance lines, sentiment, etc. point to a near term top. While it is possible, in terms of time, that a topping pattern could extend and become more complex...the market indices would essentially have to go sideways while that is happening. |
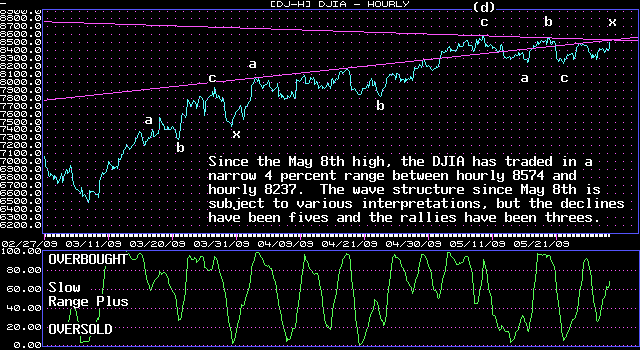
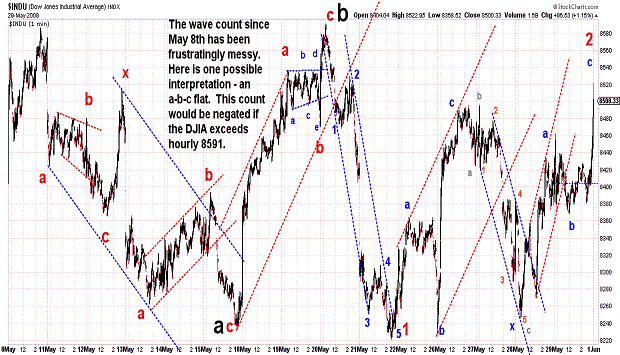
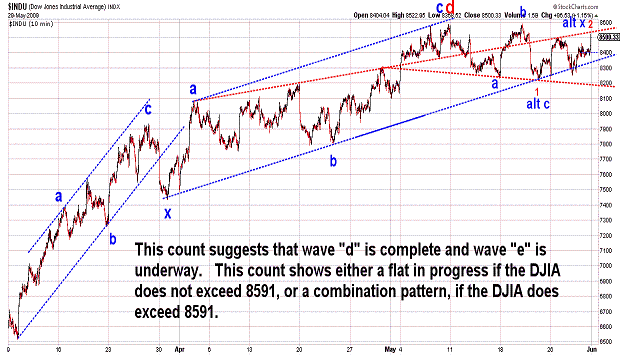
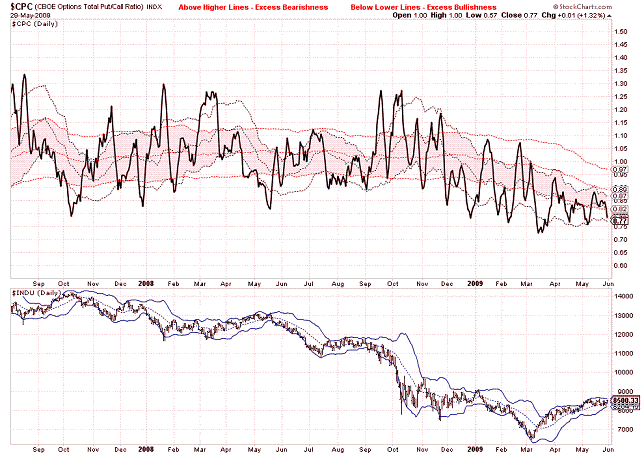
| May 29, 2009 update...The month of May ended on a strong note...at the upper end of its nearly 500 point month long trading range. Since the May 8th closing high (the terminal point of wave "d" under my preferred count), all rallies have been in three waves...indicating countertrend action. The most recent 5 wave pattern occurred over two days from May 20th to the 21st...and was a decline. While it could be the final "c" wave of a flat from May 8th...it could also be the first wave of a larger "c" wave decline. It all depends on the extent of the current rally. If it holds below hourly 8565, then the rally since May 21st could be counted as a second wave...with a sharp third wave decline to follow. If hourly 8565 is exceeded, then the "c" wave ended on May 21st...and the rally since then is most likely an "x" wave within a combination pattern (or, alternatively, a "b" wave of a larger flat pattern). The choppy action over the past three weeks has made anything but short term trading very frustrating. As a consequence of this sideways movement, the Bollinger bands have narrowed considerably...suggesting that a "volatile move" is approaching. With sentiment swinging back to excessive bullishness (a bearish sign), as indicated by the CBOE put call ratio, the next "volatile move" should be down. As always, the market will have the final say! |
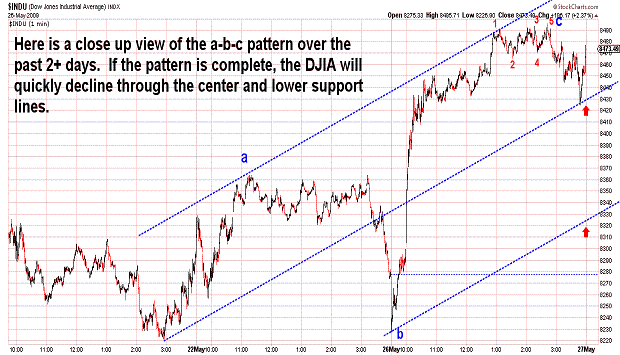
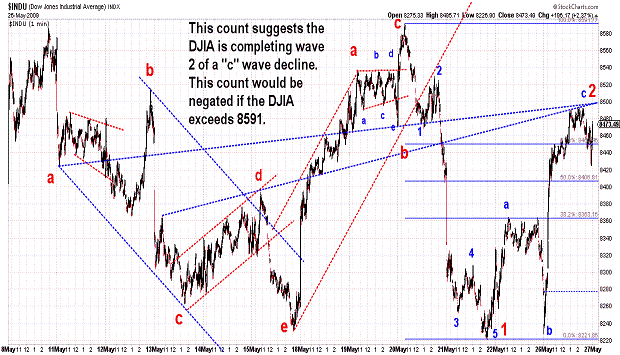
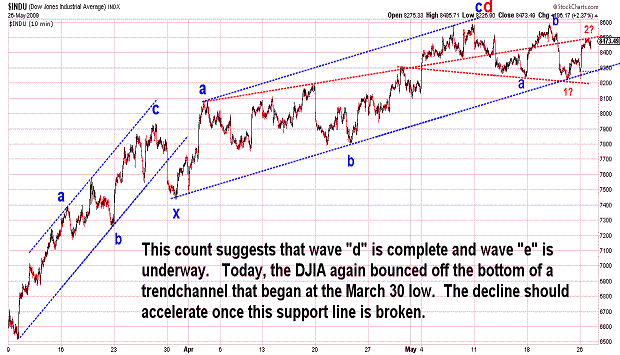
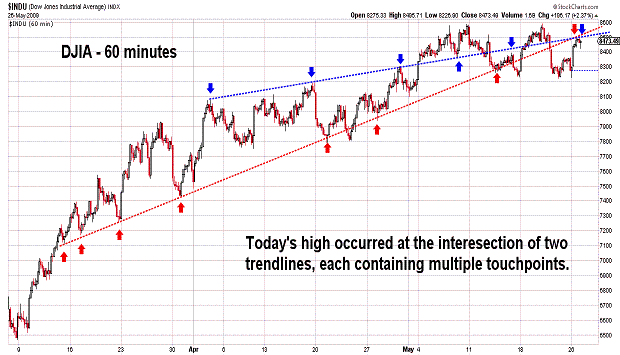
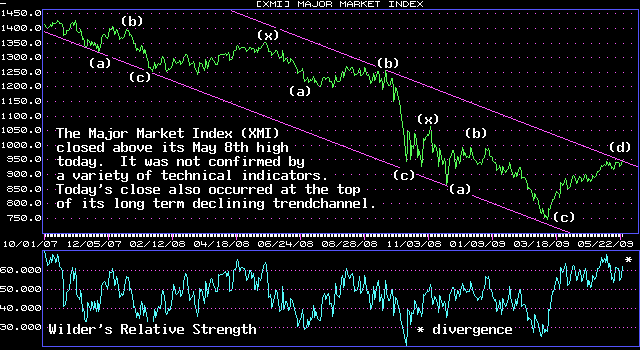
| May 26, 2009 update...Just like last week, this week's first trading session saw prices end significantly higher. Will we now also see a repeat of last week's lack of followthrough with a full retracement of today's rally (or more) by week's end? The divergences among various technical indicators would suggest so. Sentiment indicators would tend to agree. The CBOE put/call ratio, for example, today showed excessive call buying, i.e, 10 calls for every 7 puts. That level, over the past few months, has translated into a near term selloff or sideways action, at best. Last week's hourly high (8565) is the key. If it is not exceeded, the intermediate decline from May 8th will continue and begin to accelerate. If it is exceeded, then a more complex topping pattern (or the "b" wave of a flat pattern) is underway. |
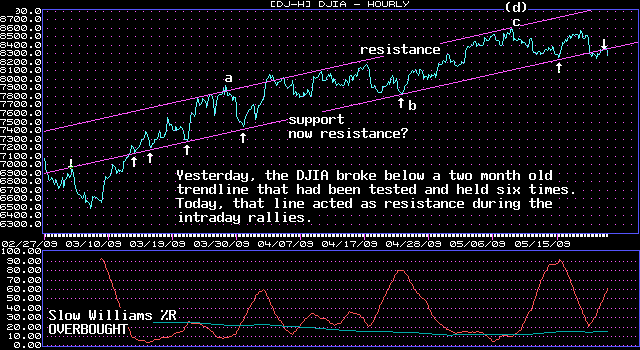
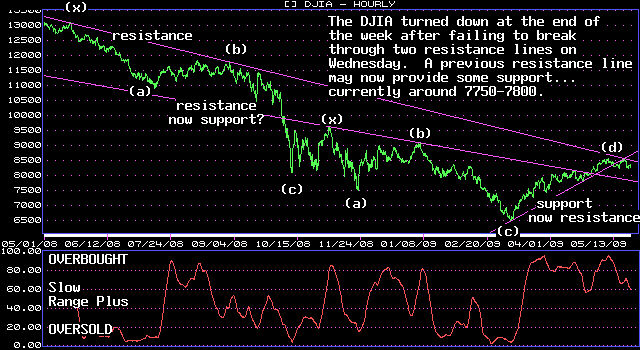
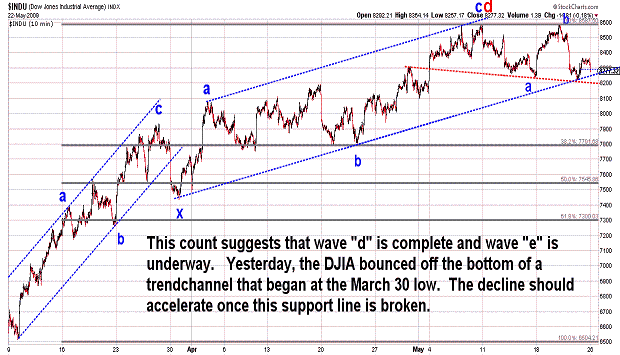
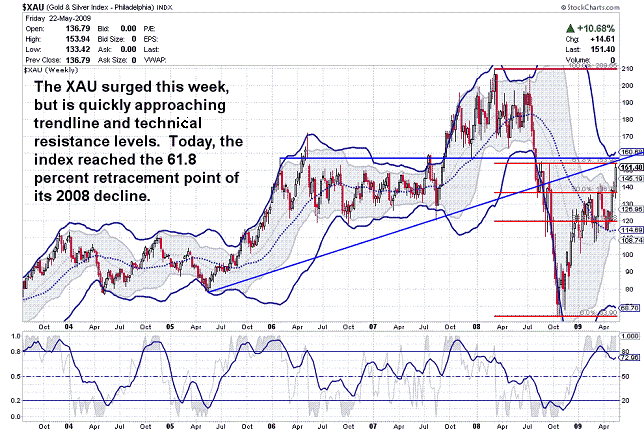
| May 22, 2009 update...Statistically, it was a strange week. The DJIA declined four out of five days, yet the average gained 8 points...all of it as a result of Monday's surge. With hindsight, the light volume that accompanied that one day rally was a warning that it was only a countertrend move against the one degree larger decline that began the previous week. As the above charts indicate, the DJIA (and other indices) are finally beginning to break support lines, one after another...each sequentionally of longer duration and greater signficance than the one before it. The selloff since the May 8th high has been choppy to date...forcing traders to take quick profits (if they want to keep them). Additional choppiness is possible, but at some point (which is not yet clear according to the present wave structure), the decline will accelerate, and staying with the larger declining trend will (I believe) be the winning strategy. |
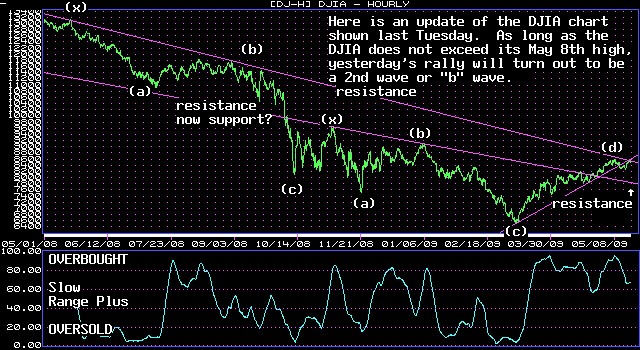
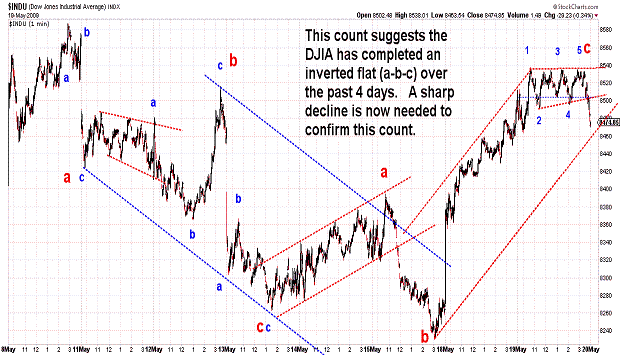
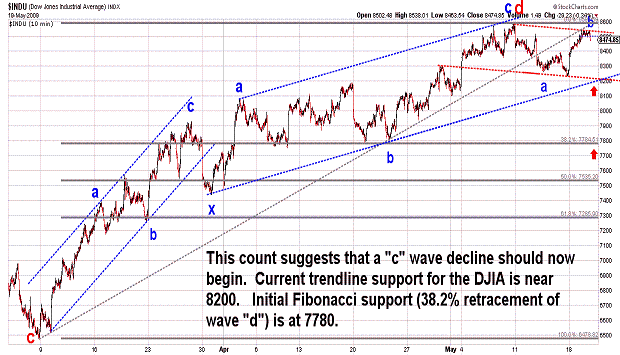
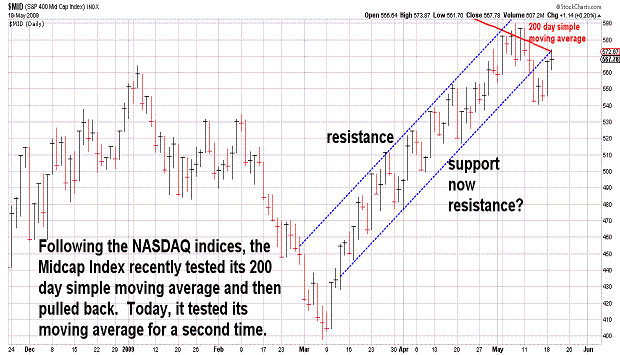
| May 19, 2009 update...On Friday, I said that it was "hazardous" to predict short term action when the shorter term wave structure is "cloudy". With that in mind, I guess I should not have been "surprised" that the DJIA did, in fact, exceed 8400 yesterday. However, as long as the DJIA remains below its May 8th high of 8587, I will stick with my preferred count, i.e., that wave (d) is complete...and wave (e) is underway. Today, the DJIA...and some of the other indices...tested the underside of their recently broken trendchannel. Given the market's current overbought technical condition, including the fact that yesterday's rally, despite its strength, was accompanied by light volume...it is likely that the decline from the May 8th high is now about to resume. As I pointed out on Friday, "...a decline to initial Fibonacci support around 7780 would be logical. This would also be the level where wave c of "d" is completely retraced...a common occurence when one corrective wave ends and the next begins." |
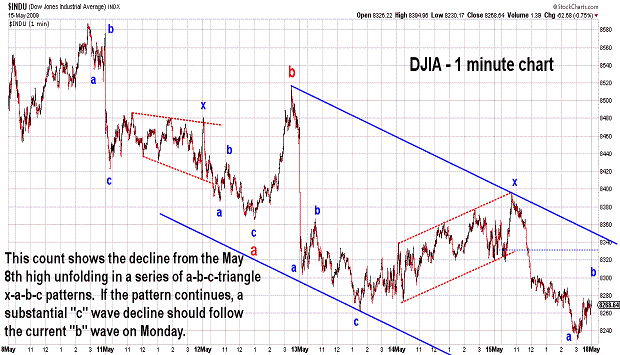
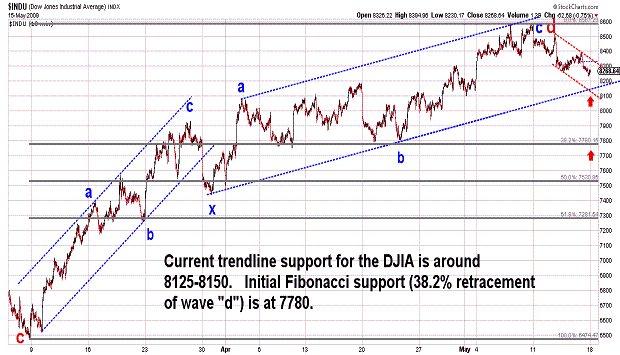
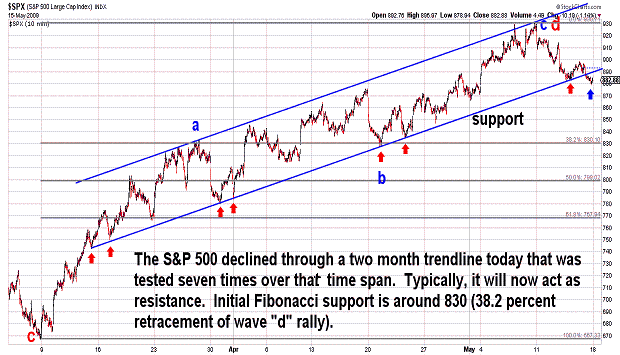
| May 15, 2009 update...The DJIA declined 3 1/2 percent this week...its largest weekly loss since the March lows. The DJIA's action helped give my primary wave count some needed support...which currently suggests that the wave "d" rally from the March lows is complete...and wave "e" is underway. I did not update the DJIA's longer term chart tonight because nothing has changed since it was posted on Tuesday. The three charts above (2 DJIA charts and 1 S&P 500 chart) focus on the shorter term. Unfortunately, it is somewhat cloudy at the moment...because it is filled with both down and up 3-wave corrective moves since last Friday's high. Predicting short term action in these situations is hazardous...but, I think the larger wave pattern and technical indicators suggest a continuation of the decline into next week. If wave "e" is indeed underway, a decline to initial Fibonacci support around 7780 would be logical. This would also be the level where wave c of "d" is completely retraced...a common occurence when one corrective wave ends and the next begins. I would be surprised if the DJIA exceeded 8400 on Monday or Tuesday. It would indicate that a more complex decline was unfolding. Obviously, a rally above 8587 would negate my analysis. |
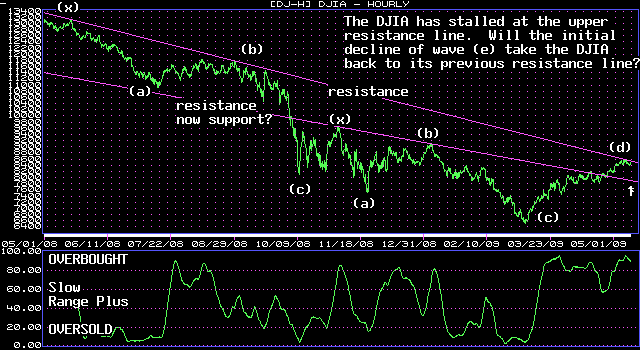
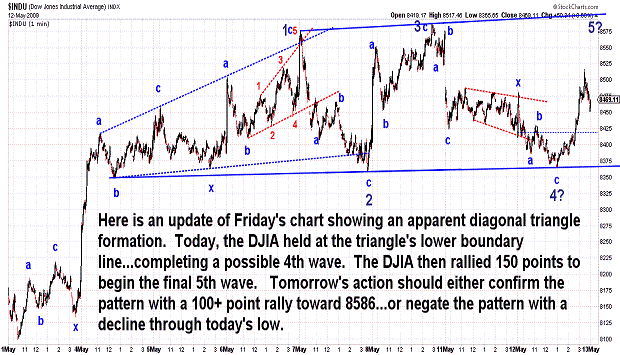
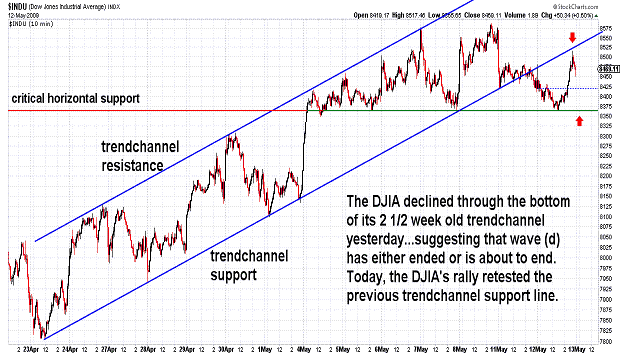
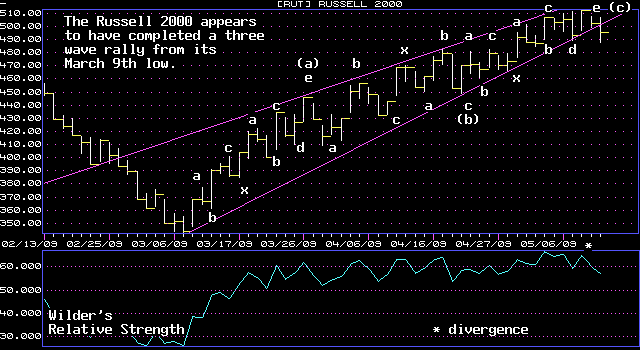
| May 12, 2009 update...On Friday, I suggested that the DJIA might be tracing out a diagonal triangle topping pattern. I said that "...it requires one more down/up sequence in the coming week to complete the pattern." The DJIA action of yesterday and this morning was the down part of the sequence. This afternoon's action was the beginning (possibly) of the up part of the sequence. We should know by tomorrow whether the diagonal triangle pattern actually succeeds or fails. Barring a move substantially above the 8600 level, the rally from the March low (wave (d)) appears to be over (or nearly so)...and a wave (e) decline that takes the DJIA back toward its March low is about to get underway...or is already underway. How low will wave (e) take the DJIA? My best guess at this point is the lower Bollinger band on the weekly chart. Currently, it is just above 6800...but, that level could change slightly by the time the DJIA gets there. |
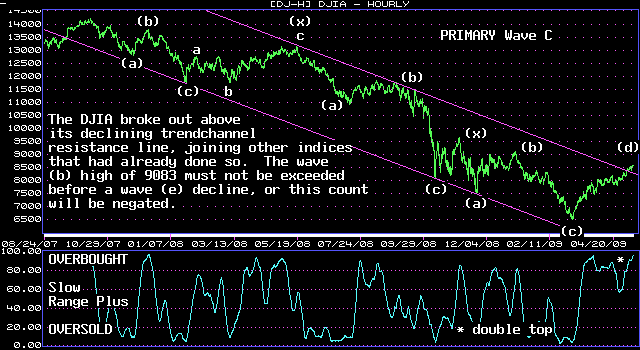
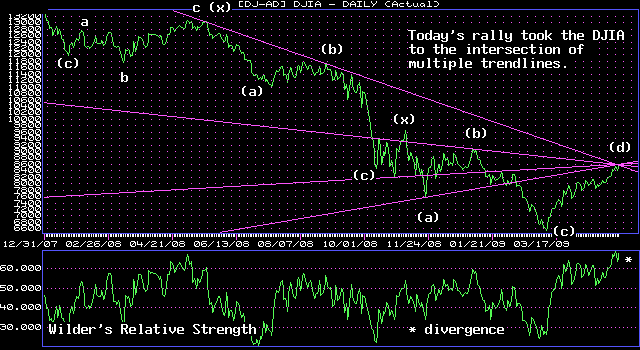
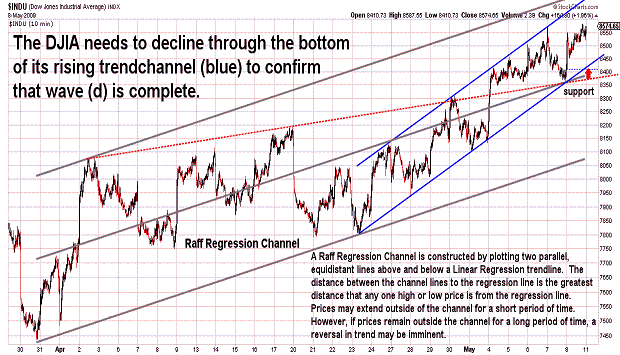
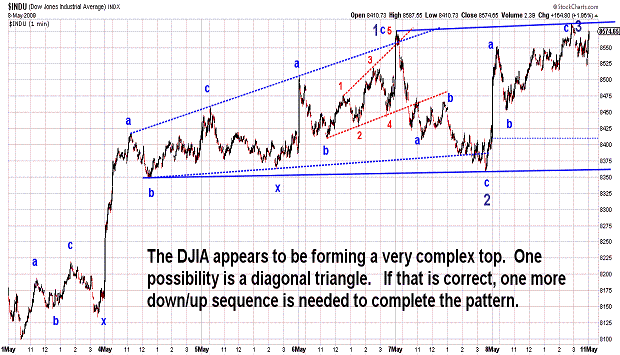
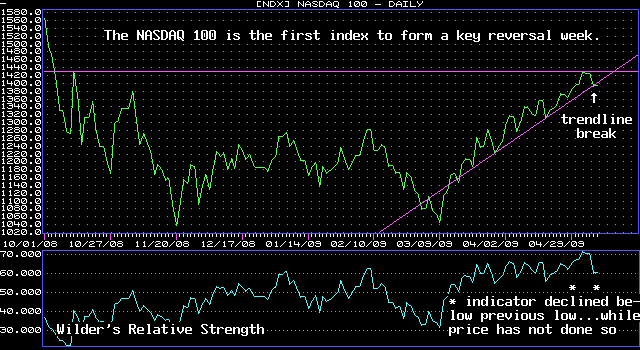
| May 8, 2009 update...The NASDAQ 100 became the first index to form a key reversal week and may be the initial warning signal that wave (d) is nearly complete. In Tuesday's update I said that, with respect to the DJIA, there was a "possibility of a breakout and a short term surge before (the) final decline begins." The DJIA did, in fact, break above its long term declining trendchannel resistance line and followed other indices which had previously done so. In general, following a breakout (or breakdown), a market indice will usually move in that direction for a period of time before correcting or reversing. That is what we see occurring in the DJIA...as it now traces out what appears to be a very complex topping pattern. One possible pattern is shown in the fourth chart above, i.e., a diagonal triangle. It requires one more down/up sequence in the coming week to complete the pattern. Since other patterns are also possible, watch for a break in the DJIA's support lines (as shown in the third chart) to confirm that a reversal is underway. |
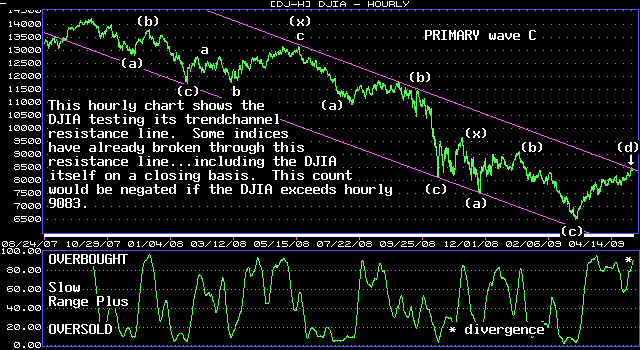
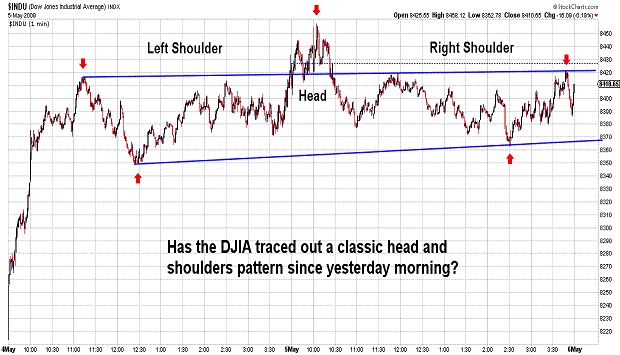
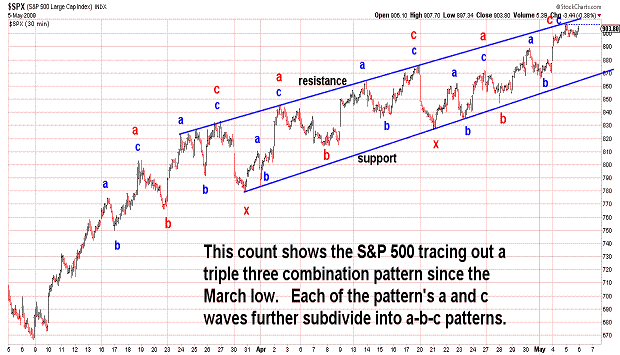
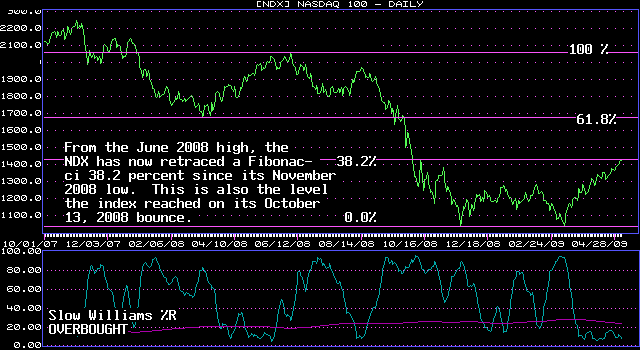
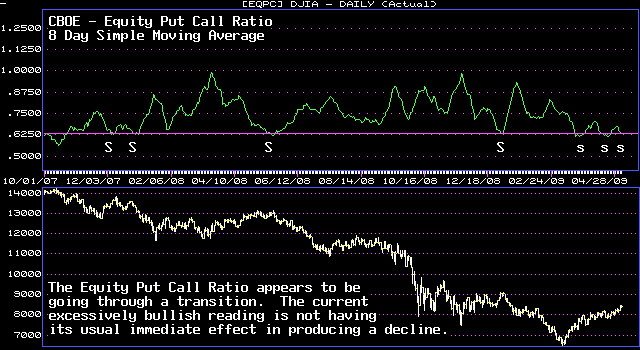
| May 5, 2009 update...I am short on time tonight, so I'll keep this brief. The market is at a critical juncture. Most of the tools in my technical toolbox suggest to me that the rally from the March low should be ending now...and a final decline to test the March lows should begin. However, with the DJIA and some other indices at their long term trendchannel resistance line, there is a possibility of a breakout and a short term surge before that final decline begins. I think yesterday's low is the key. If that level is quickly broken, wave (d) is likely complete...and wave (e) is underway. If not, wave (d) may have one final surge. |
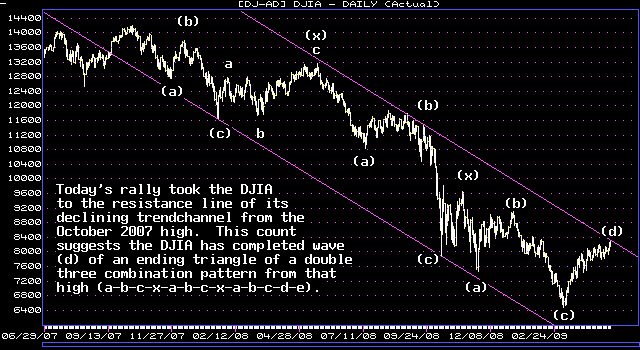
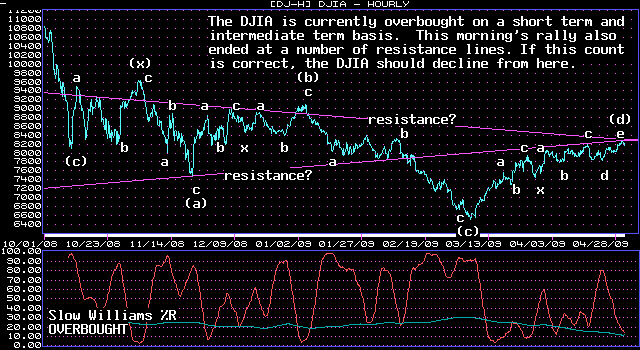
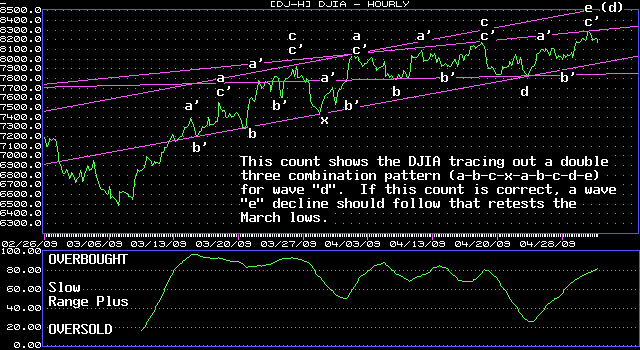
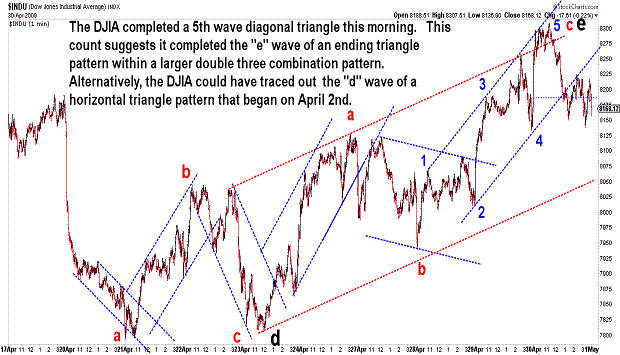
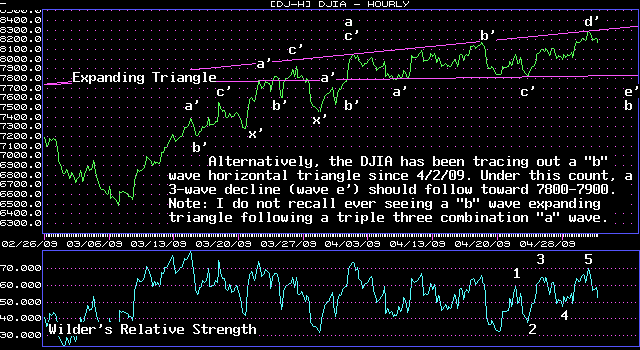
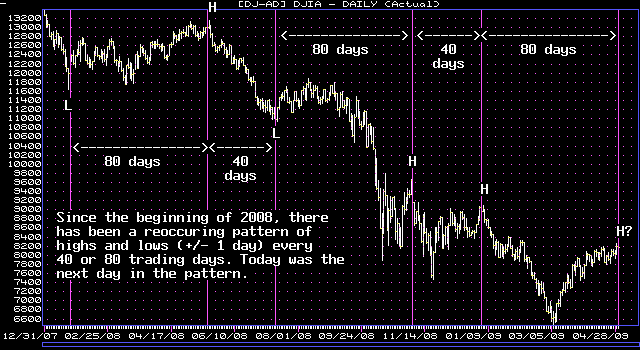
| April 30, 2009 update...I decided to do the regular Friday update one day early because today's "key reversal" action was potentially very significant. This morning's rally took the DJIA to an important resistance point, namely the upper boundary of the trendchannel from the October 2007 high. I said many weeks ago that I thought the rally from the wave (c) March low would reach that level. And, according to my primary wave count, I thought that this was the most likely terminal point for wave (d) of the pattern from the October 2007 high (see first chart). Theoretically, wave (d) could end at a higher level above the trendchannel...but, as of this moment, I rank that as a less likely possibility. At the very least, the market should experience some type of pullback in the short term. Why? Because an important trendline is rarely penetrated the first time it is touched. The alternate count in the fifth chart above allows for the "continuation of wave (d)" scenario if, in fact, it is not complete. Timewise, there is a reoccuring 40/80 trading day cycle that has unfolded since the beginning of 2008. If the pattern is still unfolding, today was the next turn date (plus or minus one day). We'll see! |
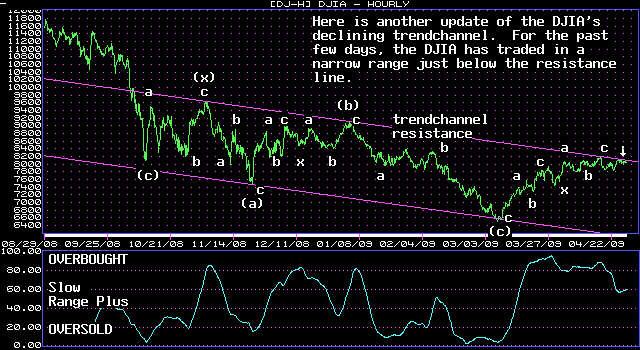
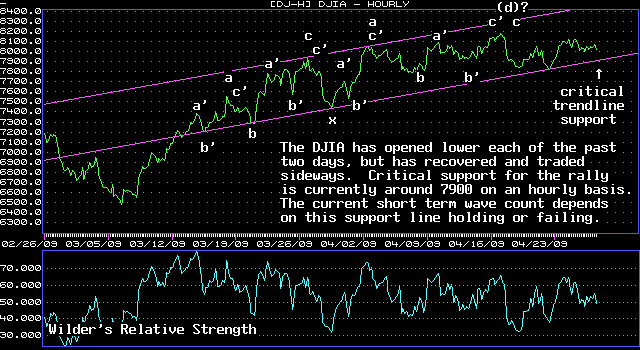
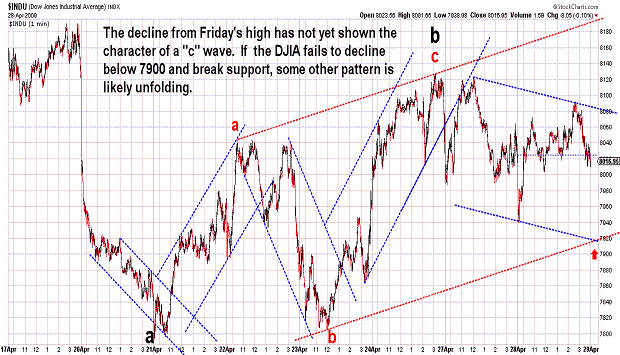
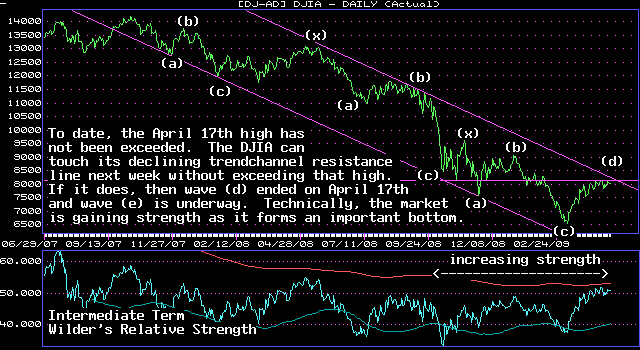
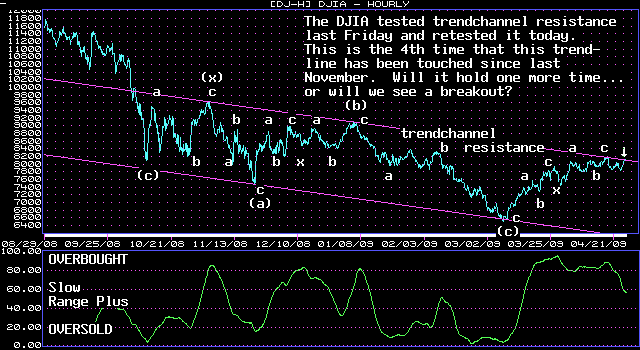
| April 28, 2009 update...The "obvious" "b" wave (a-b-c) rally in the DJIA from last Tuesday to Friday is now far less "obvious" given the DJIA's action over the past two sessions. If the count is indeed correct, a "c" wave decline should be underway. However, the choppy action so far is atypical of such a decline...and opens up the possibility that something else is transpiring. The 7900 level is now critical support...and must be breached in the next day or so if this wave "c" pattern is unfolding. If the DJIA instead rallies higher in the next few days, it is possible that the DJIA is tracing out a diagonal triangle pattern...and should rally above the April 17th high. If that happens, I don't think the average would rally beyond its declining trendchannel resistance line (see fourth chart). |
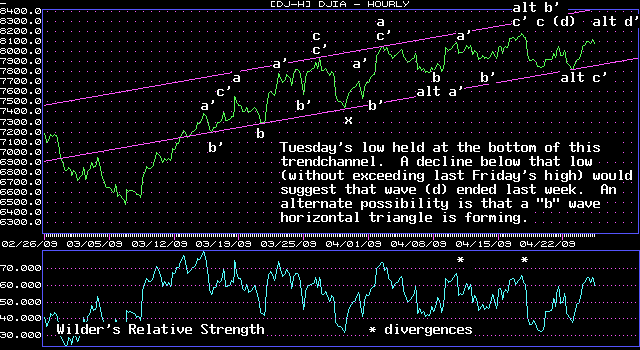
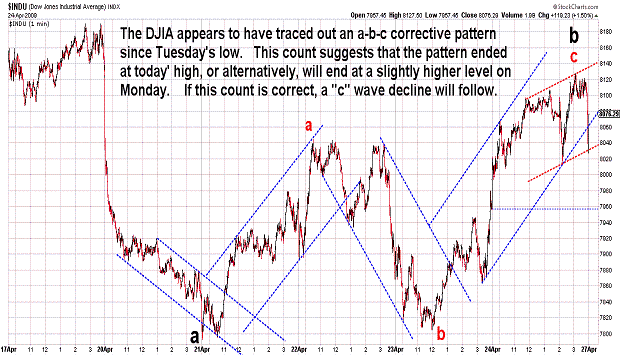
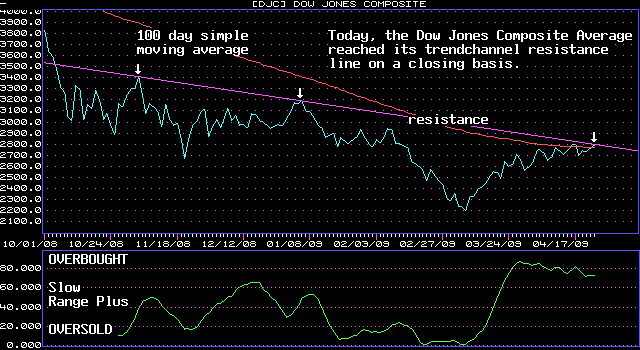
| April 24, 2009 update...Although the DJIA rallied 190 points over the past two days, it still lost 55 points for the week. But, a few indices, like the NASDAQ 100, were higher for the week...and showed improving relative strength. I indicated on Tuesday that the current pattern was unclear...and that the market could "go either way in the in the next few days or so." In fact, depending on the particular indice that you choose, it went both ways. The Major Market Index (XMI), for example, declined below Tuesday's low yesterday. Today, the NASDAQ 100, S&P 400, and Russell 2000 indices exceeded last Friday's high. Most other indices held above Tuesday's low, but did not exceed last Friday's high. The clearest pattern right now in the DJIA, S&P 500 and OEX appears to be a "b" wave a-b-c pattern from Tuesday's low (see third chart above). If so, a "c" wave decline (below Tuesday's low) should unfold next week. The extent of the decline depends on the larger pattern that is currently unfolding. Right now, I can see a number of possibilities...half suggesting a serious decline...and, the other half suggesting something more modest. In these situations, it is usually best to take your profits quickly. Scaling in and out works best for me. |
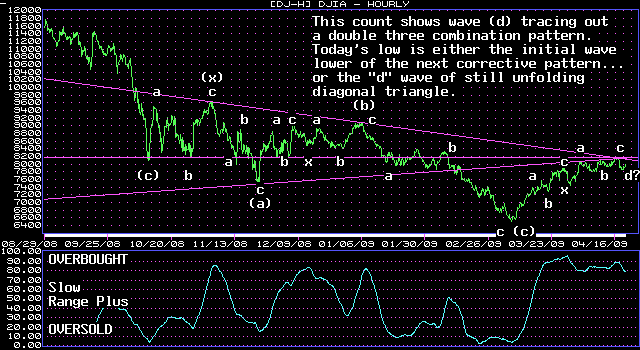
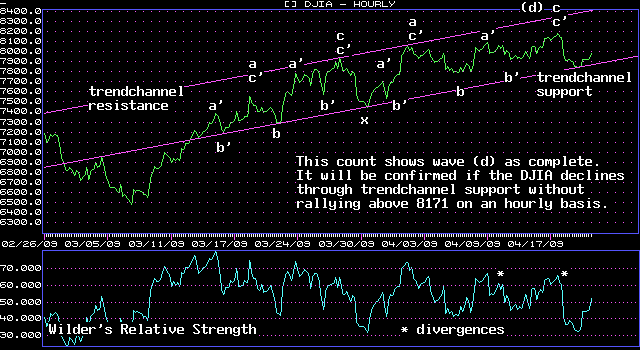
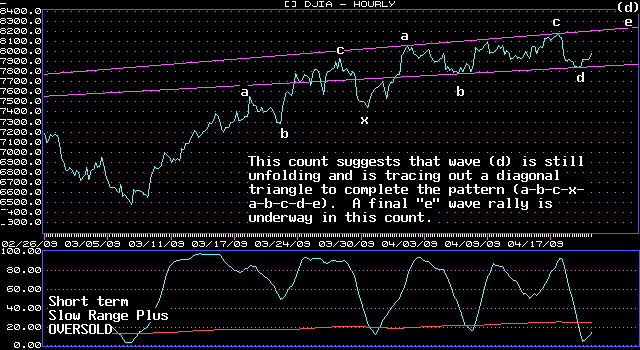
| April 21, 2009 update...Today's action leaves the market at a critical juncture. Unfortunately from a trading perspective, the current wave pattern allows the market to go either way in the next few days or so. Either the DJIA will rally to complete the wave pattern from the March low...or, it will decline and continue the next corrective wave pattern that began yesterday. The charts above show the wave counts for both possibilites. Today's intraday low is the key. If it is breached, the DJIA is likely headed to the 7500-7600 area. If it holds, a final rally back above 8200 is likely. |
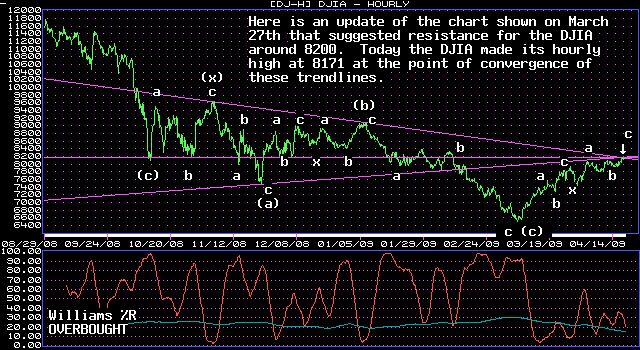
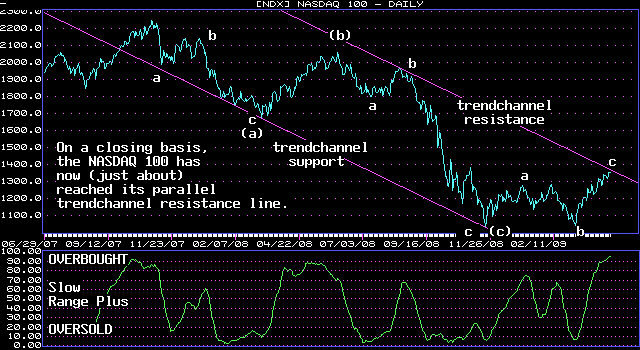
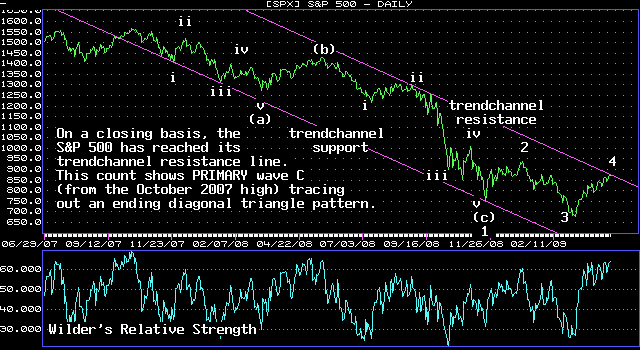
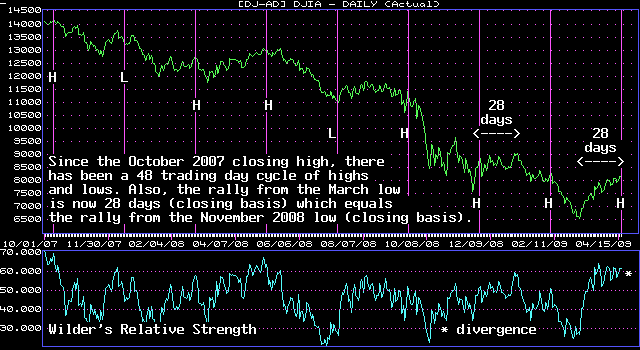
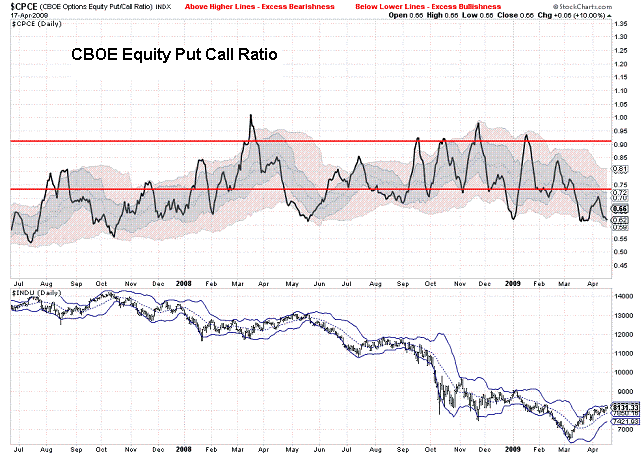
| April 17, 2009 update...Today, the DJIA challenged a convergence of resistance lines that was first pointed out in the March 27th update (see first chart above). The factors suggesting that the rally from the March low is over (or nearly so) have finally begun to outweigh, in my opinion, those that suggest it has further to go. While it is still possible (maybe even likely) that the DJIA will reach its declining trendchannel resistance line (from the October 2007 high) before retesting the March lows, it could do so weeks from now (during the next corrective wave pattern) when that line has moved below the DJIA's current level. Here are the current factors I am concerned about: Pattern...in terms of a variety of Elliott wave counts, the pattern from the March low can be counted as complete. Price...the DJIA has reached several levels of resistance, both in terms of trendlines and bollinger bands; it is overbought on a short term basis and intermediate term basis; and various technical indicators have diverged and not confirmed today's high. Time...the DJIA's current rally has now lasted the same number of days as the previous rally from the November low; a 48 day cycle also suggests that the market is due for a change in direction. Sentiment...put call ratios have now reached excessively bullish levels which over the past 18 months have coincided with a market top. The only major factor I presently see moving the market higher is momemtum...so, when that rolls over, so will the market! |
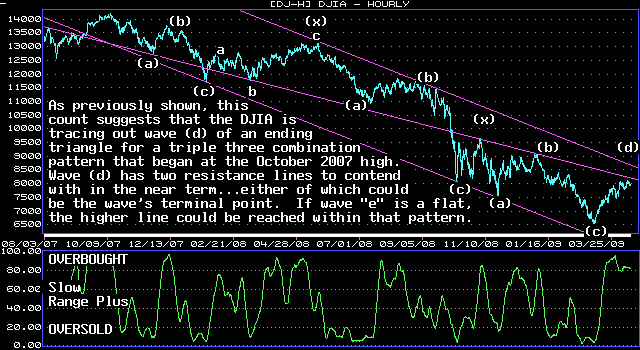
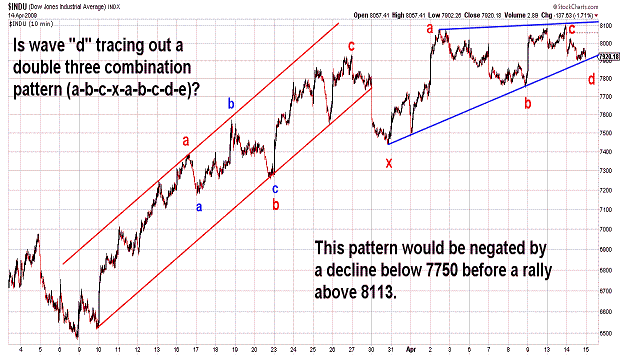
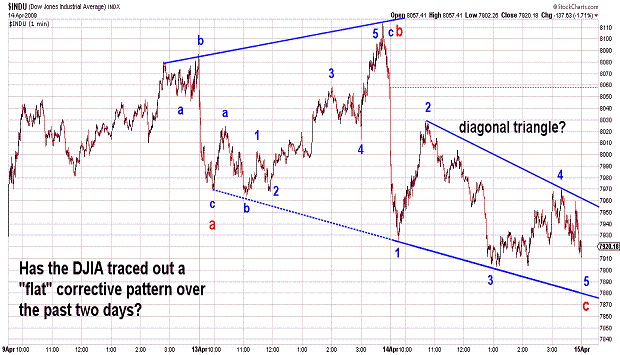
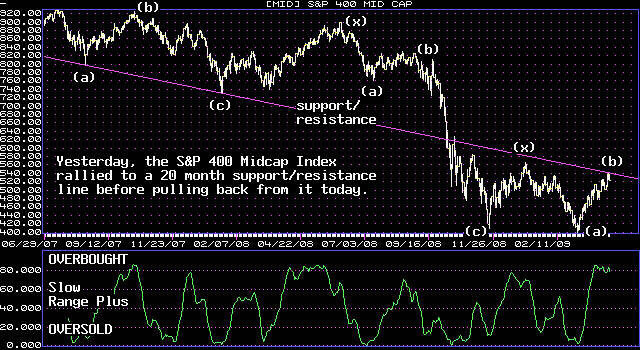
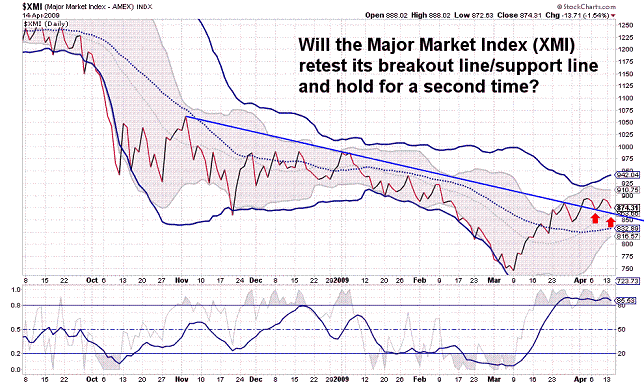
| April 14, 2009 update...My primary wave count has the DJIA tracing out a wave "d" rally from the March low. In terms of its pattern, it would look best with at least one more rally. The second and third charts above suggest one possble wave count for the current pattern...but, there are others that are still viable. Two important resistance lines are shown in the first chart...and I expect wave "d" to complete its pattern at one of those lines. (Take a look at the S&P 400 chart which has already reached an important resistance line.) It has been my sense that the DJIA would challenge its trendchannel resistance line from the October 2007 high before wave "e" retests the March low. I had thought it was most likely to do that during wave "d"...but, given the fact that the pattern of wave "e" will (under this count) be a corrective pattern, it could trace out a "flat" pattern and reach the trendchannel resistance line within that pattern. Short term trading is tricky right here...I moved to the short side Friday and yesterday...but, took profits today. Assuming that there is one more rally in the coming days, I will be watching the PROFUNDS Short Real Estate Fund for a possible trade once the rally concludes. |
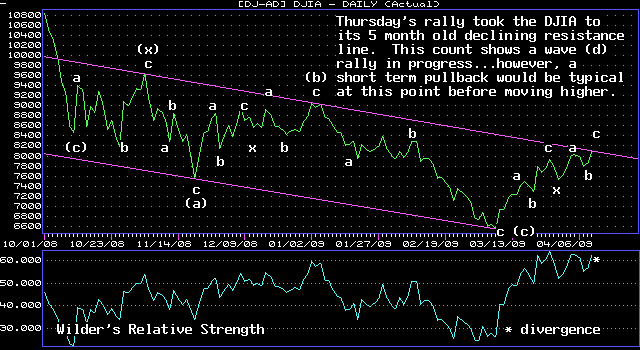
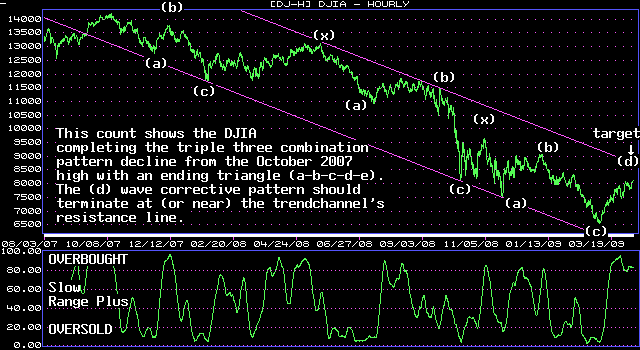
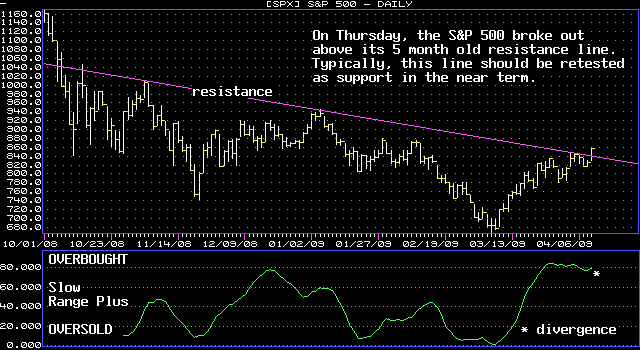
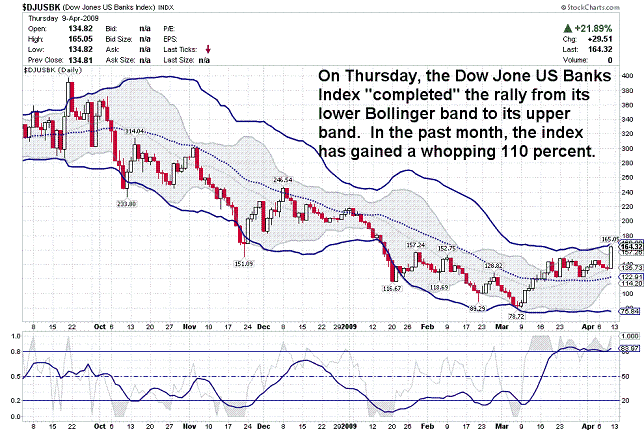
| April 10, 2009 update...While yesterday's rally took the DJIA right to its 5 month old declining resistance line, other indices, like the S&P 500, broke out above their resistance lines. Some consolidation is likely near term before the DJIA (and other indices) continue their advance...to the declining trendchannel resistance line from the October 2007 high. As of today, that is the most likely target for the wave (d) rally that has unfolded since the March low. Once that level is achieved, a final (e) wave decline should occur (under this wave count). The time element is variable...but, if wave (d) lasts as long as wave (b) (29 trading days), then wave (d) has 5 more days to go. We'll see! One week before the actual March low, I began posting charts of the Dow Jones US Bank Index...and suggested that its pattern called for a reversal and explosive rally. If you were lucky enough to buy a bank fund or bank related ETF at that time, you have now doubled your investment (or more than doubled it with a leveraged fund or ETF). I sold all of my remaining shares yesterday. |
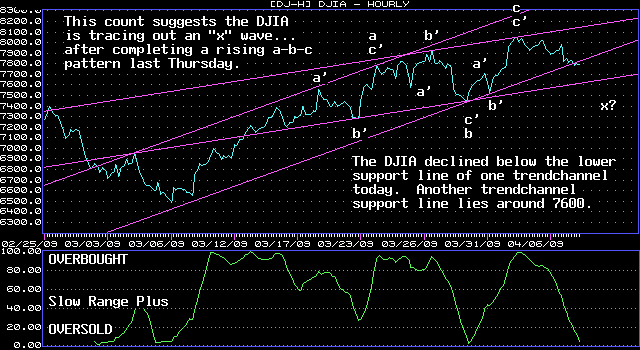
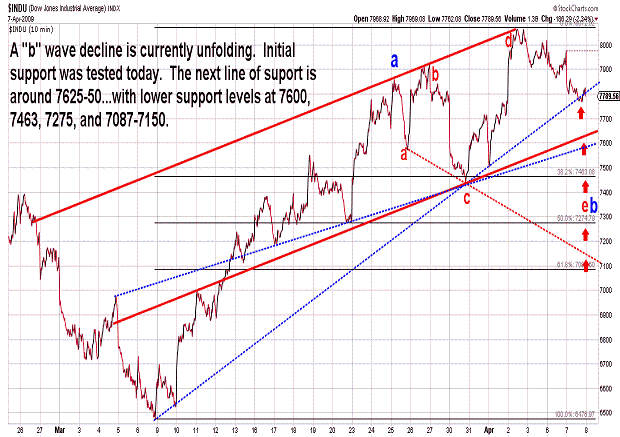
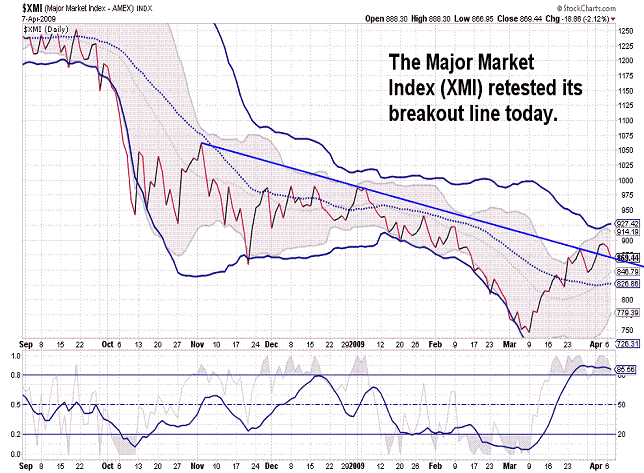
| April 7, 2009 update...The resistance areas that were pointed out in the past few updates did indeed prove formidable as the market declined yesterday and today. There are several alternate ways to count the DJIA's present action, but on a weekly chart (assuming last week's high is not exceeded) it is best counted as a "b" wave. The second chart above shows a number of current support lines for the DJIA. The exact level for the end of the "b" wave will depend, however, on the wave's corrective pattern...which, at this point, has a variety of options. Typically, the DJIA (and other indices) should reach a short term oversold level before wave "b" is complete. We are not quite there yet! |
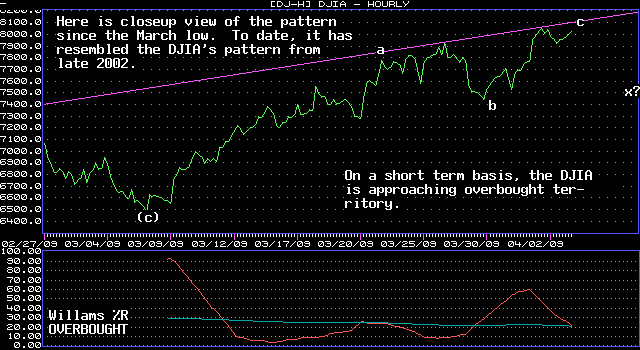
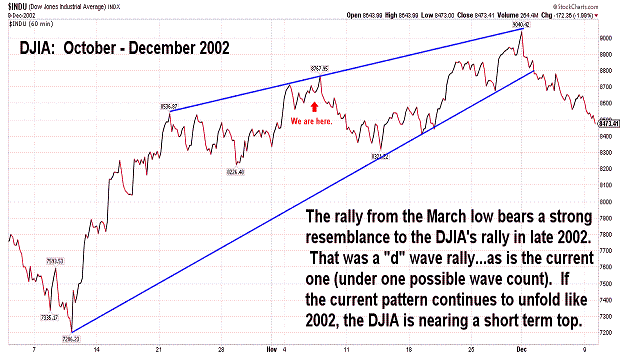
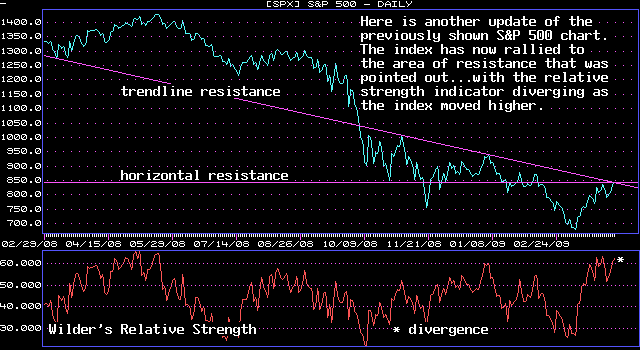
| April 3, 2009 update...Yesterday and today, the market indices rallied to the area of resistance that was pointed out in recent updates. As shown in the first chart above, the DJIA is close to short term overbought territory...and that condition, taken together with its current pattern, suggests that the average is likely near a short term reversal point. The second chart shows the DJIA's pattern in late 2002...which, to date, has been serving as a model for the DJIA's pattern since the March low. While there is no guarantee that the similarity between the patterns will continue, the coming short term selloff called for in the 2002 pattern is also now implied by the market's current technical condition. The third chart updates the S&P 500 chart that was shown recently...and, as you can plainly see, the index has reached the area of resistance that was pointed out as a target for the recent rally. Next week the market's current strength will certainly be put to the test! |
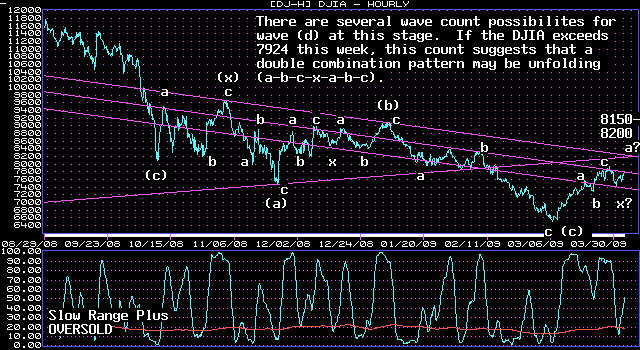
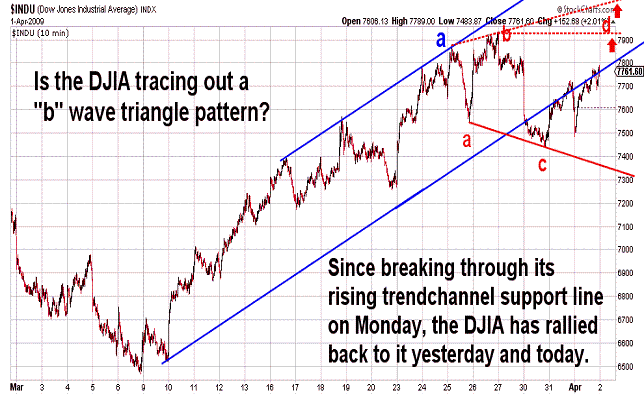
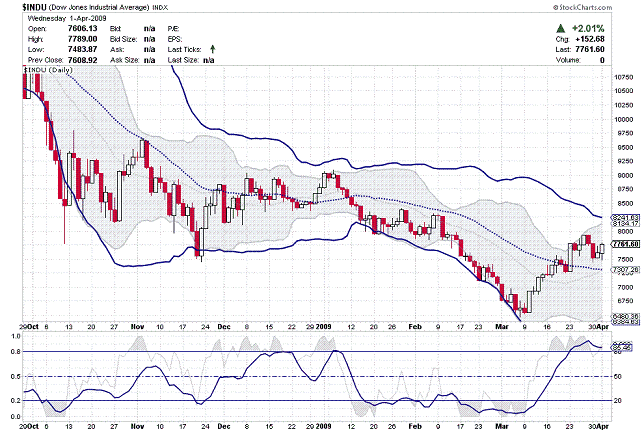
| April 1, 2009 update...The market opened sharply lower this morning...but, today was "April Fool's Day", so the market reversed and rallied to fool the shorts. The DJIA began a corrective pattern near the end of last week. It is not yet clear what type of corrective pattern is unfolding...but two possibilities are shown in the charts above. One possibility is that a double combination pattern is unfolding from the the March low. In this case, the second "a" wave is now underway with a rally headed toward the 8100-8200 area. A "b" wave decline and a "c" wave rally would follow. An alternate possibility is that the DJIA is tracing out a triangle pattern for wave "b". Within the triangle, a wave "d" rally is currently underway. Here the end of the current rally (wave "d") is less clear...with a likely top anywhere from last weeks high at 7924 to 8200 or so. Still other alternate possibilites exist as well...but, given the placement of the upper bollinger bands (as shown in the third chart) it is unlikely that the current rally would extend beyond 8134-8241 before the next pullback. |
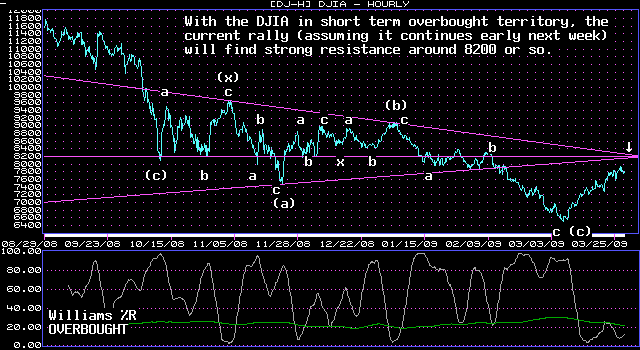
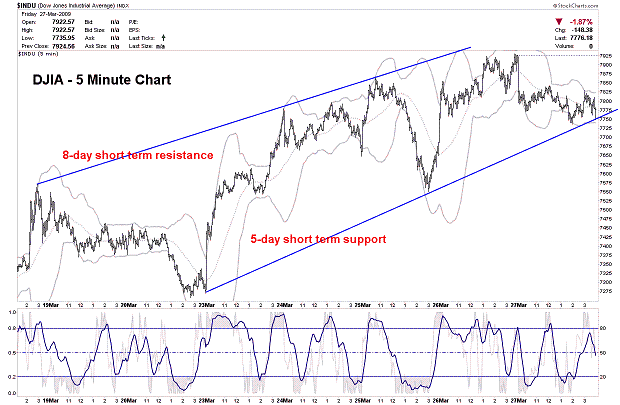
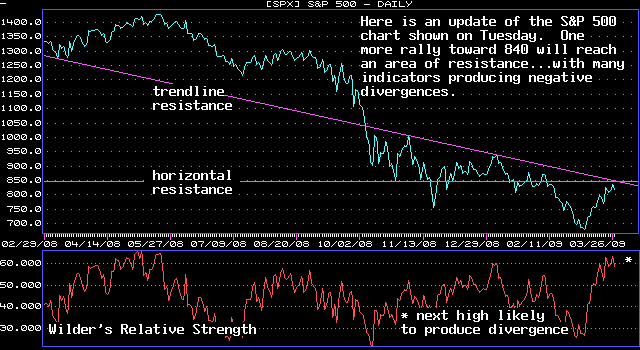
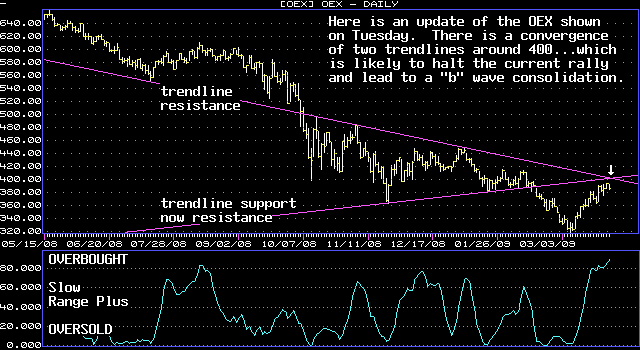
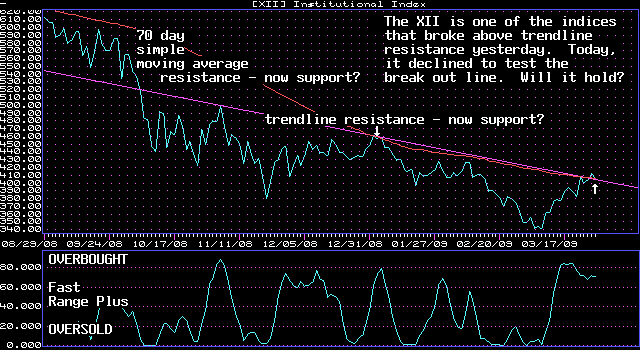
| March 27, 2009 update...Despite today's 148 point selloff in the Dow Jones Industrial Average, it gained almost 7 percent for the week. The DJIA has now rallied over 1200 points since its March 9th closing low at 6547. On a short term basis, it is unquestionably overbought...but such has been the case ever since Monday's big 500 point rally. Selloffs the past 4 days have been modest...and, with the quarter coming to an end next week (which is typically a bullish period), the market may just continue to rally right into the beginning of the next quarter on Wednesday. The charts above again show the areas of resistance...which were pointed out on Tuesday. Unlike this week, however, higher highs next week are likely to be accompanied by divergences among various technical indicators. This increases the odds that a "b" wave consolidation is likely to follow new highs next week if, in fact, they do occur. We'll see! |
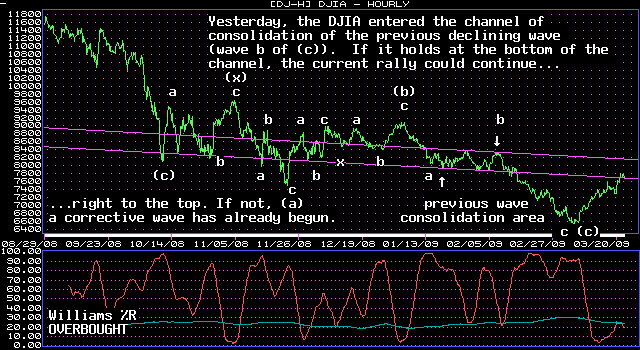
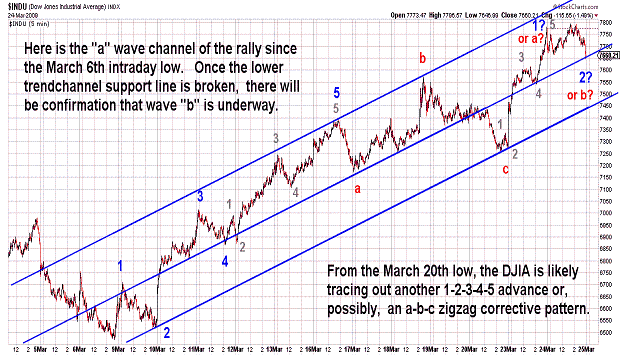
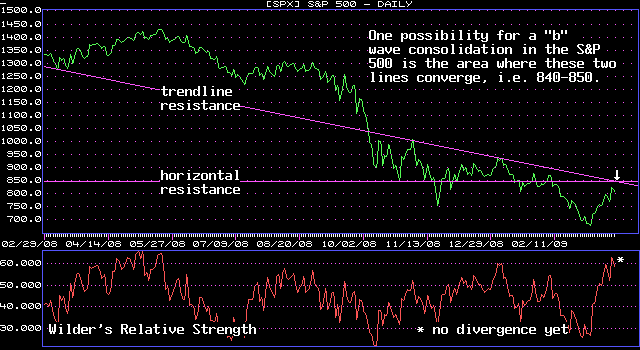
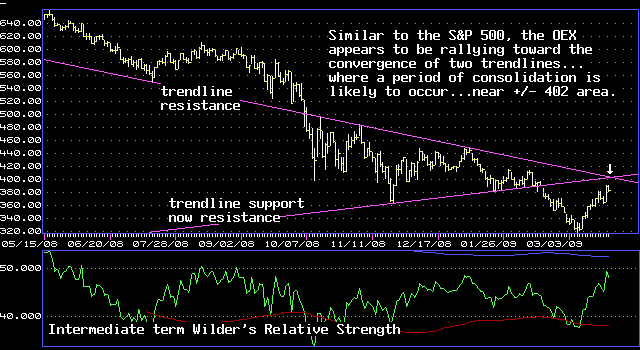
| March 24, 2009 update...On Friday, I suggested that if the rally resumed before the short term technicals reset to an oversold condition, "...it would indicate that the market has significant strength and should rally next to the 7800-8000 area." Today, the DJIA reached within 3 1/2 points of 7800 before selling off to close at 7660. The market remains at short term overbought levels...and a corrective pattern can begin at any point. But, when an intermediate term trend is strong (like this one), a rally can continue to push higher in spite of these short term overbought levels. The charts above point out some resistance points where, if the rally does continue higher in the next few days, the market is most likely to begin a "b" wave consolidation pattern. There is no guarantee that a pull back won't begin before then...but, those suggested points are, nonetheless, the most significant resistance areas just above today's highs. |
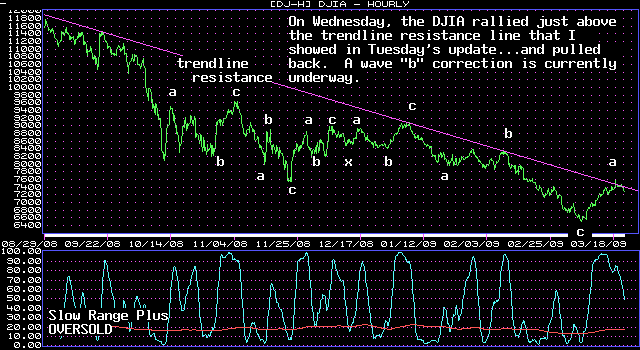
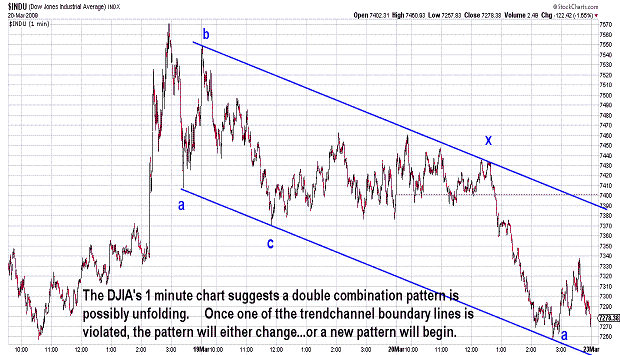
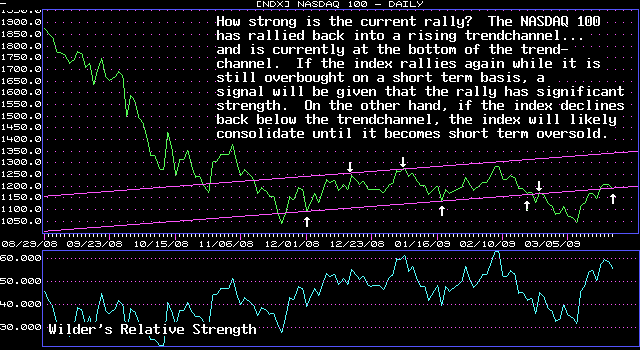
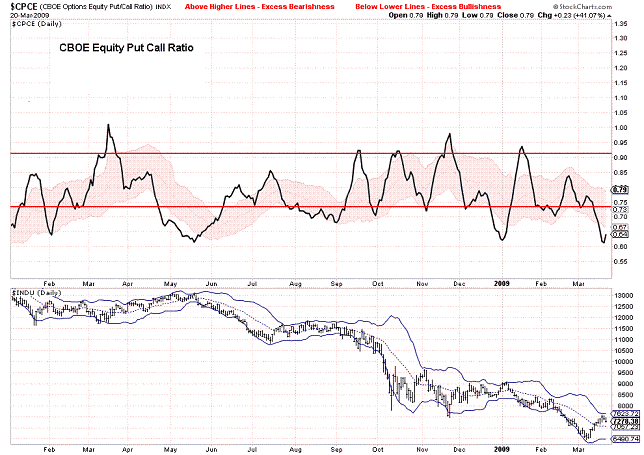
| March 20, 2009 update...On Tuesday, I suggested the DJIA was likely to challenge the declining trendline from the Spetember 19, 2008 high. It did on Wednesday...momentarily breaking through it and then closing right on it. I also said that given the market's short term overbought condition, it was "likely that a short term consolidation of some type" would follow (wave "b"). It has. The next question is obvious: when will the rally resume? From a technical standpoint, the indicators need a few more days to reach oversold territory and reset. If the rally resumes before then, it would indicate that the market has significant strength and should rally next to the 7800-8000 area. A more likely outcome...especially given the excessively bullish put/call sentiment indicators (see chart)...is for the market to consolidate a bit longer. That does not mean, of course, that a good rally can't occur within the currently unfolding consolidation pattern. As of today, I think the worst case scenario is a decline to the 7000 area...currently, the top of the previous declining trendchannel from the January 6th high (note that this line is declining 40-50 points per day). |
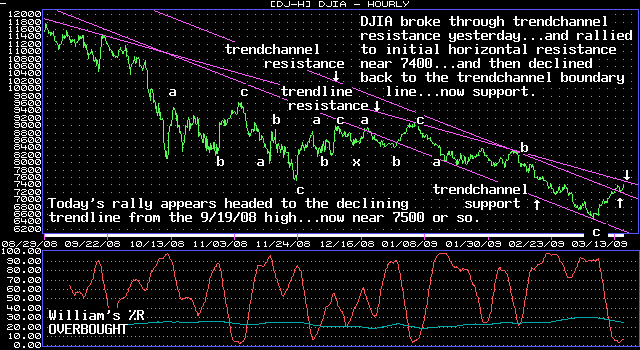
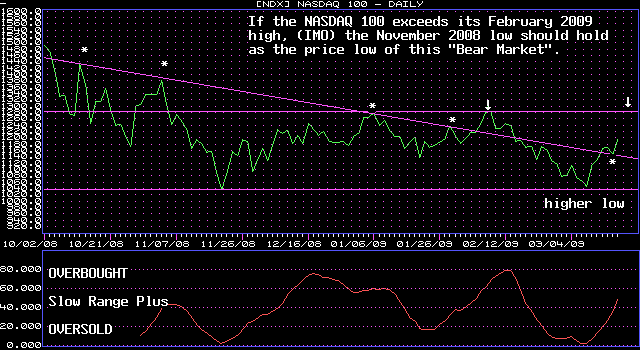
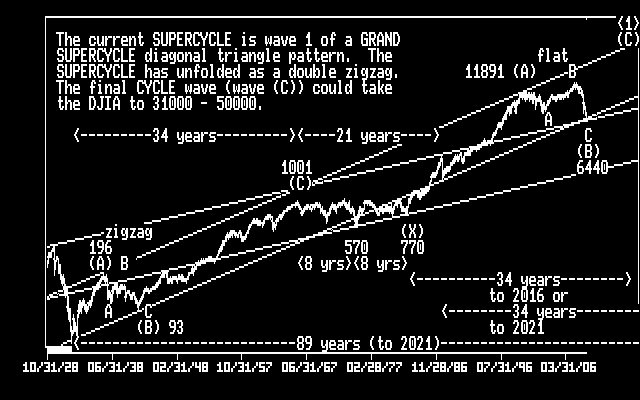
| March 17, 2009 update...In this past Friday's update, I pointed out in the first chart that initial resistance in the DJIA was around 7400. Yesterday, the DJIA rallied to within 8 points of 7400 and then backed off...today, the DJIA rallied to within 4 points of 7400 and held. If the DJIA continues higher tomorrow, the next resistance line will be the declining trendline from the September 19, 2008 high (see chart above and Friday's second chart). With the DJIA and other indices in short term overbought territory, it is increasingly likely that a short term consolidation of some type is about to occur. The only questions are when and at what level will the pullback occur. I am watching that trendline for an indication. I expect that line to initially hold, but if it is exceeded tomorrow, it would show that the current rally has significant strength...and the rally would probably continue right up to the 7800 to 8000 area. We'll see. I updated the chart of the SUPERCYCYLE pattern. The area of this month's low is important if I am right about the DJIA's long term pattern. Any significant violation of the low would break trendchannel support...and suggest that some other long term pattern is unfolding. |
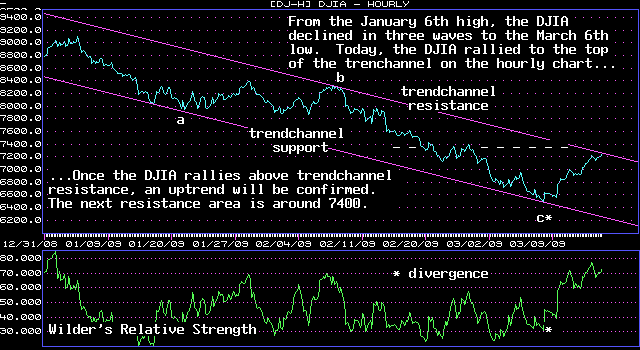
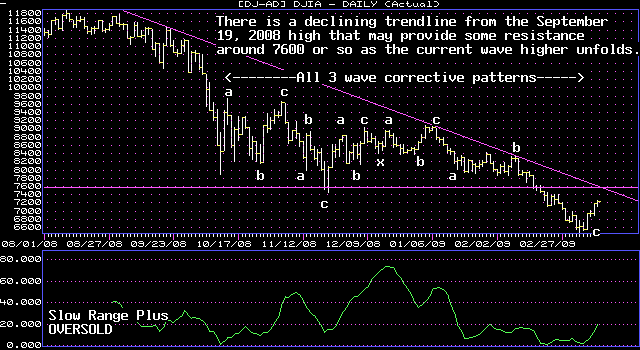
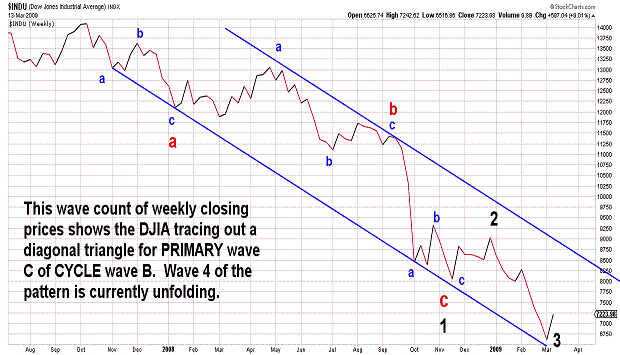
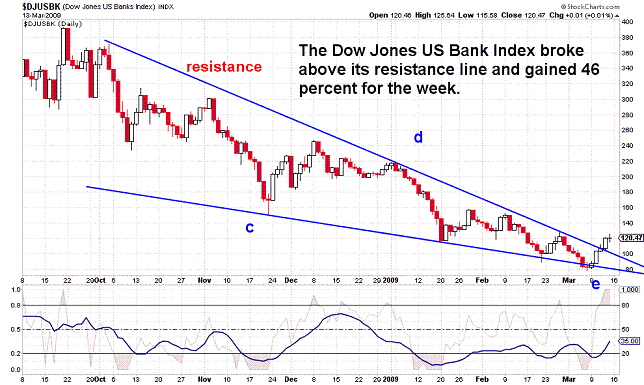
| March 13, 2009 update...What a difference a month makes! In February, "unlucky" Friday the 13th was a loser and so was the week...down 82 points and 430 points respectively. Today, as a rare second consecutive monthly Friday the 13th occurred, the DJIA rallied 54 points...and, for the week, the DJIA gained nearly 600 points (+9 percent). So, is the worst now behind us? Is this the beginning of a long term rally to new all time highs. Unfortunately, for the broader indices, it's too soon to tell. The patterns in these indices suggest (at least to me) that a multi-week rally is underway. However, their wave patterns do allow for one more retest of the lows down the road. This retest will probably lead to new lows in some indices...but, not all. If and when that occurs, it should be the bottom (in my opinion) for many years to come. One of the indices that does look to me like it HAS made a long term bottom is the Banking index. For the week, the Dow Jones US Banks Index gained 38 points and was up a whopping 46 percent. If the news on banks continues to get better, this index could rise another 80+ points in a relatively short period of time. That seems like a tall order...but, it would merely take the index back to where it started the year. |
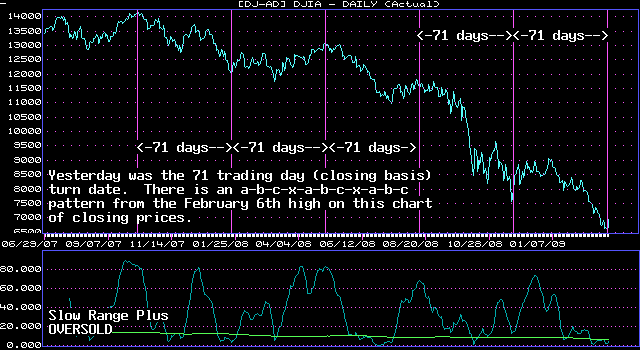
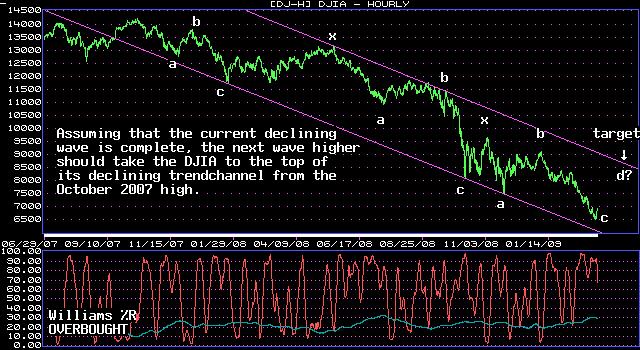
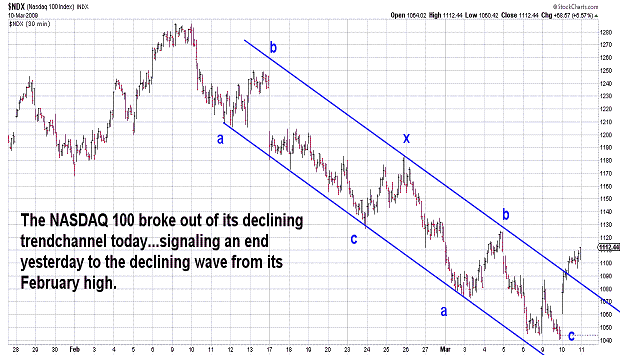
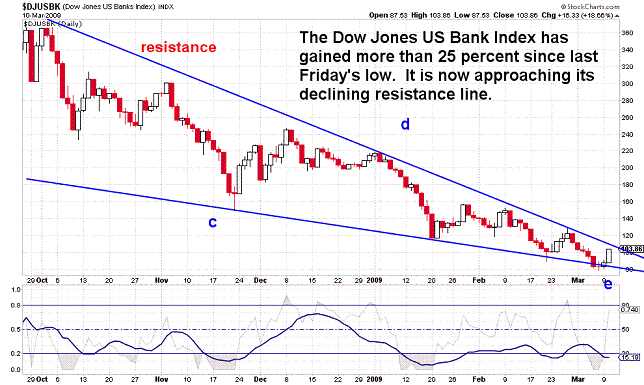
| March 10, 2009 update...With the DJIA's surge of 379 points today, the reversal indicated by the 71 trading day cycle (closing basis) yesterday might have nailed it right on the head. Of course, we will know that only in hindsight...if today's rally continues this week and beyond. The DJIA broke out above its declining trendchannel from the February 6th high this morning, as did the NASDAQ 100 (see chart) and other indices. Now, the DJIA needs to overcome the 7100 and 7400 resistance levels to confirm that it is on its way back toward the top of its trendchannel from the October 2007 high. Today's rally was a good start, but the average has a long way to go. The bank index is now up over 25 percent since I showed the diagonal triangle (or wedge) pattern in its chart on Friday. The Dow Jones US Bank Index was up more than 16 points today...if its rallies another 6-7 points, it will break through trendline resistance. |
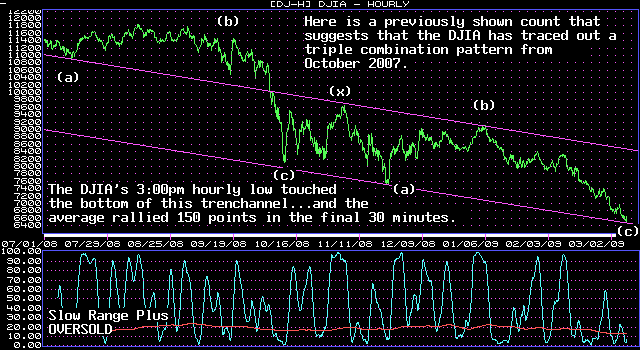
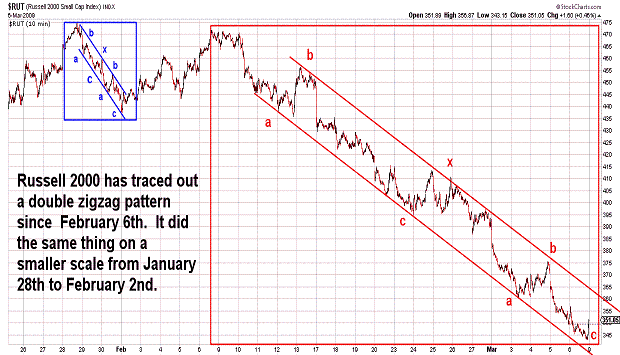
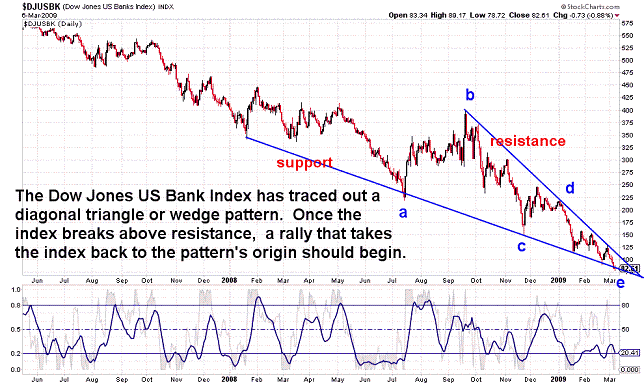
March 6, 2009 update...Will today's last half-hour 150 point rally leave the March 3rd cycle reversal week intact? The price pattern of the past 5 days does not confirm it. And, despite today's positive DJIA close, it was only 14 points above the middle of its daily range. From an Elliott wave standpoint, the pattern of the DJIA and other indices looks a double zigzag (a-b-c-x-a-b-c) from the February 6th high. At today's low, the DJIA was hugging the bottom of its declining trendchannel...before finally spiking higher near the close. Until the DJIA rallies above the top of this trendchannel, the pattern could elongate into a more complex pattern. Hopefully, this does not happen...but, an accleration of the decline, should it occur, would take the DJIA to 6000 or so...the bottom of the larger trendchannel from the October 2007 high.
I pointed out on the message board yesterday, that the decline from the October 2007 high (i.e., PRIMARY wave C) was now 17 months in length. Primary wave A was 38 months...and PRIMARY wave B was 55 months. PRIMARY wave A + PRIMARY wave C = PRIMARY wave B (38+17=55). If you convert that into weeks, equilibrium between the waves will be reached next week. So, if it turns out that this week's cycle fails, there is a case for a low to be made next week. |
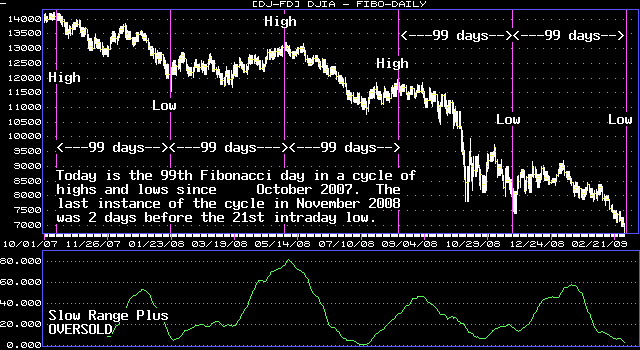
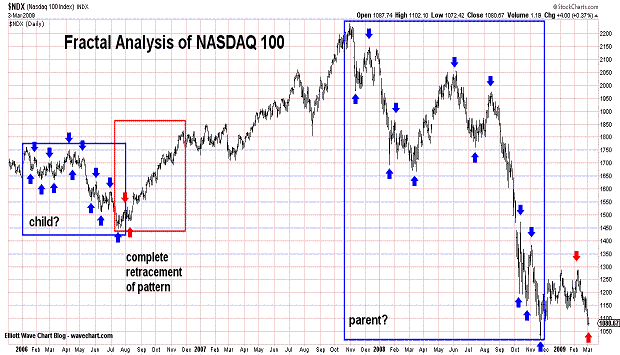
March 3, 2009 update...Well, today was the 99 Fibonacci day cycle turn date that has been discussed here in recent updates. As I pointed out, the last instance of the cycle fell two days before the November 21, 2008 low. Some leeway for the date of the actual low should therefore be allowed. A low was made midday today...with a 150 point rally occuring after that low...but, it did not look impulsive. In fact, it was substantially retraced by the close. Most of the market averages closed down for the 5th straight day...the exception was the NASDAQ 100 today, but it was down sharply after hours. The most likely indication that a low is finally in place will be the day the market closes well above its intraday low.
I posted a chart of the NASDAQ 100 today that shows a fractal pattern since 2006. While I am not an expert in fractal analysis, the pattern from January to July 2006 looks very similar (on a smaller scale) to the pattern in the index from October 2007 to November 2008. If there continues to be similarity from each fractal to its succeeding fractal pattern...AND the NDX now holds above its 2008 low, the fractal suggests a stairstep rally to new highs by next year. We'll see! |
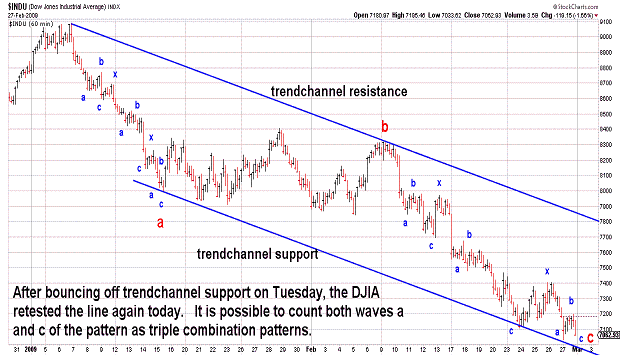
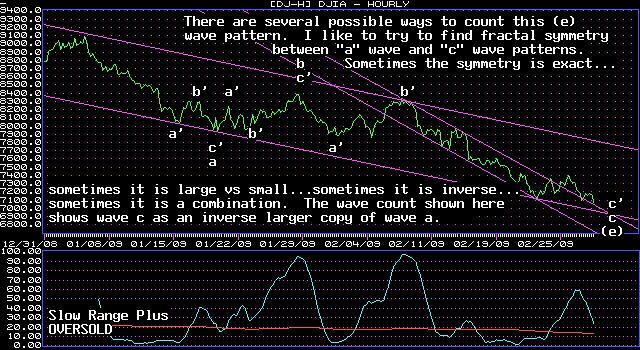
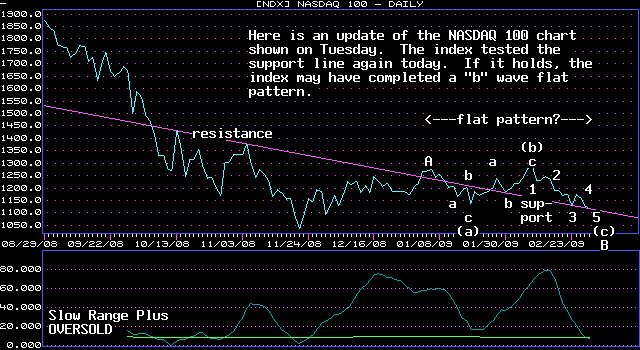
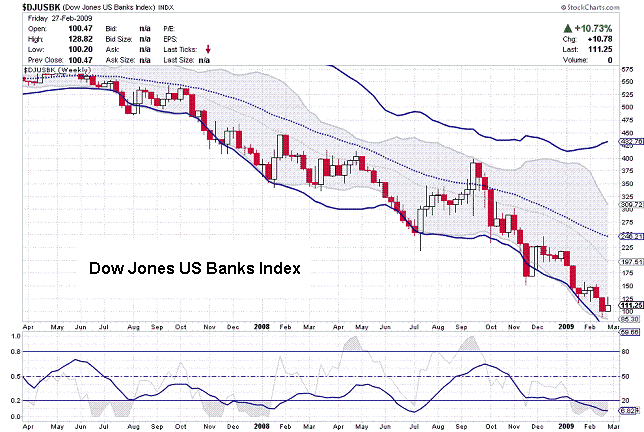
| February 27, 2009 update...The market closed lower 4 out of 5 days this week...failing to follow through on Tuesday's 200 plus point rally. Although today's close was only modestly below Monday's low, the DJIA was down over 4 percent for the week...and did not confirm that a final bottom was in place. On a positive note, the bank index ended the week over 10 percent higher...and did this despite a significant 9 percent decline today. Is this a hint that next week's Fibonacci cycle date will turn the broader indices higher? We'll see! I expect next week's action to be interesting, and volatile as well. As I said on Tuesday, once the a-b-c pattern from the January 6th high is complete, "...the DJIA should initially rally toward 8300...retracing wave c of (e). Following that, the rest of wave (e) should be retraced. That would take the DJIA to the top of its declining trendchannel from the October 2007 high." |
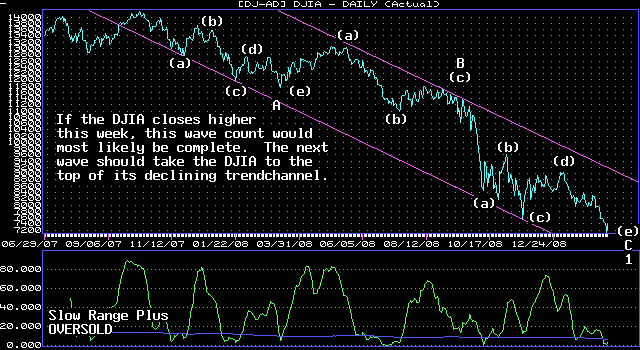
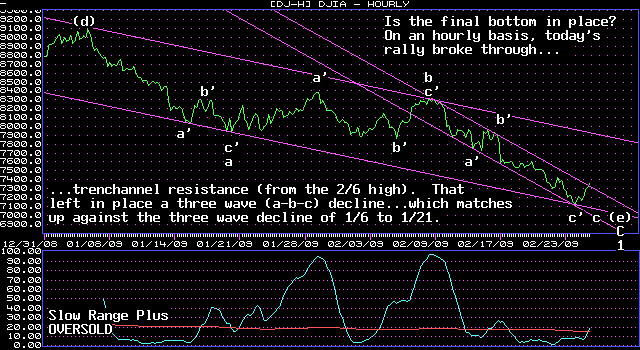
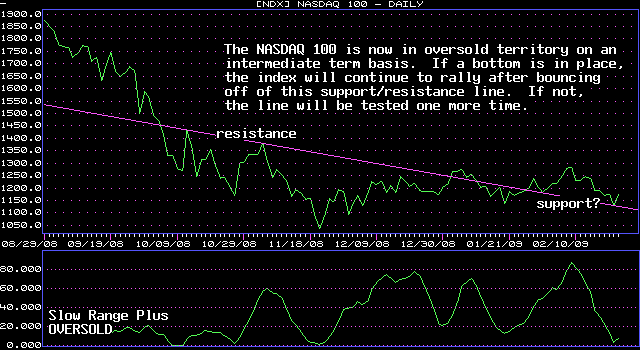
February 24, 2009 update...Did the market make a final bottom one week before the March 3rd cycle turn date? In Friday's update, I said that "given the market's oversold condition and various technical indicators pointing to a low, I am not sure the market can postpone putting a low in place for six more days." After today's strong rally, my sense is that a bottom IS in place...but that will be confirmed ONLY IF the market continues to rally over the next three days and ends the week above last Friday's close at 7365. IF a bottom is in place, the DJIA should initially rally toward 8300...retracing wave c of (e). Following that, the rest of wave (e) should be retraced. That would take the DJIA to the top of its declining trendchannel from the October 2007 high. The retracement of "e" waves is typically quick. If I have correctly labeled wave (e) in this case, we'll see if that happens here.
By the way, at yesterday's low (7105.94), there is a close Fibonacci relationship between PRIMARY wave A and PRIMARY wave C (a perfect relationship would be at 7176). PRIMARY wave A declined 4340 points from the January 2000 high to the March 2003 orthodox low. PRIMARY wave C declined 7092 points from the October 2007 high to yesterday's low. 4340 divided by 7092 equals 61.2 percent. Also, from its high to the October 2002 low, PRIMARY wave A declined by 38 percent. At yesterday's low, PRIMARY wave C declined by 50 percent. |
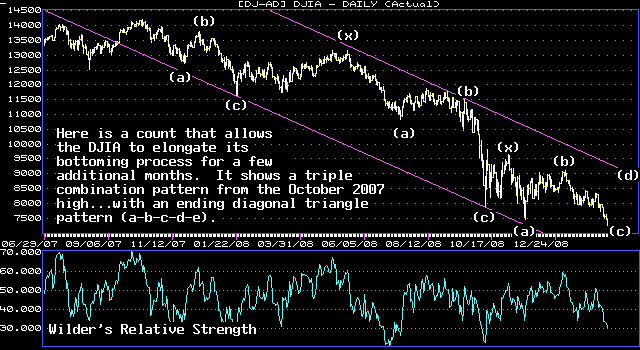
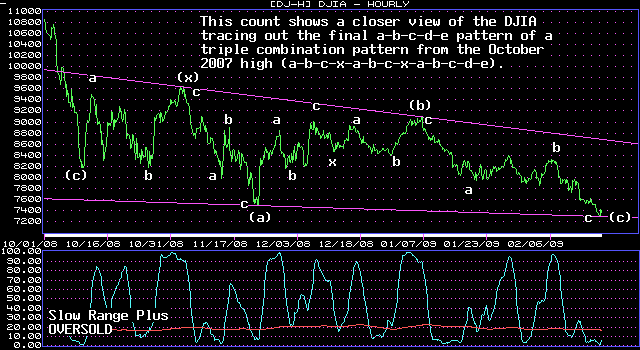
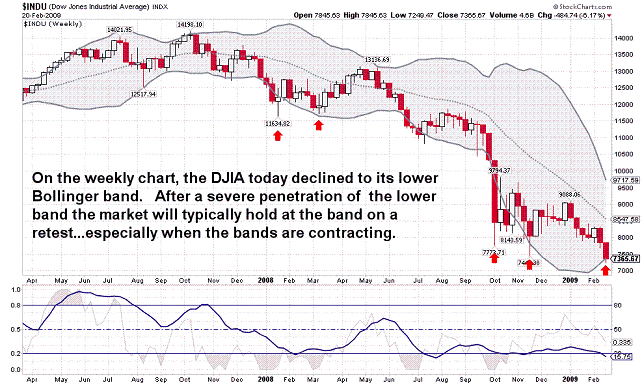
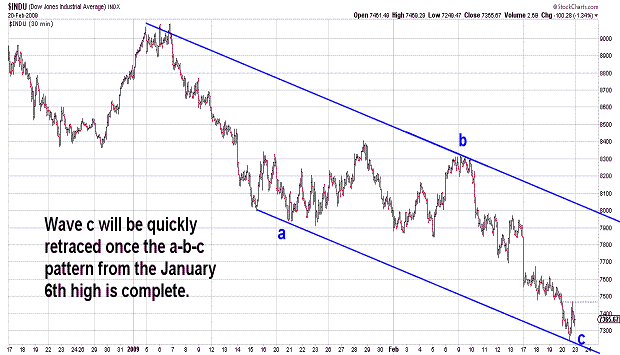
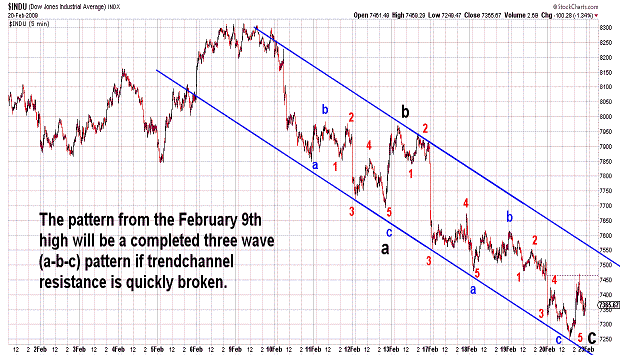
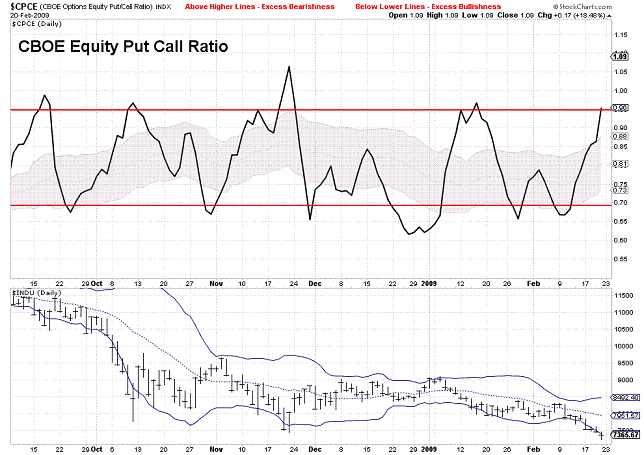
| February 20, 2009 update...Today's decline below the November 21, 2008 low did not affect the long term wave count(s) that I have showed here over the past many months. They are still valid...as is a slight variation of the long term count shown in the first and second charts above. Today's decline did, however, eliminate 2008 as an important year in terms of Fibonacci intervals between yearly highs and lows. 2008 now joins 1995 as a failed "Fibonacci year cycle" (no occurence of a yearly high or low that would be suggested by the existence of a Fibonacci interval from a previous yearly high or low). The next instance of a Fibonacci day cycle is March 3rd...six trading days from now. It is part of the 99 Fibonacci day cycle that began at the October 2007 high. The previous instance of the cycle was 2 days before the November 21, 2008 low...so it is best to give the cycle a day or two leeway. Given the market's oversold condition and various technical indicators pointing to a low, I am not sure the market can postpone putting a low in place for six more days...unless the DJIA remains weak and fails to rally above short term trendchannel resistance (see charts above). It had been my thinking that once the next low was in place, the wave pattern from the October 2007 high would be complete. The DJIA wave count in the first and second charts above shows that such may not necessarily be the case. There is at least one other possibility! |
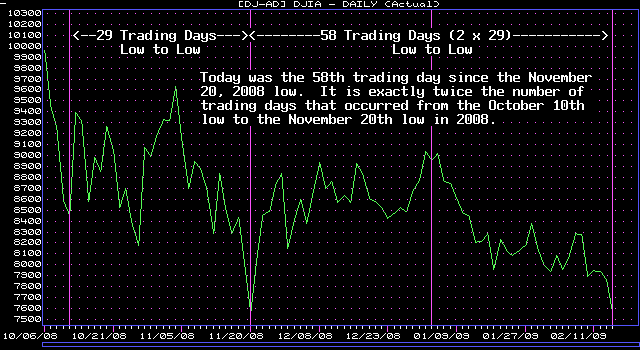
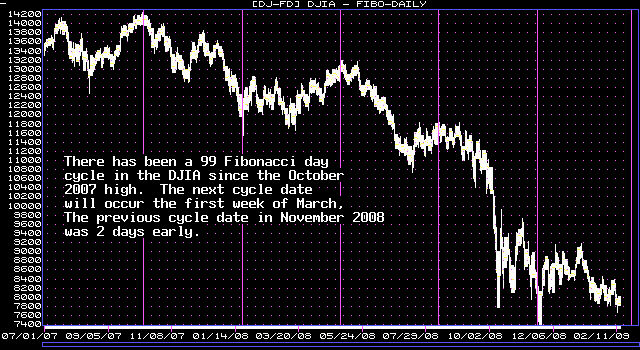
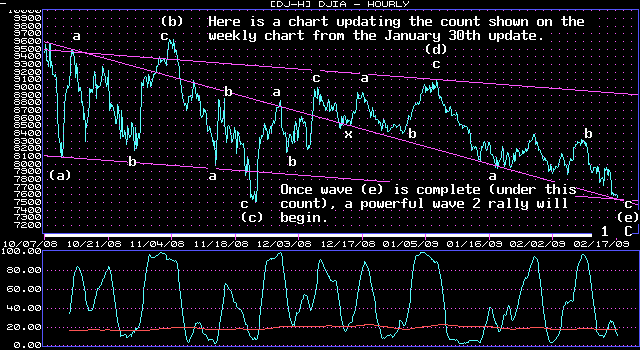
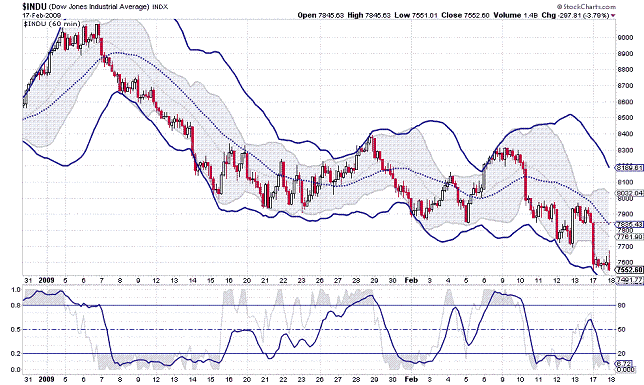
| February 17, 2009 update...For whatever reason, it seems whenever you discover a cyclic pattern in the market, the next instance of the pattern either fails completely or is a day or two early or late. The 41 Fibonacci day cycle failed today when the DJIA closed lower. (Interestingly, the cycle did not fail in terms of trading days...see chart above.) The DJIA retested its November 20, 2008 closing low today...closing a fraction of a point above the November low...which may or may not turn out to be significant. The important level in my mind is the theoretical low of 7392 which was made on November 21st. As pointed out in a previous update, if the Fibonacci intervals between important yearly highs and lows is to continue, that 2008 low should not be exceeded. Nevertheless, the current wave count does allow for a lower low. There is one other cyclic pattern that I am following...and that is the one that I previously pointed out in various updates over the past year. See chart above of 99 Fibonacci day cycle. The next turn date for that cycle is the first week of March. |
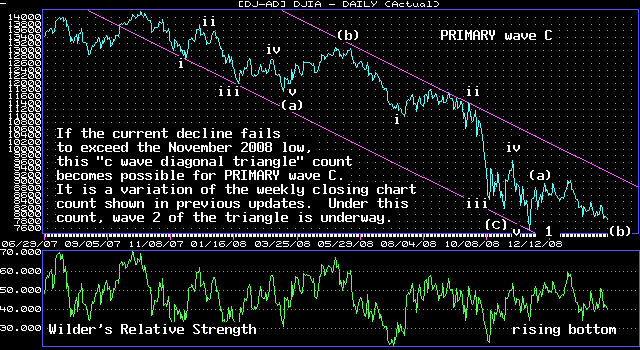
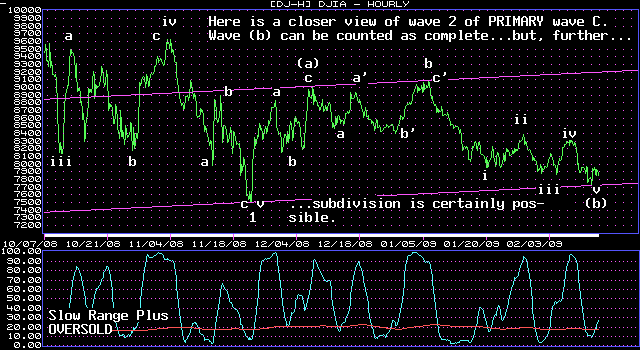
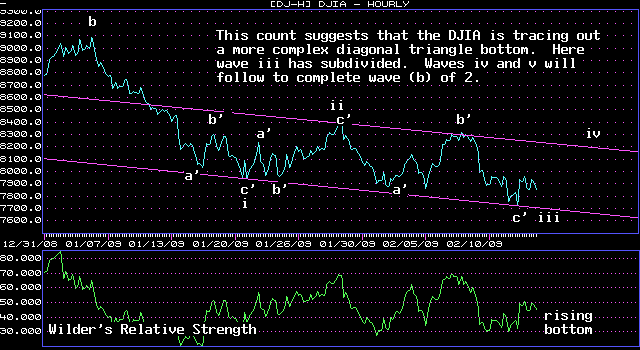
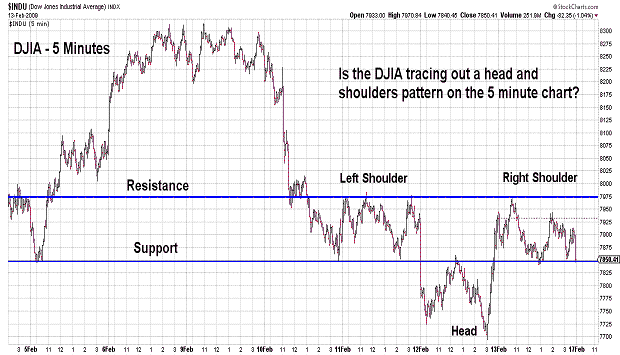
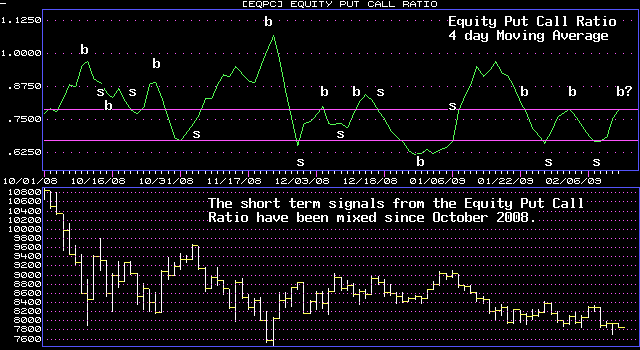
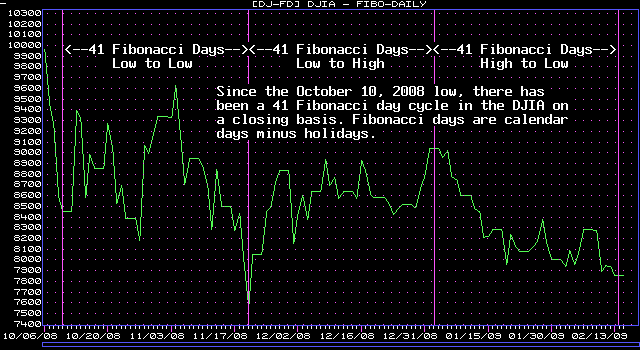
February 13, 2009 update...Today was the first of two consecutive months with a Friday, the 13th. This one proved to be "unlucky" for the DJIA as it lost 82 points. For the week, the DJIA lost 430 points. On a short term, intermediate term AND long term basis, the DJIA is oversold. But, as I suggested on Tuesday, market sentiment (in terms of the put/call ratios) has yet to indicate that an important low is in place. There are exceptions, of course...and, as evidenced by the equity put call ratio chart above, buy and sell signals during the past six months have been somewhat erratic.
A cursory glance at the DJIA's pattern since the January 6th high suggests, at least to me, that a diagonal triangle can be discerned and counted as such under Elliott wave rules. Note, however, that the pattern can elongagte and subdivide...or it can even morph into something entirely different. So, I think next week's action is critical. In past updates, I have suggested that the current decline is the final decline of the wave pattern since the October 2007 high. The count I show in today's update is a variation of that count...but, it considers the November 2008 low as the end of the pattern. Since then. the count suggests that the 2nd wave of a diagonal triangle "c" wave has unfolded...with the "b" wave of that pattern now concluding. This pattern is negated if the November 2008 low is exceeded.
February 14th Addendum: There has been a 41 Fibonacci day cycle in the DJIA since October 10, 2008. If it is still functioning, February 14th is the next turn date. |
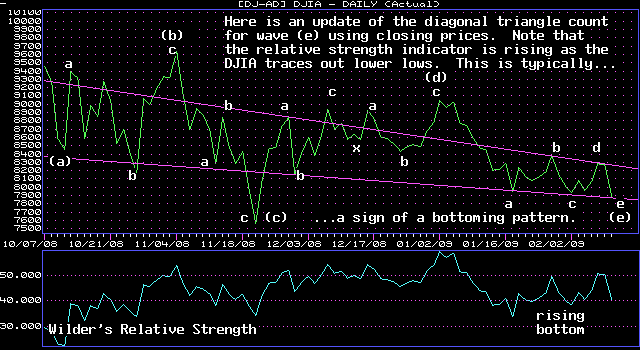
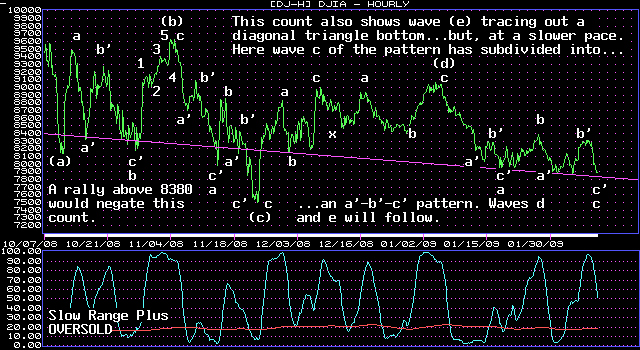

| February 10, 2009 update...The DJIA is now testing the validity of the "e" wave diagonal triangle wave count that has been discussed here for the past few weeks. One question with respect to this count remains: is it nearing completion or is it just partially complete? The DJIA charts above show both perspectives. Another selloff like the one today would negate both counts. The key level on the upside is 8405. A rally that exceeds 8405 would confirm that that the diagonal triangle pattern is complete. A 3-wave rally that falls short of that level...that again turns lower would suggest that the diagonal triangle is still unfolding and subdividing. Given market setiment (in terms of the put/call ratios) it would be unusual to start a strong rally from here. The put/call ratios are still in sell mode...and need time to move back into buy territory. The DJIA is, however, oversold on an intermediate and long term basis and currently sitting at its lowest level since it closed at 7552 on November 20, 2008. A few of the other indices, like the NASDAQ 100, are not currently oversold and are holding further above their lows of 2008. Today is the 34th Fibonacci day since the January 6th high...so we'll see if we get, at the very least, a short term reversal tomorrow. |
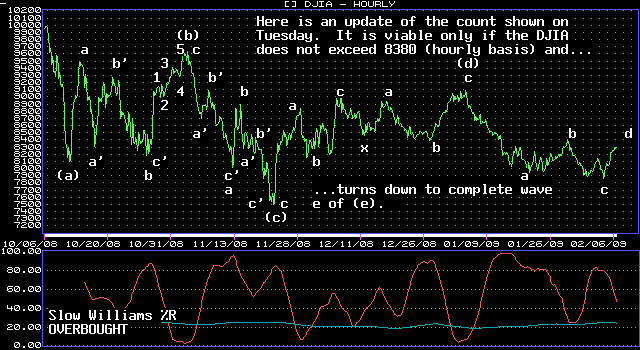
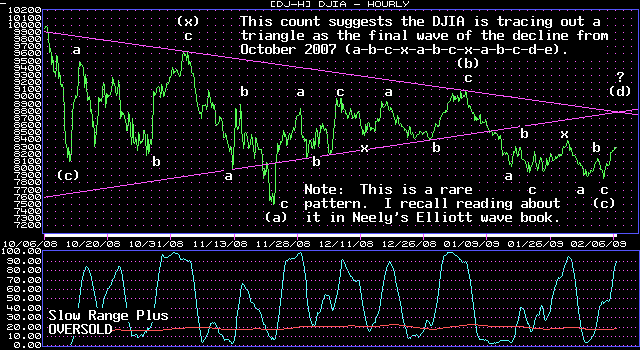
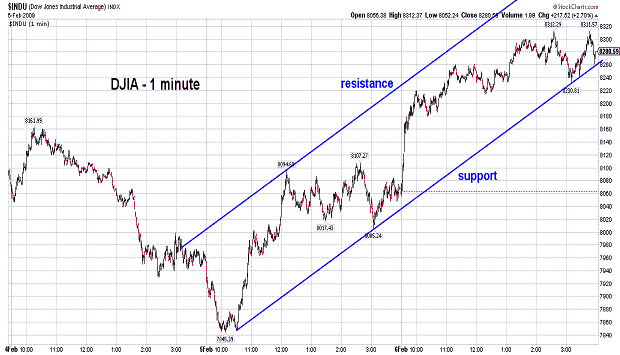
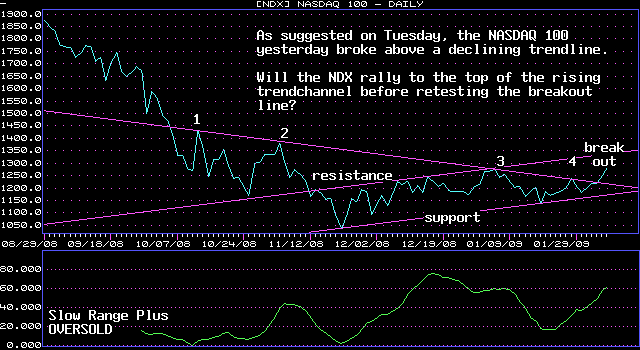
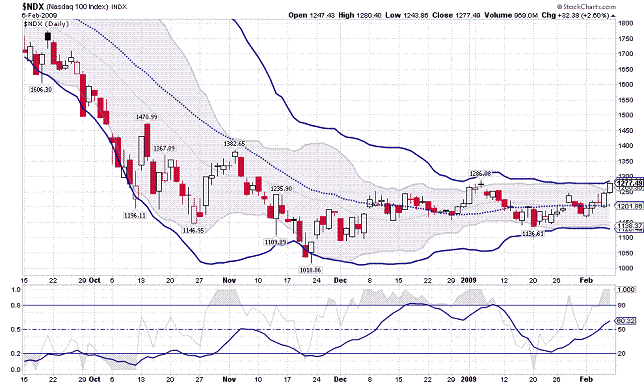
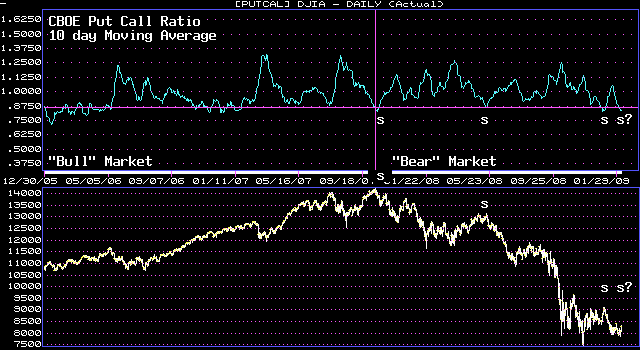
February 6, 2009 update...The market ended the week with 2 days of strong gains. In terms of the Elliott wave pattern, the key level to watch next week is DJIA 8405. If the DJIA fails to exceed that level and turns lower, the "e" wave diagonal triangle scenario discussed in the past few updates will remain viable. If that level is exceeded, an interesting alternate count will gain prominence with the DJIA continuing to rally towards 8700-8800. Charts of both wave counts are shown above. Which is more likely? We will probably know by Monday. I noted in the last update a cycle turn date that occurs during the first week of March (See November 19, 2008 update regarding 99 day and 71 day cycles)...the alternate count would seem to be a better fit given that time parameter. Market sentiment (see put call ratio chart), however, is problematic here. The 500 point (or so) rally needed by that count will have to be quick if it is indeed going to occur. We'll see!
The NASDAQ 100 did, in fact, breakout yesterday. The question now is how high will it go before it pulls back to test the breakout line. See NDX charts above for an indication. Bollinger band resistance lies just above today's close...trendchannel resistance lies about 50 points (or so) higher. |
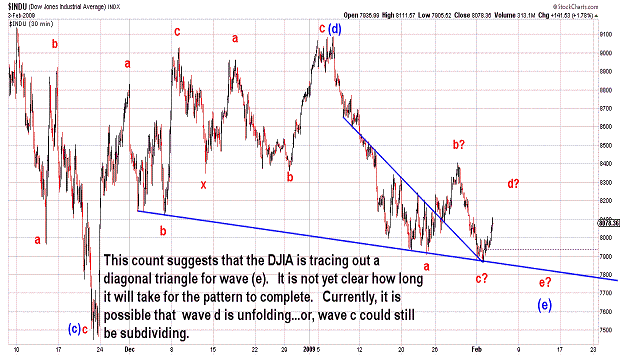
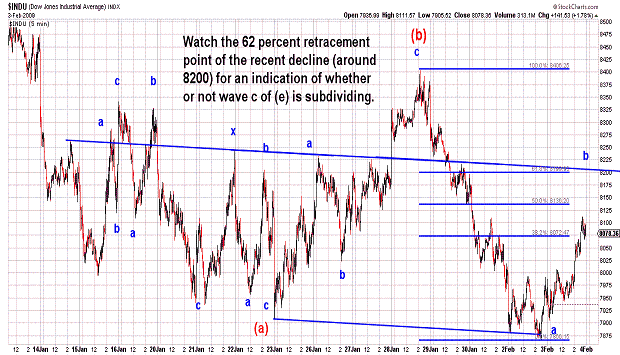
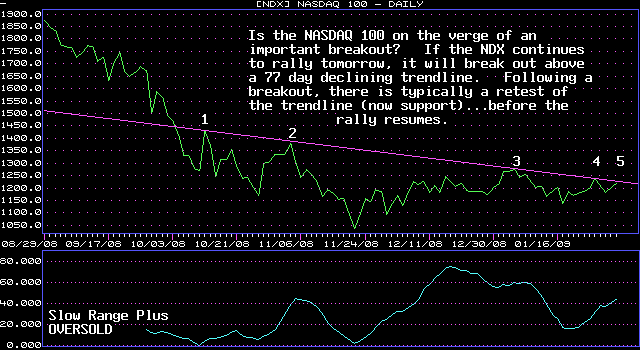
February 3, 2009 update...One of the patterns I mentioned in Friday's update has moved to the top of my list of possible wave counts for the current "e" wave. Given yesterday's decline in the DJIA below the January 23rd low, it now seems to me that a "diagonal triangle" is the most likely pattern forming for wave (e). Notwithstanding the fact that it may indeed be a diagonal triangle, it is not yet clear how long it will take to complete it. There is an important cycle turn date occuring the first week of March, but it seems unlikely that it would take that long. Recall that each wave of a diagonal triangle is a three wave corrective pattern...and can subdivide and elongate as the larger pattern unfolds. At this stage, either wave "c" or wave "d" is most likely unfolding. It will take another day or so to determine which it is. The 8200 level of the DJIA may provide a clue. If the average turns sharply lower from there it is likely that wave "c" is still unfolding. If that level is exceeded, it becomes more likely that wave "d" is underway. If the January 28th high is exceeded (8405), something else is probably going on. We'll see!
The NASDAQ 100 index has reached an important jucture. It may be on the verge of an important breakout. Take a look at the chart above. |
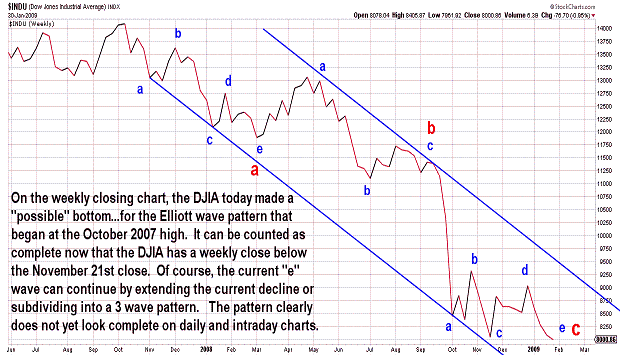
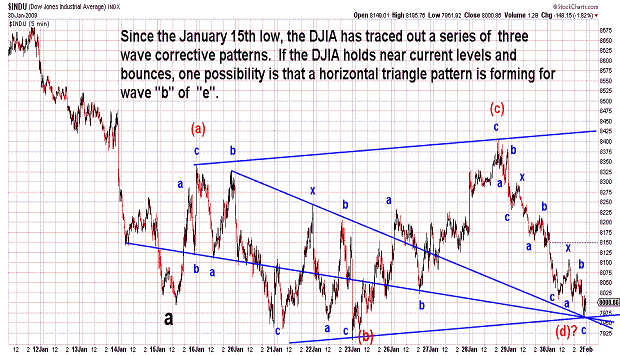
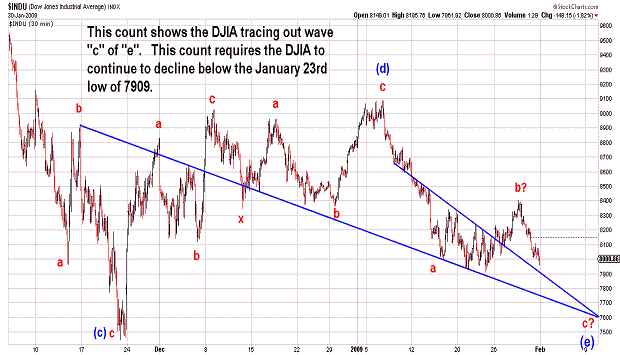
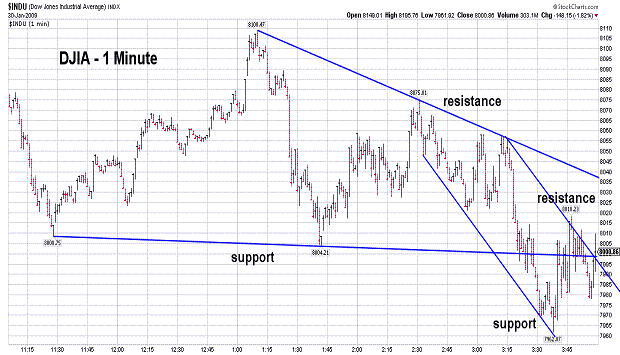
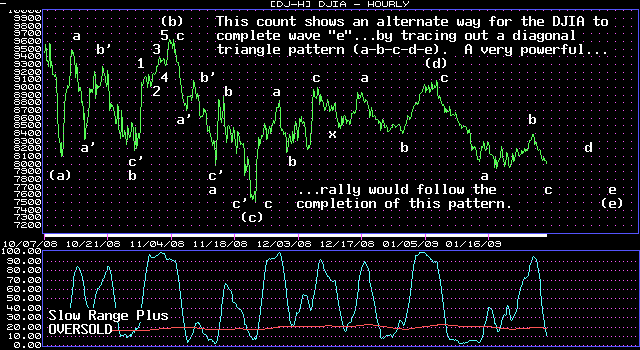
January 30, 2009 update...It was an interesting week...the DJIA closed down only 76 points from last Friday's close. However, in between, the DJIA rallied almost 300 points and then declined 375 points. On the daily and longer term charts, the market is oversold. Nonetheless, that does not mean that a bottom is in place. As I indicated in the weekly chart above, the DJIA has minimally completed an Elliott wave pattern (weekly closing basis only) from the October 2007 high. But, further subdivisions of the decline from the January 6th high are still required to complete the pattern on a daily and intraday basis. In terms of time, this could easily take up to another week or more. It all depends on the form of the pattern currently unfolding. Various wave counts are viable here. The DJIA could still be tracing out a "b" wave...or, it could be tracing out the final "c" wave of a zigzag pattern (a-b-c)...or, it could even be tracing out the "c" wave of a diagonal triangle pattern (a-b-c-d-e). It's best to trade lightly until all (or most) of the indicators line up together. Right now, the signals are mixed.
I pointed out in the January 16th update that the bank index may be nearing a bottom. Despite the loss in the DJIA this week, the bank index ended the week up almost 5 percent. If this index can maintain positive relative strength against the DJIA and other indices in the coming days, I think it will help confirm that an important bottom is forming in the stock market. |
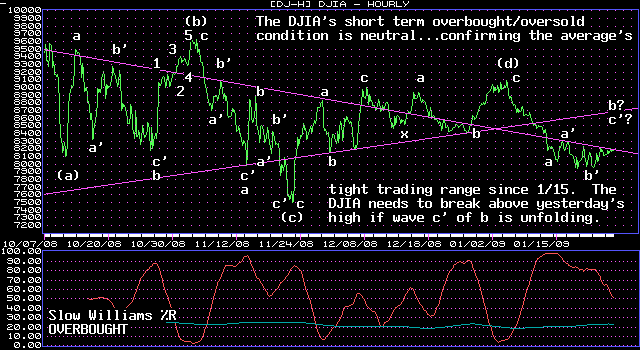
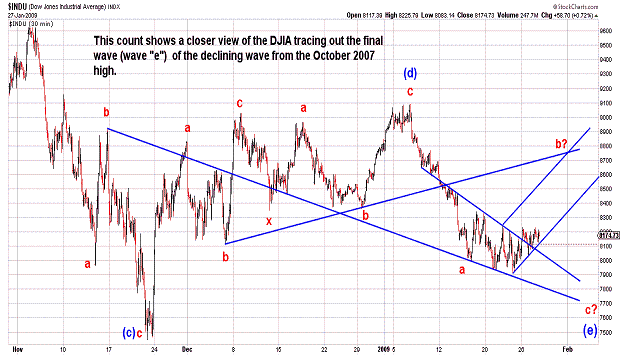
| January 27, 2009 update...There is not much to add to Friday's update. The market is marginally higher since then...but, unless the DJIA breaks above yesterday's high with a fair amount of strength, the short term wave count will turn murky. A continuation of the current rally would suggest that wave c' of b of (e) is unfolding...and lead, according to my preferred wave count, to the final decline of the pattern from the October 2007 high. I am assuming that the DJIA should reach a short term overbought condition before the final decline occurs...but, the market may decide otherwise. A multi-month rally should follow the completion of wave (e). |
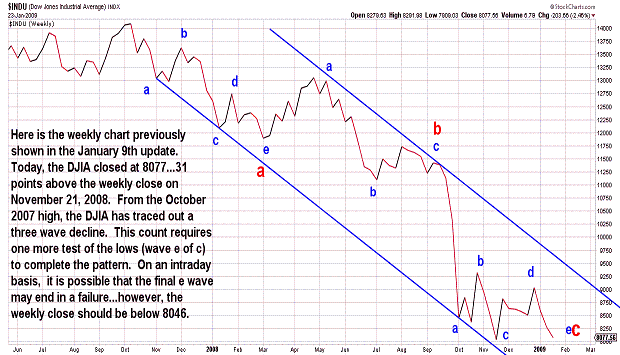
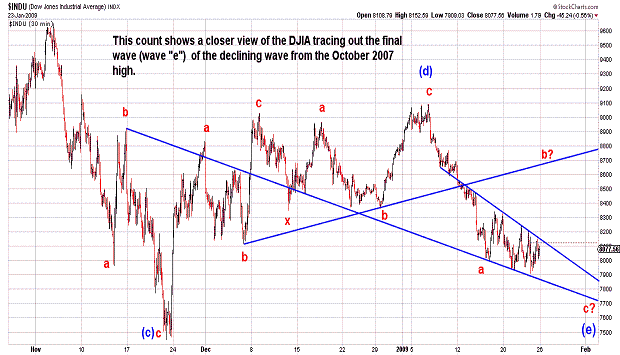
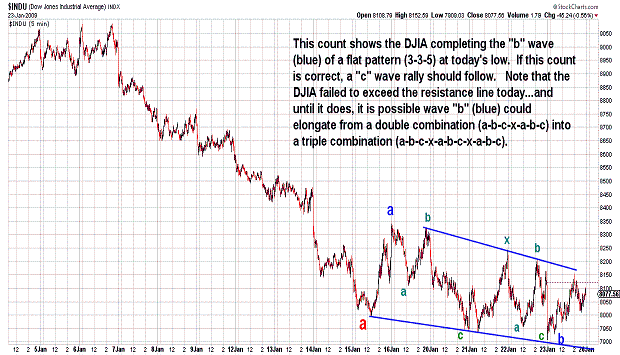
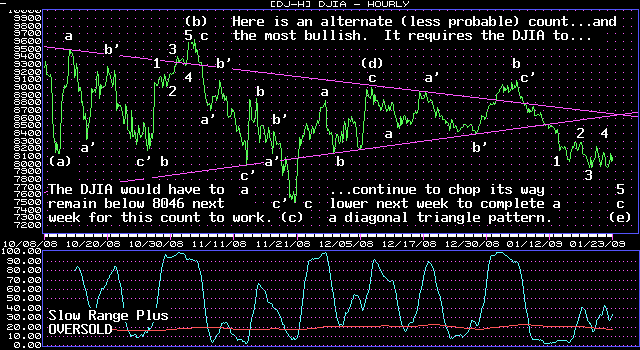
| January 23, 2009 update...The DJIA closed the week 31 points above the November 21, 2008 weekly closing low...suggesting to me that the end of the pattern from the October 2007 high is not yet in place. There are a number of different ways and wave counts that will get us to that point in the next week or two...and I have shown a few of them in the charts above. The most likely course, in my opinion, is a short term rally next week...and then a final decline into early February. We'll see! Once the bottom is in place, a multi-month rally should begin. While its wave designation is not yet clear, it should break above the trendchannel resistance line shown in the weekly chart above. The 38 percent retracement point of the decline from the 2007 high is a likly minimun objective...DJIA 10027. |
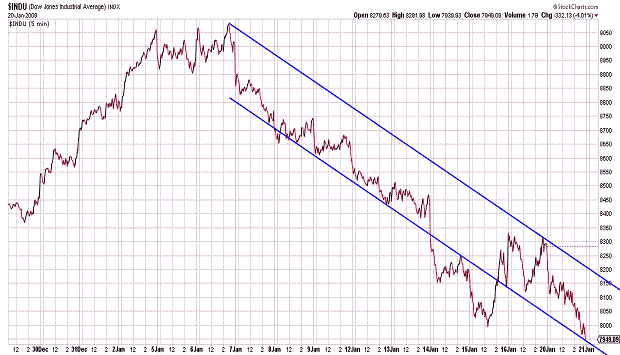
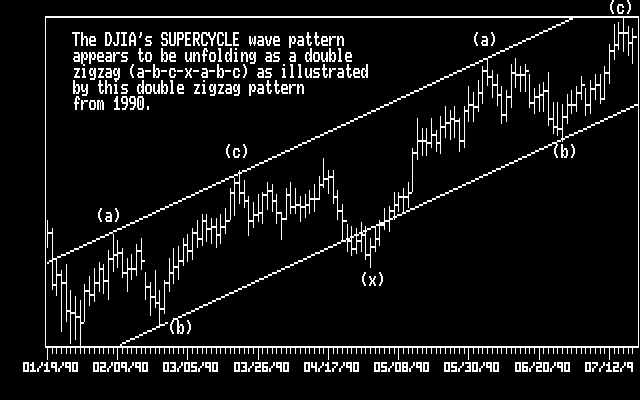

January 20, 2009 update...In Friday's update, I suggested that the DJIA was tracing out a "b" wave countertrend rally after completing an "a" wave decline to 7995 last Thursday. If that is the case, wave "b" is unfolding as a "flat" (3-3-5) with the current three wave decline from Friday's high (wave a of "b") making a lower low today (wave b of "b"). A c of "b" wave rally would follow if this is indeed the pattern. The targets mentioned in Friday's update would remain the same. If, instead, the DJIA continues lower, wave "b" will have been short and shallow...and wave c of the decline from the January 6th high will be underway. On a closing basis, the DJIA now shows a 5-wave decline. Since the decline from the 6th must be 3 waves, at least one more up sequence would be expected before the entire declining pattern from DJIA 9088 is complete.
To illustrate what I believe is occuring on a longer term basis, i.e., the DJIA's SUPERCYCLE pattern, I posted charts of the DJIA's SUPERCYCLE pattern from 1932 and the DJIA's pattern from January to July of 1990. Both patterns appear to be double zigzags (a-b-c-x-a-b-c). For more details that include Fibonacci price and time objectives, view the SUPERCYCLE wave chart above (or the October 17th update). |
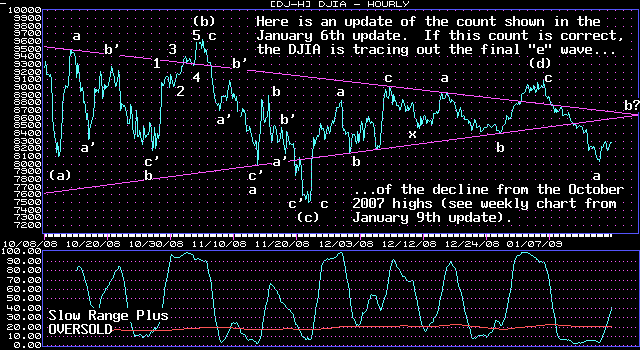
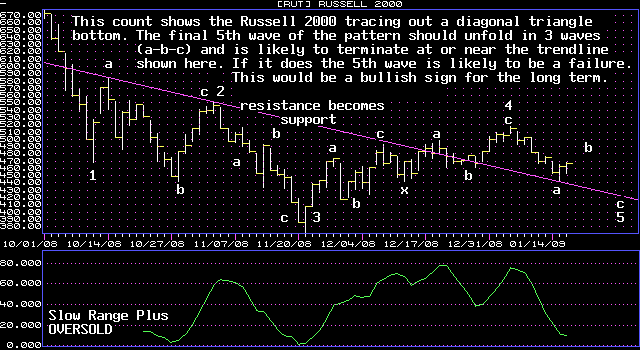
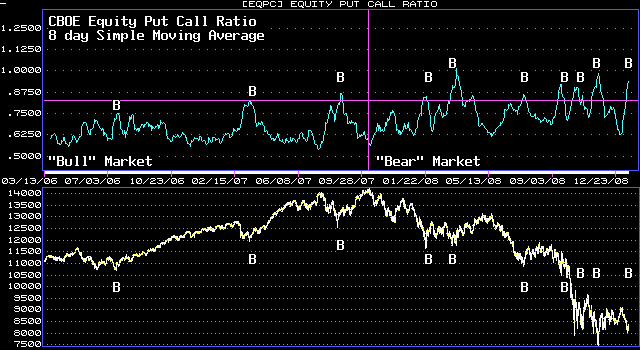
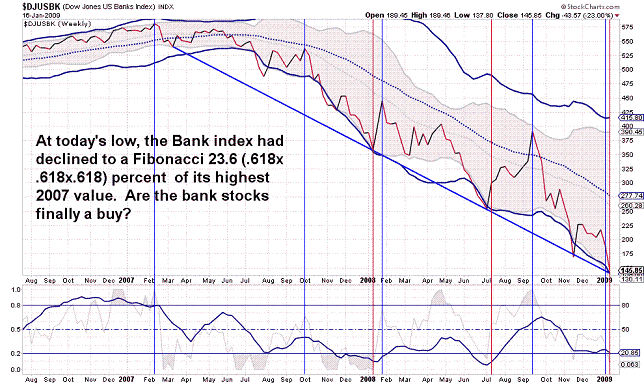
January 16, 2009 update...The DJIA made its closing low this week on Wednesday at 8200...the intraday low occurred yesterday at 7995. Today's close was 286 points above that intraday low...but, the DJIA still lost 319 points for the week. As shown in the chart above, my top wave suggests that the DJIA is tracing out the final declining pattern of the wave, i.e., PRIMARY wave C, that began at the October 2007 high (see last Friday's weekly chart for the wave labels I am using). Whether that wave is all or just a subwave of PRIMARY wave C is yet to be determined...but, if the current decline holds above the November 21st low, I believe that that intraday low (7449) will stand as the low point for the current PRIMARY wave. Shorter term, assuming yesterday's intraday low holds, the DJIA should continue to trace out a "b" wave countertrend rally that began at the 7995 low. There is a convergence of trendlines (on the hourly chart) around 8600 that is likely to act as resistance for the wave "b" rally...this level is right in the middle of the 50 percent (8540) and 62 percent (8670) retracement points of the recent decline from 9088. These retracement levels could also come into play if the rally undershoots or overshoots the trendlines. Once wave "b" is complete, a final "c" wave decline should follow to complete wave "e".
Take a look at the bank index chart above. The banks have been in the news this week...as leaders of the market's decline. From a charting standpoint, the banks are at an interesting juncture. A number of technical, Fibonacci, Elliott wave, and cyclic factors suggest an important turning point may be at hand. Of course, the poor fundamentals of the sector may, in the end, be more significant in determining their direction. We'll see! |
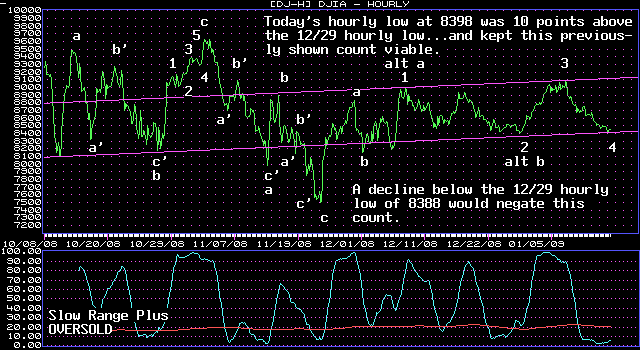
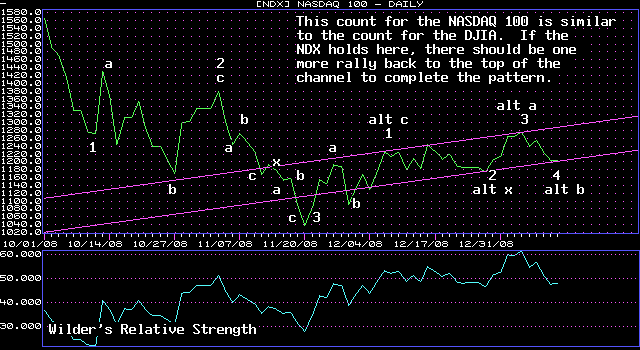
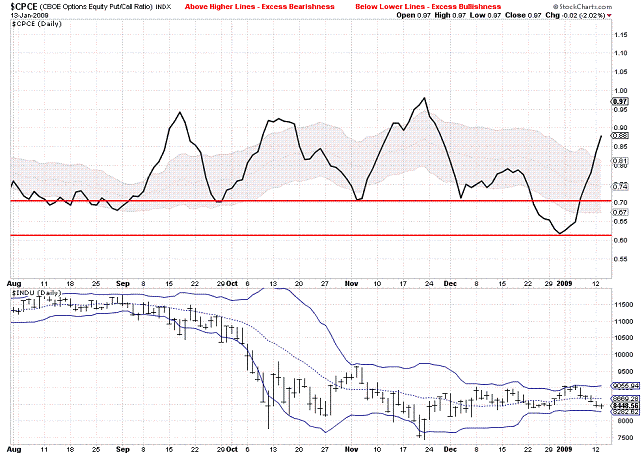
| January 13, 2009 update...The DJIA held above December 29th's 8364 intraday low today...and closed above December 23th's 8419 closing low...keeping the count shown in Friday's update viable. That count now requires the market to rally back toward the top of its recent range. There are several factors that do support a rally right here: (1) the DJIA is oversold on a short term basis and (2) the equity put/call ratio (market sentiment) is climbing back to a level that is excessively bearish. If the DJIA breaks support at 8364, however, the wave count shown in the above chart would be negated. In that case, the rising pattern from the November 21st low would be complete...and a declining pattern that tests that low one last time would be underway. |
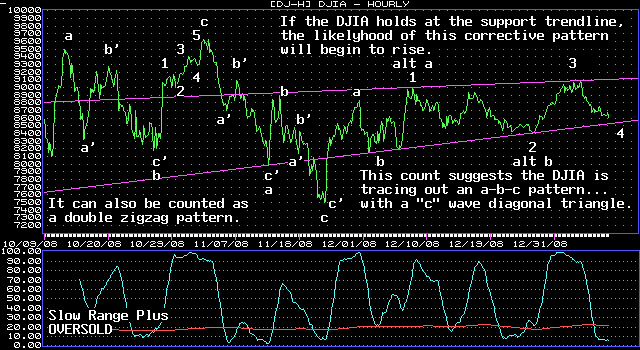
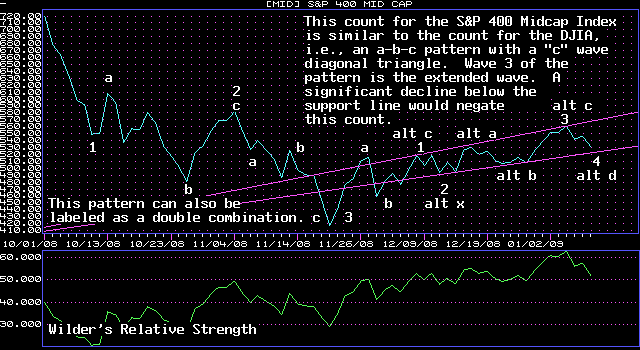
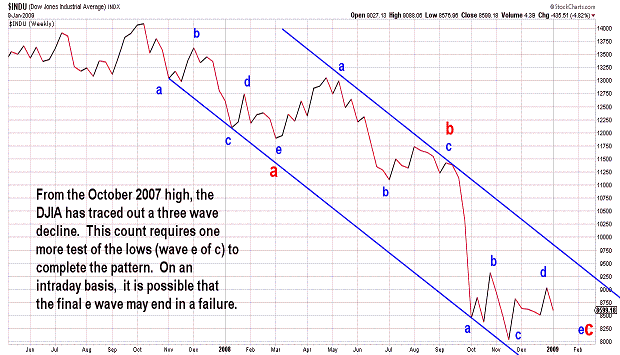
| January 9, 2009 update...The market's excessively bullish sentiment, along with it's overbought condition, finally led to a decline of 415 points over the past three days. The DJIA lost 435 points for the week...and, on a weekly basis, may have completed the corrective pattern from the November 21st low. On a daily basis, however, the pattern would count best, in my opinion, with one more rally back above last week's highs. The DJIA must hold above 8364 (preferably at or above trendline support around 8500) for this to happen. Such a rally would set up additional technical divergences between the indices and indicators...and lead to a more powerful and unsettling decline. As I show on the chart of weekly closing prices, such a decline would establish and complete a symmetrical three wave pattern from the October 2007 highs. At this point, I believe that the intraday low of November 21st is likely to hold (see the October 10, 2008 discussion of yearly Fibonacci intervals), but we are likely to see a lower weekly close in the process. |
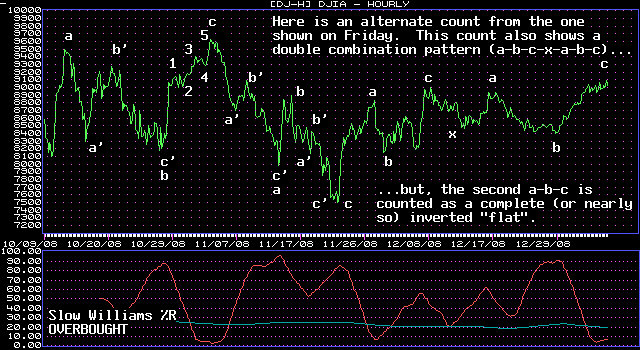
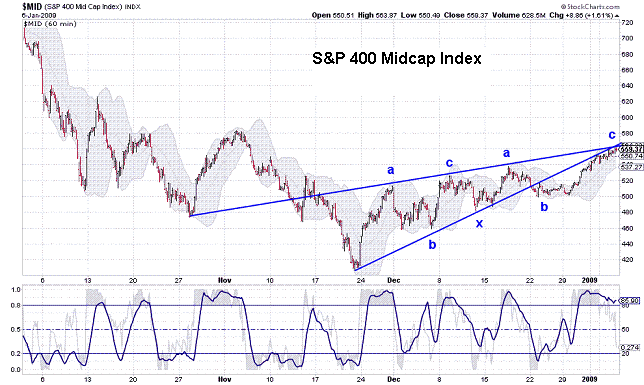
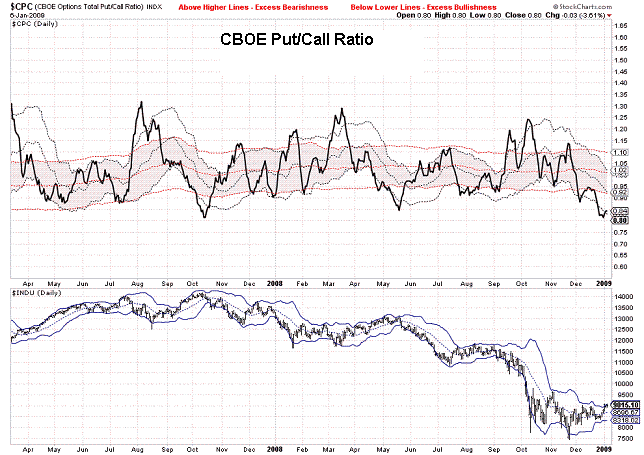
| January 6, 2009 update...Friday's closing high remains intact (so far) at 9034 despite today's higher intraday high of 9088. This type of divergence is very common as market tops (or bottoms) are formed. As pointed out in Friday's update, the DJIA and other indices are tracing out rising corrective patterns, which are either complete (or nearly so)...or can continue and expand into more complex patterns. Market sentiment and a variety of techncial indicators point to an important top in the making...but, the market has the option to delay a selloff and a final retest of the lows if it so chooses. For example, the chart above shows the DJIA tracing out a complete (or nearly complete) double combination pattern. There are several other ways to count the waves within the corrective pattern which allow it to continue, including an expansion of the pattern into a triple combination (a-b-c-x-a-b-c-x-a-b-c), Over the past 18 months, the market has always started significant declines when the indicators were at current levels. The market's ability to hold up this long suggests the market may be in the process of transitioning (in terms of technical buy and sell signals) to a longer term bull market (CYCLE wave C). |
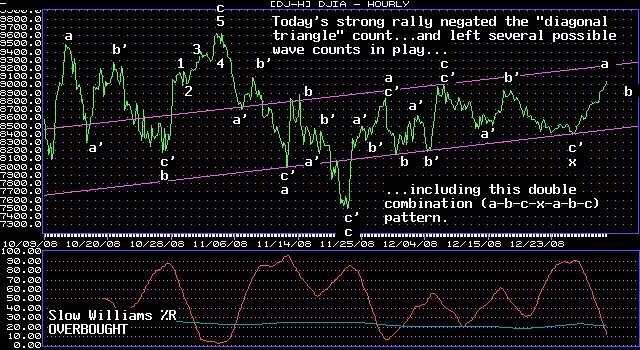
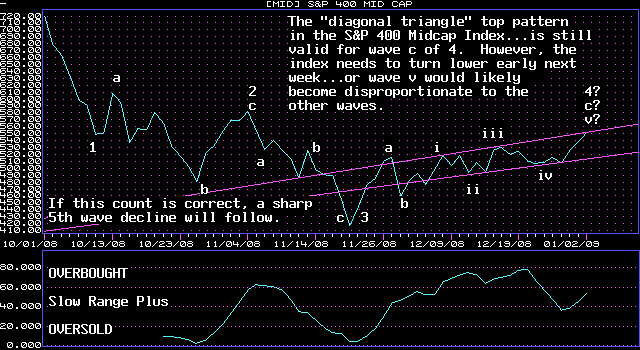
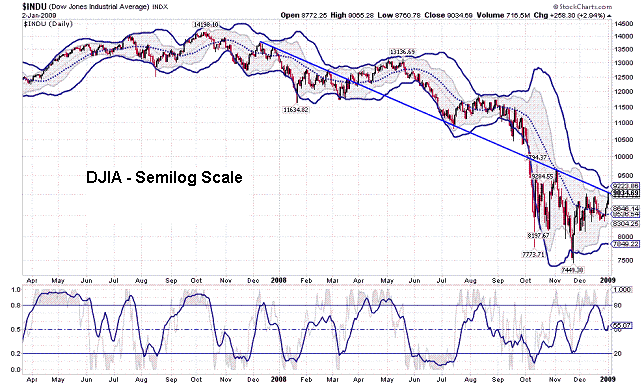
| January 2, 2009 update...Today's rally exceeded the December 8th high and negated the "c" wave diagonal triangle count previously discussed. The DJIA has now morphed into a different Elliott wave corrective pattern...with a variety of possible corrective patterns to choose from at this point. The other count that I showed for the S&P 400 Midcap Index is still valid (but only barely). It requires a sharp reversal early next week to remain so. Technically, the broad market indices have reached an area that suggests a top is near short term, i.e, a number of technical (overbought/oversold) indicators are diverging...indices are near there upper bollinger bands on the daily charts...trendline resistance can be seen on the DJIA semilog scale chart...put/call ratios are excessively bullish. We are in a seasonally bullish period, but last year was an exception to the rule...and this year could be one as well. While the risk of being long right here is hazardous, the market's ability to rally this week in the face of a growing number of negative indicators is, in my opinion, a bullish sign for the intermediate and longer term. |
Important: Information and chart access provided herein is limited to current subscribers only and shall not be forwarded or retransmitted without written authorization. It is educational in nature and shall not, directly or indirectly, be construed as investment advice. No guarantees are made with respect to the accuracy of the information, opinions, predictions,etc. offered here in. The username/password provided to a subscriber is unique and it is the sole responsibility of the subscriber to protect the confidentiality of said username/password and to further protect it from any unauthorized use.
Copyright © 1997 - 2009. The Elliott Wave Chart Blog. All rights reserved. Email
|


