Charts
Index Funds
Direxion - ProFunds - Rydex
Sector Funds
Direxion (Benchmarks/ETFs)
ProFunds (Benchmarks)
Rydex (Benchmarks/ETFs)
ETFs
Foreign
Currencies
IMPORTANT: Chart buy/sell signals are helpful in determining market support and resistance levels...and probable turning points. However, they are only useful if the analyst has a handle on the larger trend. Experience and judgment play a vital role in that determination ...as does Elliott wave analysis.
If a chart does not not appear when you click on the link, you may need to (1) enable javascript, and/or (2) disable pop up blocking for this site, or (3) right click on your mouse and open the link in a new tab or window.
If you have a suggestion for an ETF or sector index that you would like us to consider for addition to the list of charts of above, please send an email to info@wavechart.com.
Please contact us at info@wavechart.com if you encounter a problem with the site. |
|
Elliott Wave Chart Blog 2010 Archive
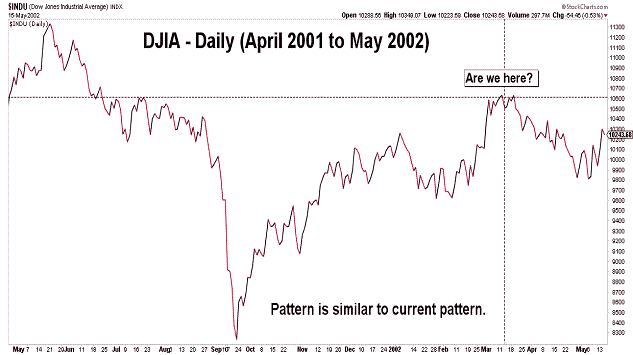
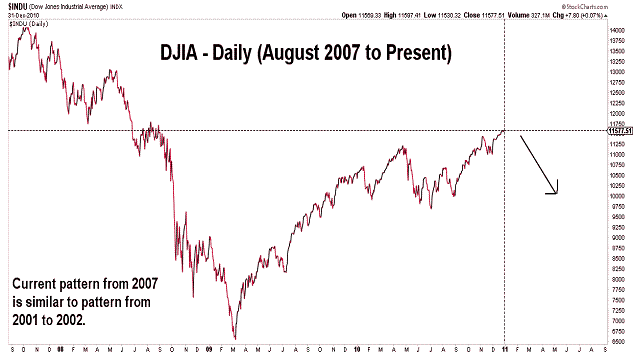
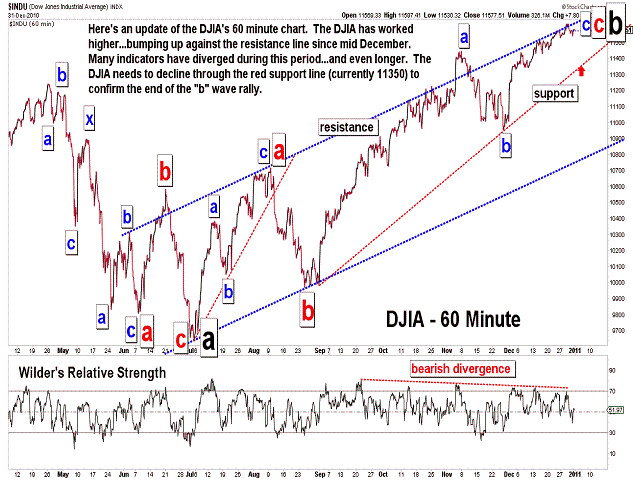
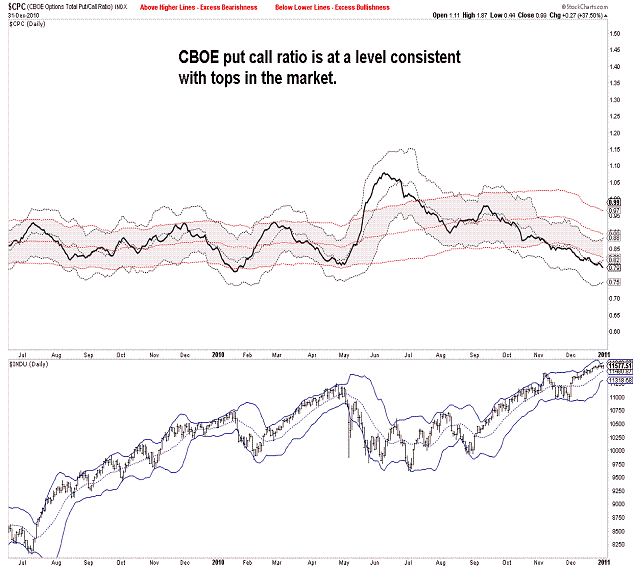
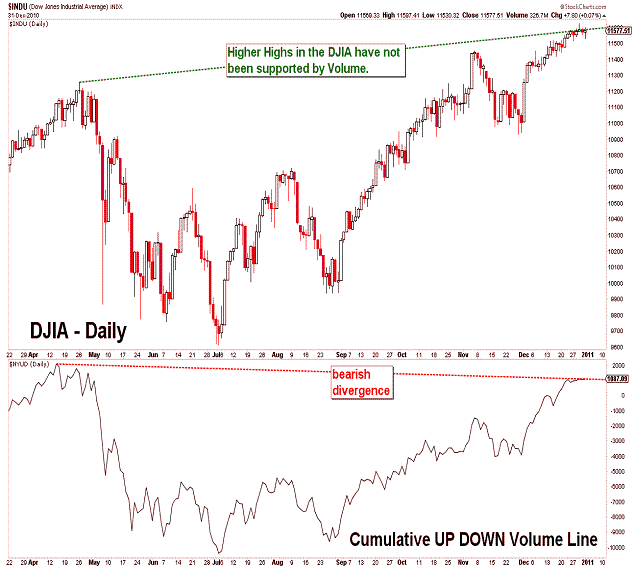
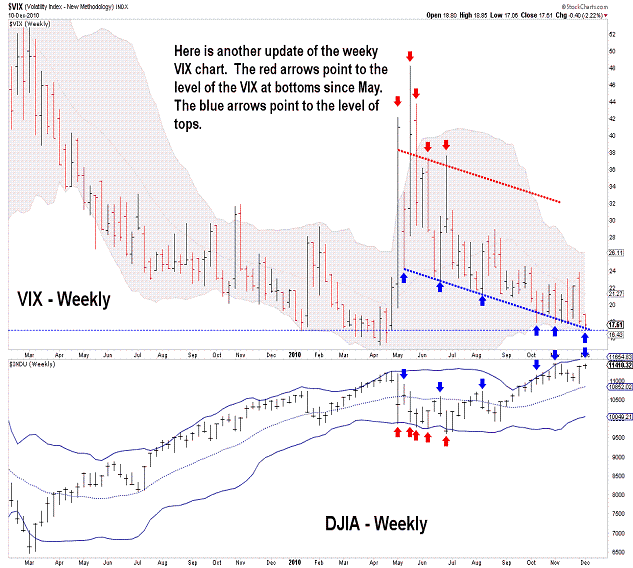
| December 31, 2010 update...The market moved in a very narrow range this week...which is quite typical of this holiday period. I said last week that "the majority of technical indicators, sentiment indicators, Elliott wave patterns, Fibonacci cycles, etc." suggest an important high is near. Nothing has changed...as you can see in the updated charts. One thing that I did note this week (see first two charts) was the similarity of the current long term pattern with the pattern that unfolded during 2001-2002. If the current pattern continues to follow that pattern, the entire rally from the March 2009 low will be completely retraced. The 2001-2002 chart only shows the beginning of that retracement. As bearish as I am right now, one thing about the pattern bothered me. It does allow for a more complex top to develop over the next several months. If the DJIA holds above the 10929 area during the next decline, one more rally to the top is possible before the eventual collapse. We'll see. Anyway, Happy New Year! |
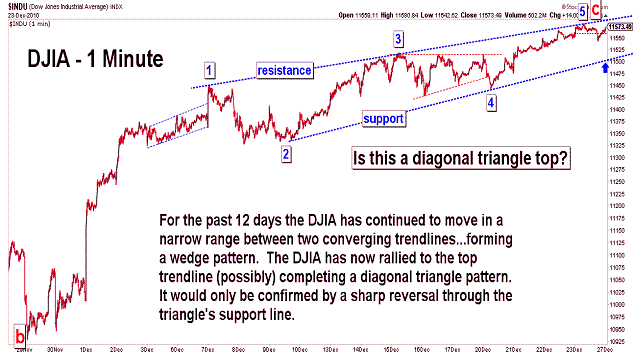
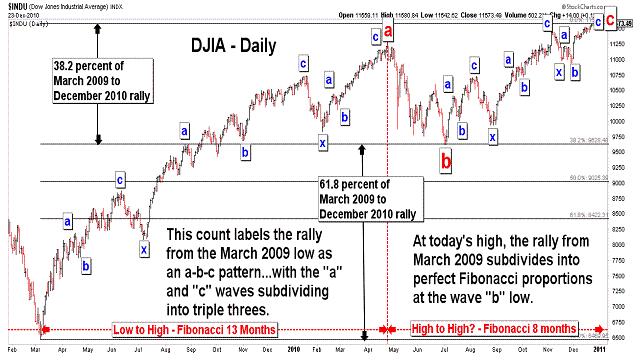
| December 23, 2010 update...The market advanced in sluggish fashion this holiday shortened week. It seems that CNBC and the bulls that the network constantly interviews believe the market will continue higher beyond this week...well into next year and likely into 2012. The bears have dwindled to a very tiny number and have had their voices muted in the face of a now (Fibonacci) 21 month rally from the March 2009 low. If the market is to keep moving higher, it will have to do so in the face of the majority of technical indicators, sentiment indicators, Elliott wave patterns, Fibonacci cycles, etc. that have, at least up until now, always coincided with an important high. If next week's market action is as uninteresting as this week's was, we will probably have to wait for the new year for the market's next big move. In the meantime...Merry Christmas! |
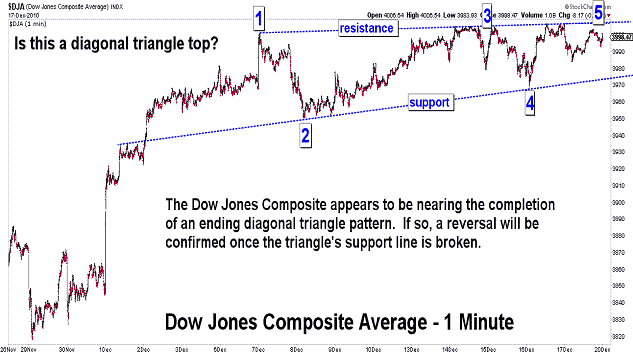
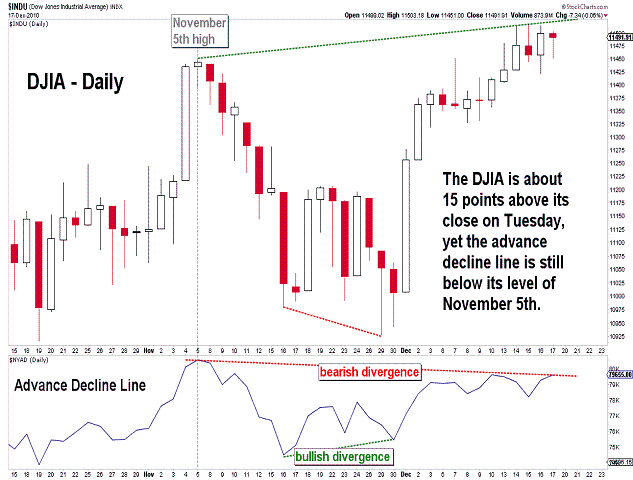
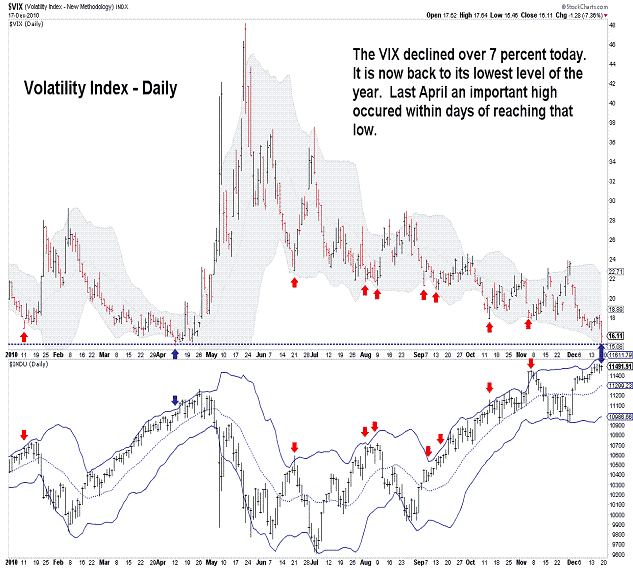
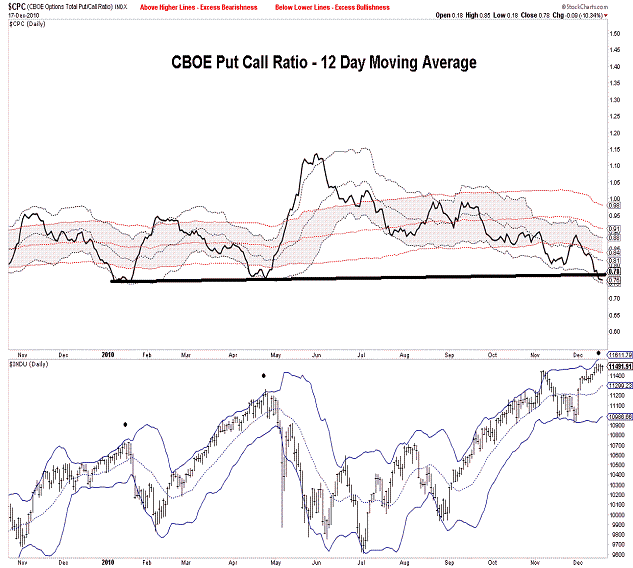
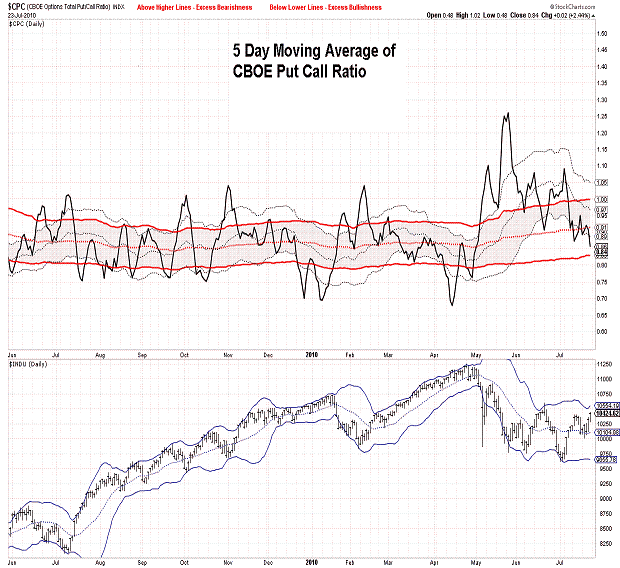
| December 17, 2010 update...There is not much to add to Tuesday's update. The market indices closed the week fractionally higher....with the DJIA closing above November's weekly closing high. The only major indice that I follow that has still not made a new closing high is the XMI (it could happen next week, however...it is less than 2 points away from doing so). The technicals remain at levels typically associated with a top (see VIX and Put Call Ratio charts). Also suggesting a top are the patterns of a number of indices that appear to have ending "diagonal triangles" (see chart of Dow Jones Composite Average). Despite the holiday trading towards the end of next week, it could be interesting. |
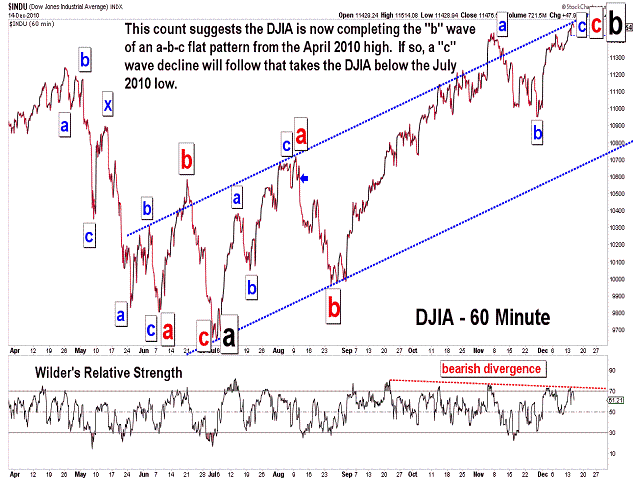
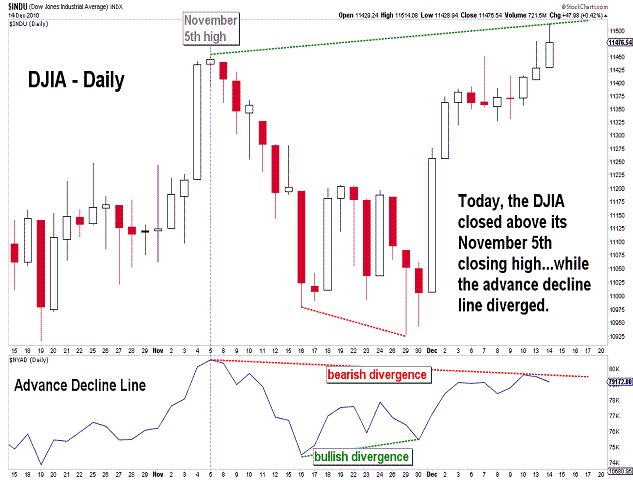
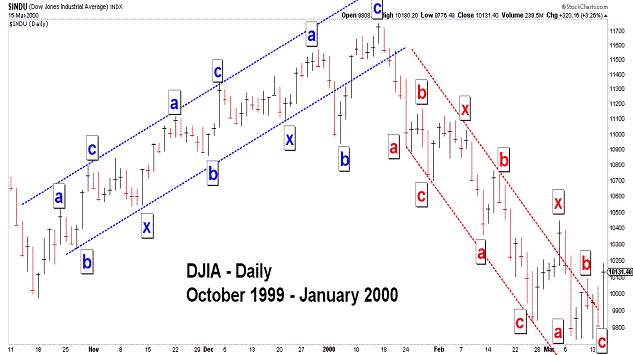
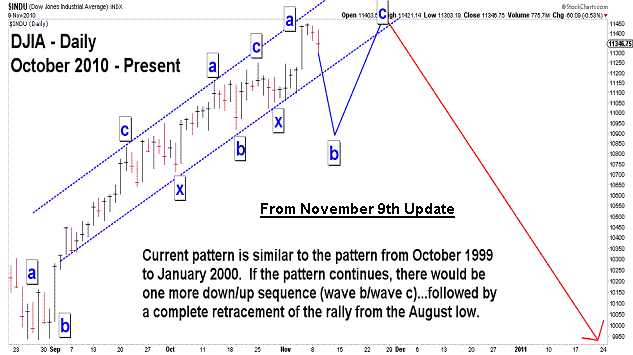
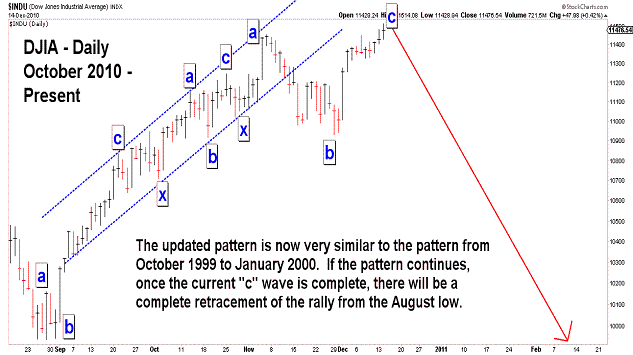
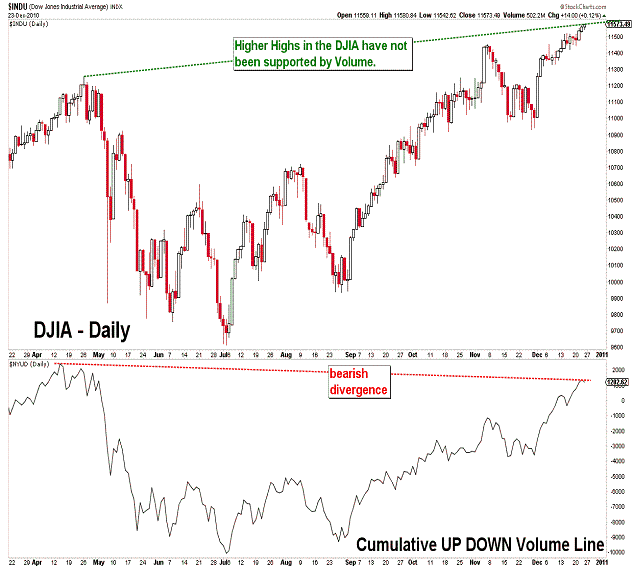
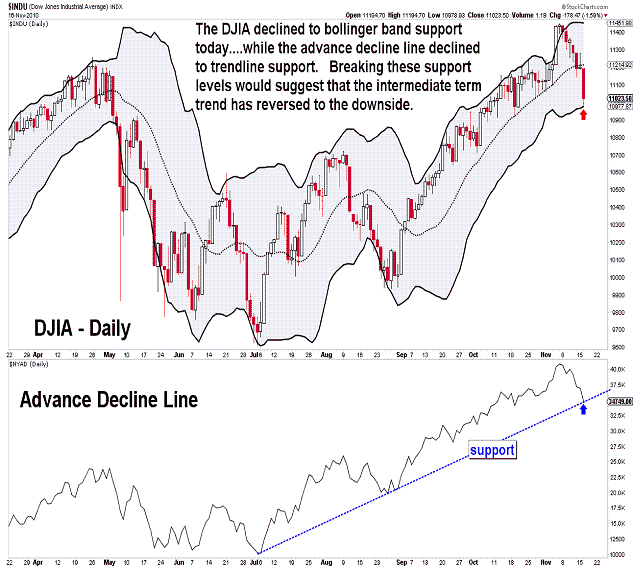
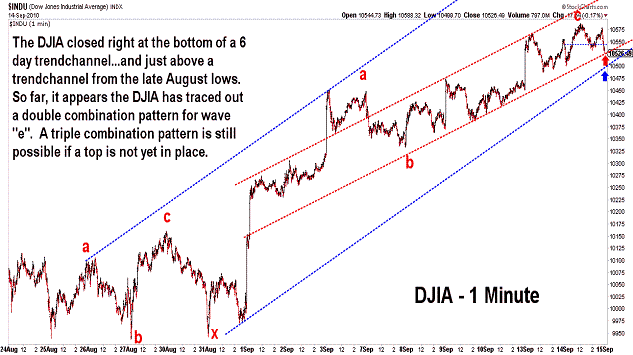
| December 14, 2010 update...The DJIA joined most of the other broad stock market indices and surpassed its November 5th high. It did so on an intraday basis yesterday...and a closing basis today (note: keep an eye on this Friday's close to see if the weekly high close of 11444.08 is also exceeded). But, despite the positive gains in the DJIA yesterday and today, the advance decline line moved lower each day. It...and the Major Market Index (XMI) on a closing basis...have, so far, failed to exceed their November 5th highs...creating a short term bearish divergence. I again posted two DJIA charts previously shown on November 9th (see below), along with an updated DJIA chart, that shows the similarity of the DJIA's pattern durring 1999-2000 with its current pattern. If the earlier pattern continues to be followed, the DJIA will soon begin a "c" wave decline that completely retraces all of the gains from the July-August lows. |
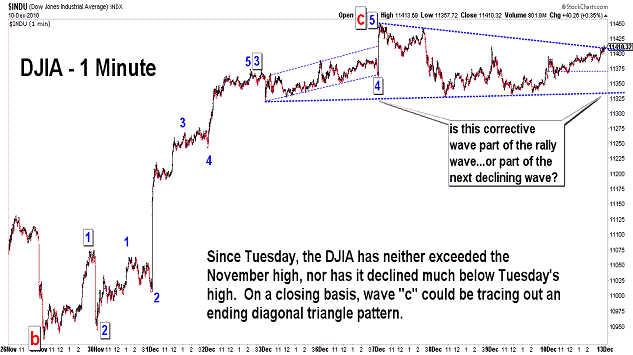
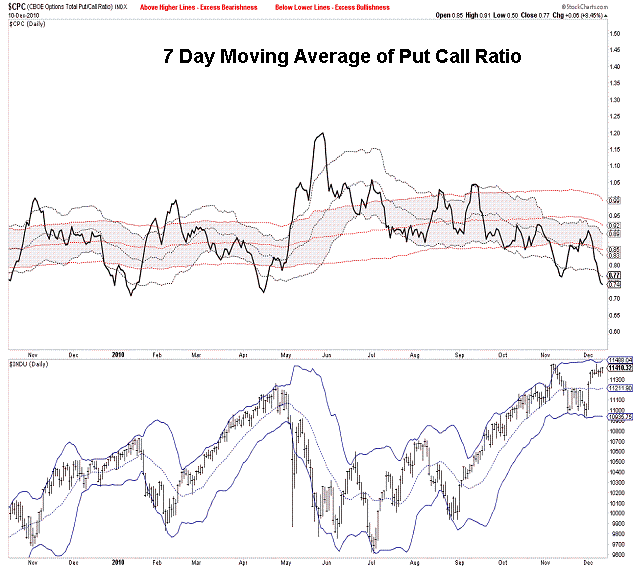
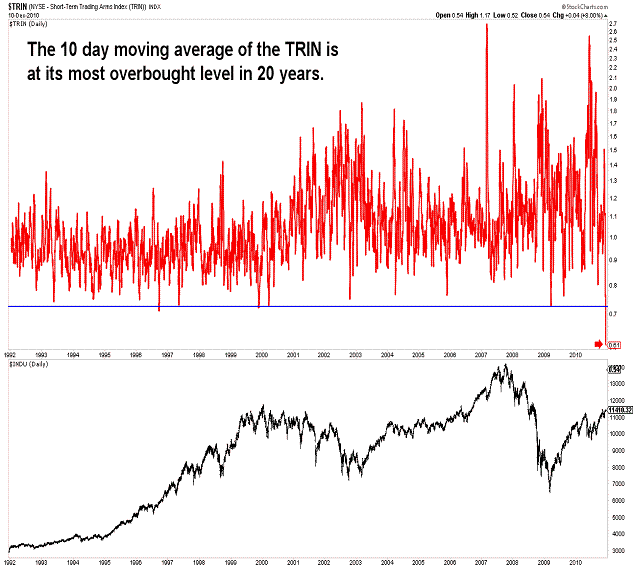
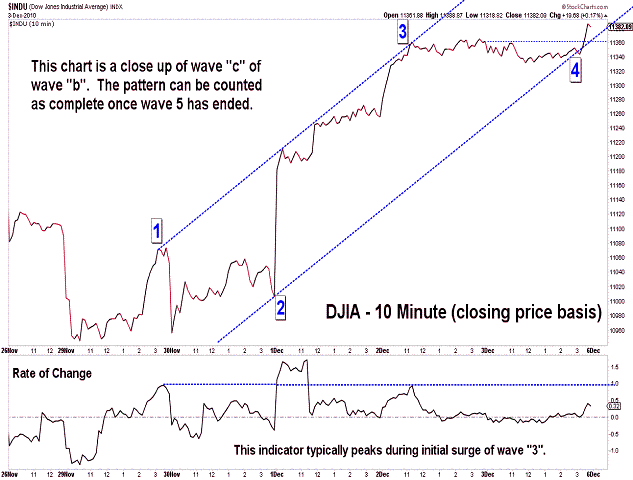
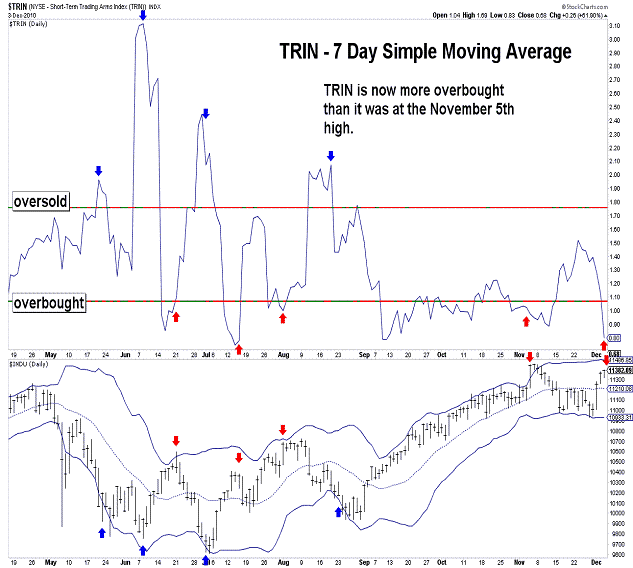
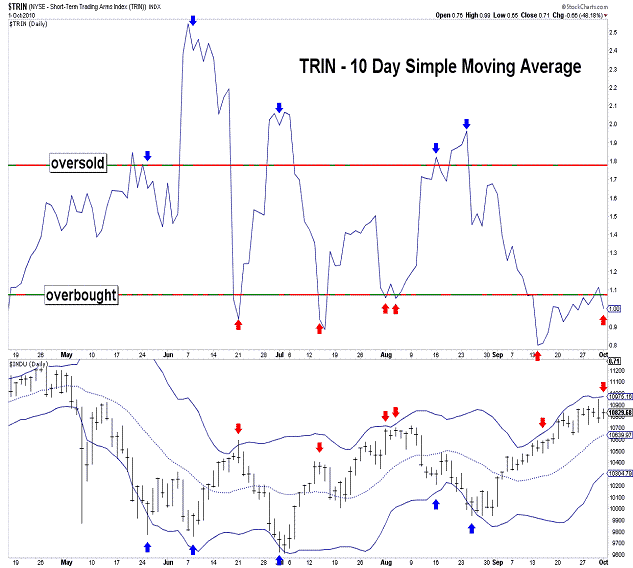
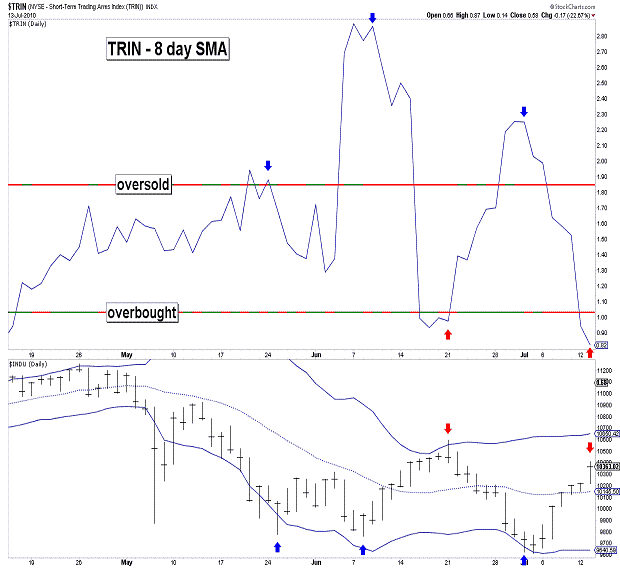
| December 10, 2010 update...On Tuesday, I suggested that if the DJIA remained below 11451 and my preferred wave count was valid, a powerful decline would begin "within the next day or so." Well, the DJIA did remain below 11451...but, the "powerful decline" never materialized. For the most part, the market spent the latter part of the week traveling sideways. On a closing basis, it appears that the DJIA could be tracing out a diagonal triangle pattern for wave "c" of the inverted flat pattern that I described in recent updates. If so, the pattern still needs a 4th wave decline and final 5th wave rally. It would take several more days to finish the pattern. Should the DJIA immediately close below 11359, the pattern would be negated...and a more significant decline would follow. I posted updates of several of the technical indicators that I follow to illustrate the extreme overbought condition of the market. In fact, the 10 day moving average of the TRIN is now at its most overbought level in 20 years. If that is meaningful, we should find out just how much within a short period of time. |
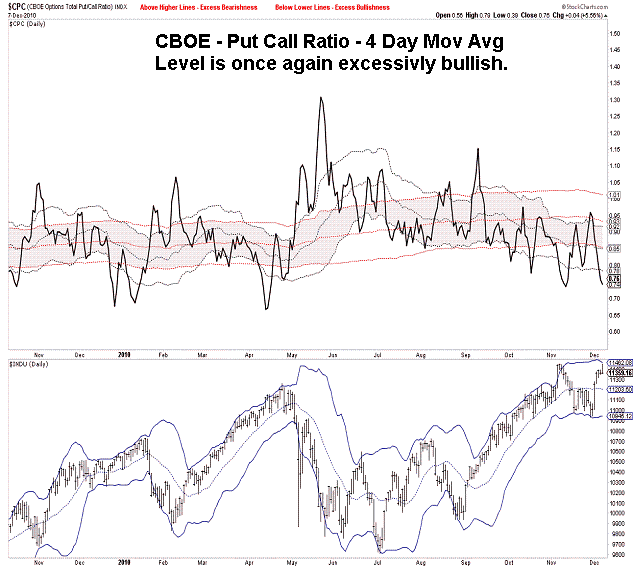
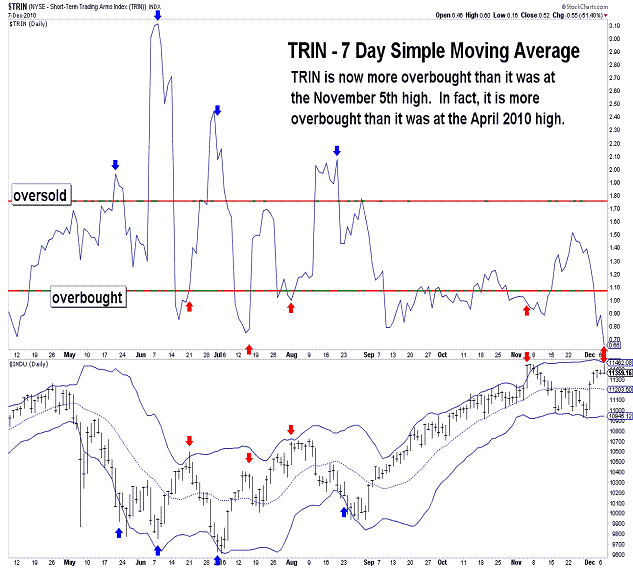
| December 7, 2010 update...On Friday, I indicated that the key to my preferred wave count was the November 5th high of 11451 (the precise number is 11451.53). Today, the DJIA came within a fraction of a point of that number and reversed course...closing down on the day. So, at least for today, my preferred count is still valid. And, if it is valid, the DJIA must begin within the next day or so a poweful decline below the November 29th low of 10929. Should the DJIA instead turn up and exceed today's high, the wave count would change to the one shown above for the S&P 500. (See the November 9th update for charts and a discussion of this possibility.) Finally, in addition to the DJIA's wave pattern, many of the technicals that I follow currently support a decline from here (see put call ratio and trin charts). |
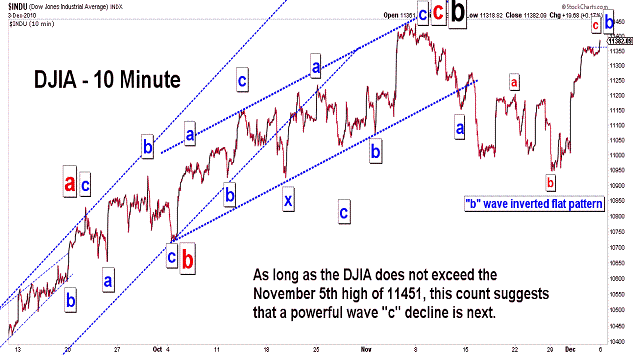
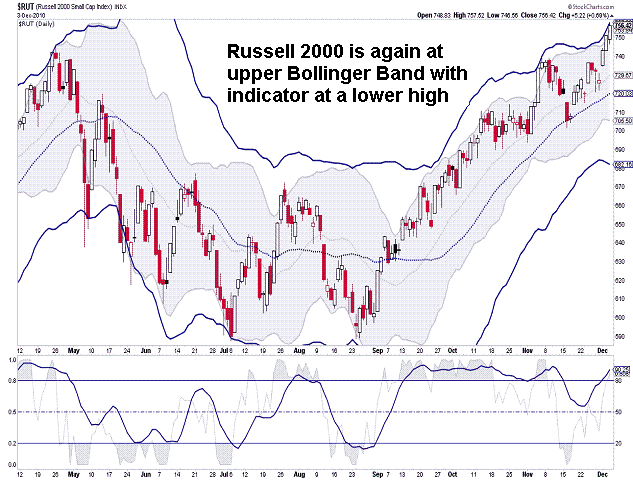
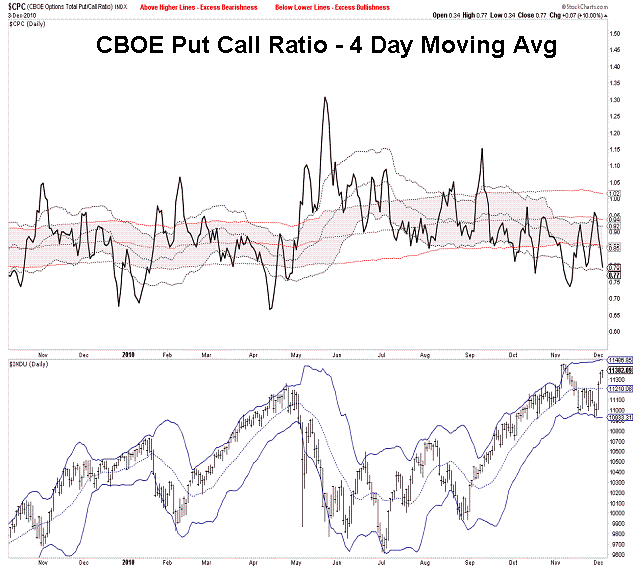
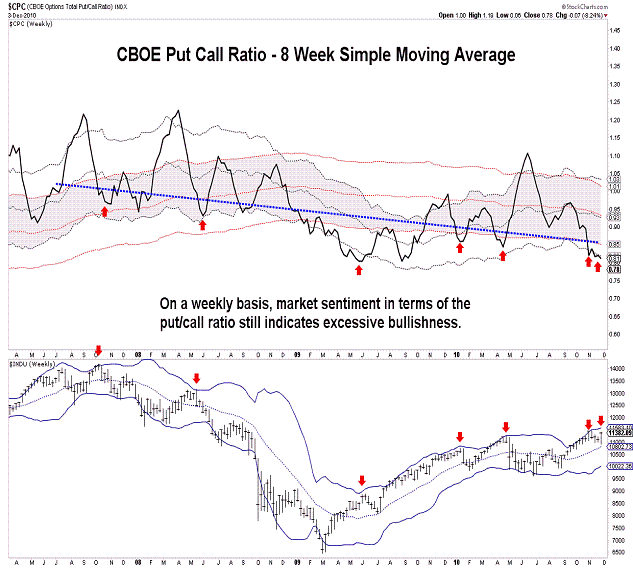
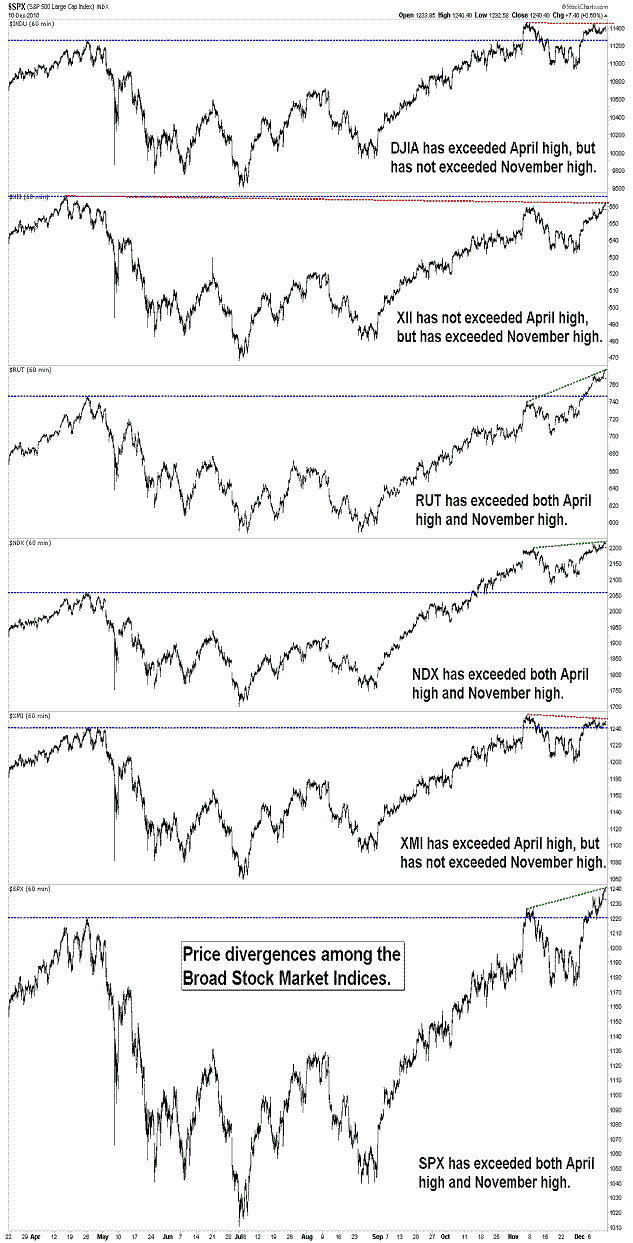
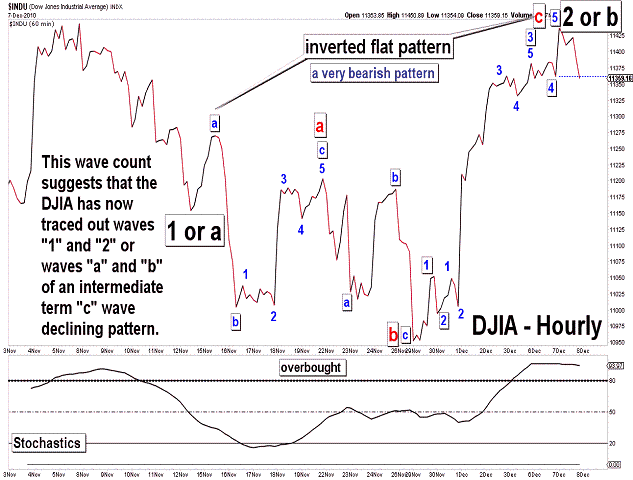
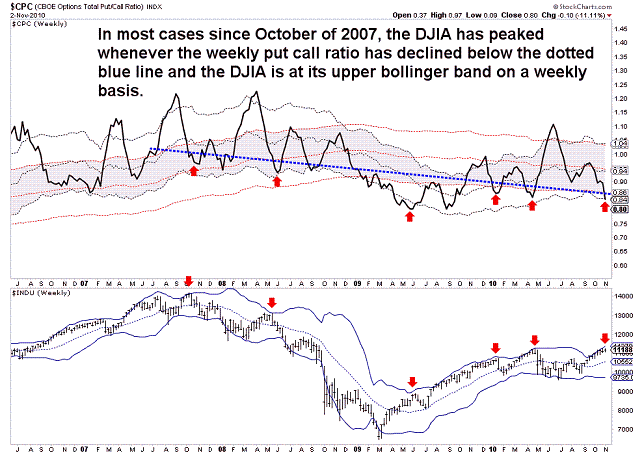
| December 3, 2010 update...In Tuesday's update I posted two charts that suggested possible short term patterns for the DJIA. I said: "The next two or three days should reveal which of the two ...patterns is correct. Well, the market did indeed reveal that the third chart in Tuesday's update was the correct count...at least so far. That count suggested that the DJIA was tracing out an inverted flat pattern (a very bearish pattern) with a "c" wave rally to come. The count further suggested that a larger degree "c" wave decline would follow once the smaller degree "c" wave rally pattern completed 5 waves. It appears that a 5th wave pattern began near the end of today's session. The key for this count is the November 5th high of 11451. This level cannot be exceeded for the count to remain valid. If it is exceeded, some other pattern is unfolding. While the DJIA and most indices are below their November 5th highs, several indices have, in fact, exceeded their November highs, i.e., Russell 2000 and the S&P 400. Their wave counts are slightly different...but, they too have reached extreme levels (in terms of their upper Bollinger bands - see Russell 2000 chart). Finally, note that market sentiment has returned to levels that would support a near term reversal to the downside (see put call ratio charts). Next week's action will be very critical in terms of the intermediate term trend. |
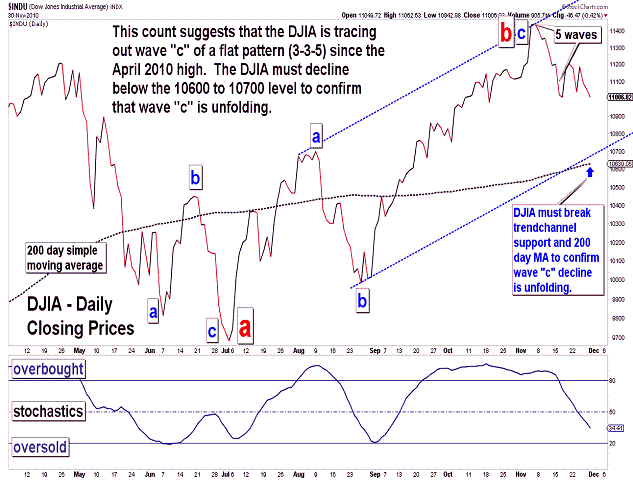
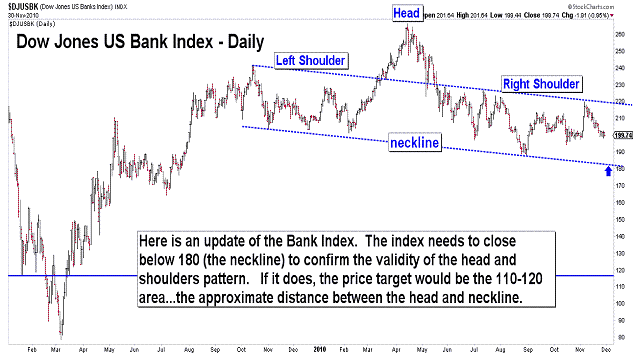
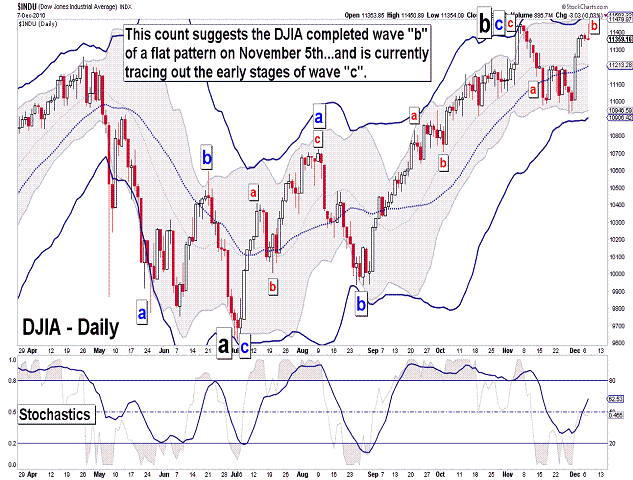
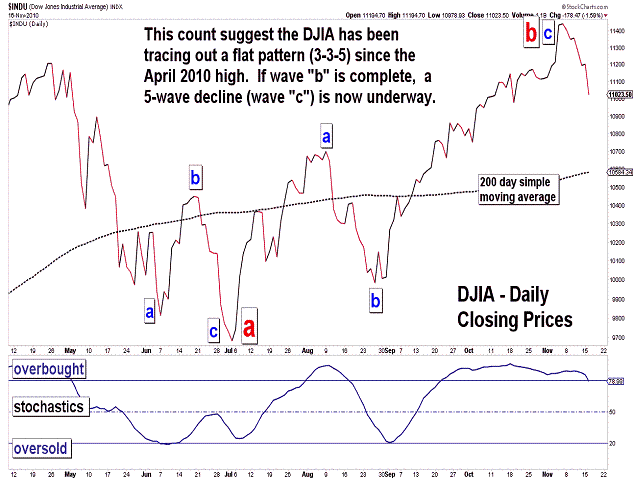
| November 30, 2010 update...The DJIA ended the month of November with a 1 percent loss...leaving the monthly chart (on a closing basis) with a 3 wave pattern in place since the June closing low. The monthly decline lends support to my primary wave count that a "b" wave pattern has unfolded since the July intraday low...and is part of a "flat" (3-3-5) pattern from the April high. Assuming that a "c" wave decline is now unfolding from the November 5th high, it is still early in terms of the pattern's development to determine how long the pattern will last and how low it will eventually go. The second and third charts above show two possibilites for the short term. The next two or three days should reveal which of the two (or possibly more) patterns is correct. Finally, I updated the Bank index chart...which continues to show the validity of the head and shoulders pattern formation. In the coming days, the action of the index at the neckline should reveal the index's intermediate term direction. Volume should expand as the neckline is approached and broken if a downward trend is unfolding. |
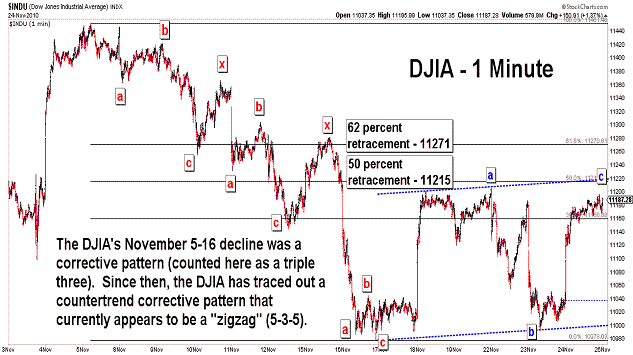
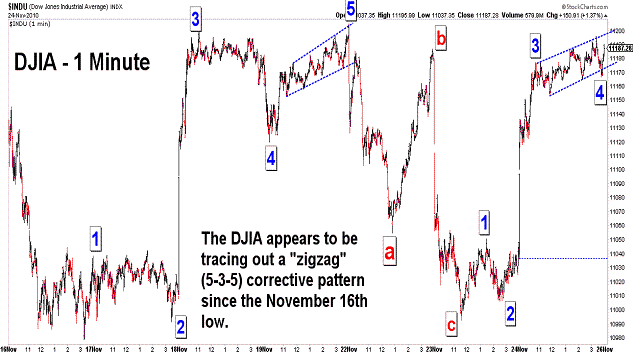
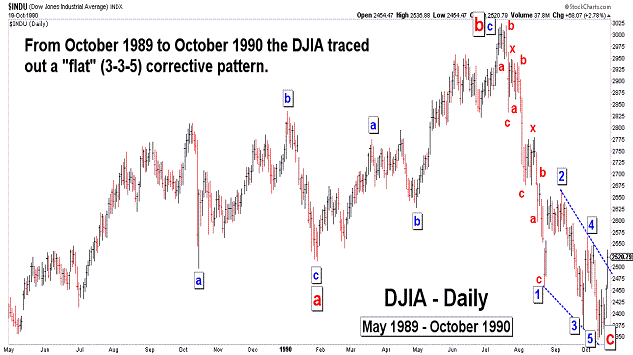
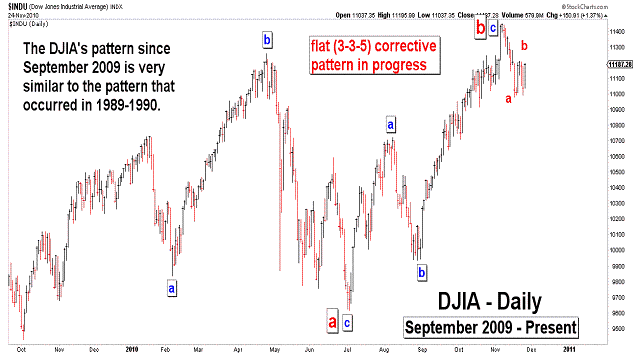
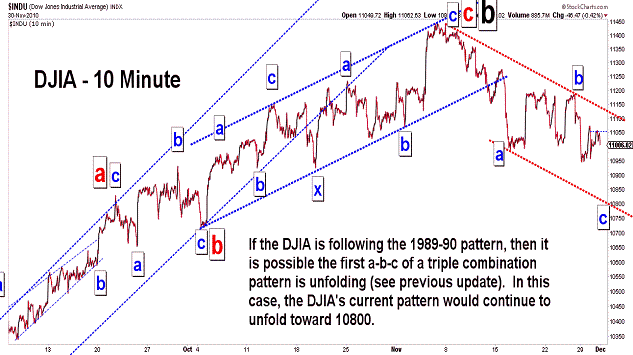
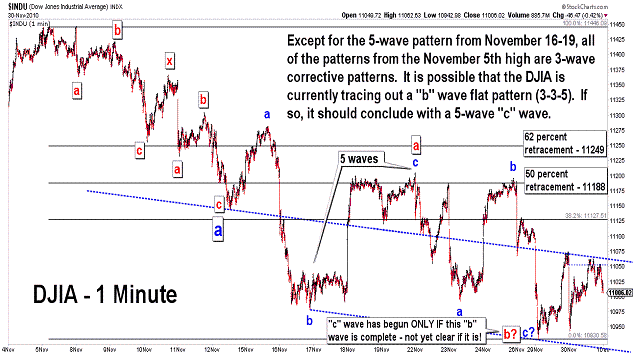
| November 24, 2010 update...The market has been tracing out a countertrend corrective pattern since the November 5th to November 16th decline. As of today, that pattern counts best as a "zigzag" (5-3-5). Possible Fibonacci retracement levels for the current upward correction are shown in the first chart above. The third and fourth charts above illustrate an interesting comparison between the DJIA's 1989-90 pattern and the current pattern since September 2009. The 1989-90 chart shows a completed "flat" pattern...and the current chart shows a (likely) "flat" pattern that is still unfolding. If wave "c" of the pattern is, in fact, underway, the market will stairstep its way lower in the coming months...with an ultimate target below the lows of July. Any rally above the November 5th high (obviously) means that wave "b" is not yet complete. A decline below last week's low should IMO confirm that wave "c" has begun. I don't expect either to occur during the half-day session on Friday. In the meantime, have a happy Thanksgiving holiday! |
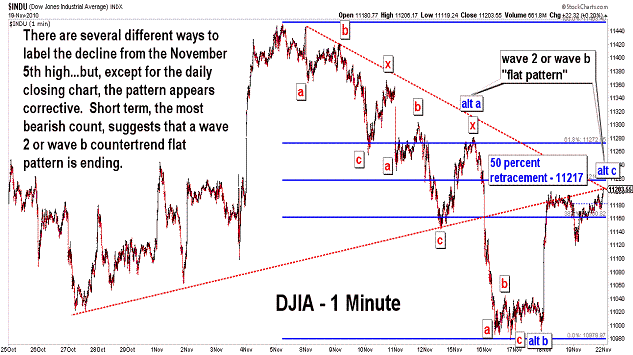
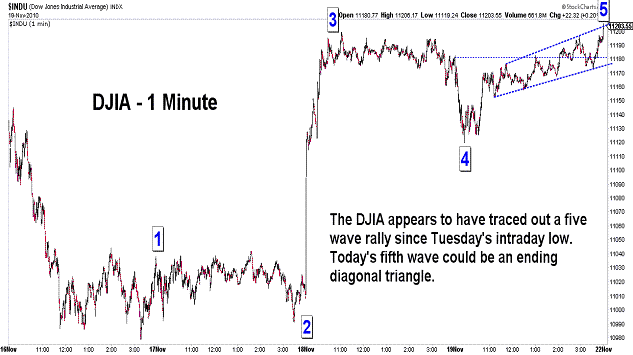
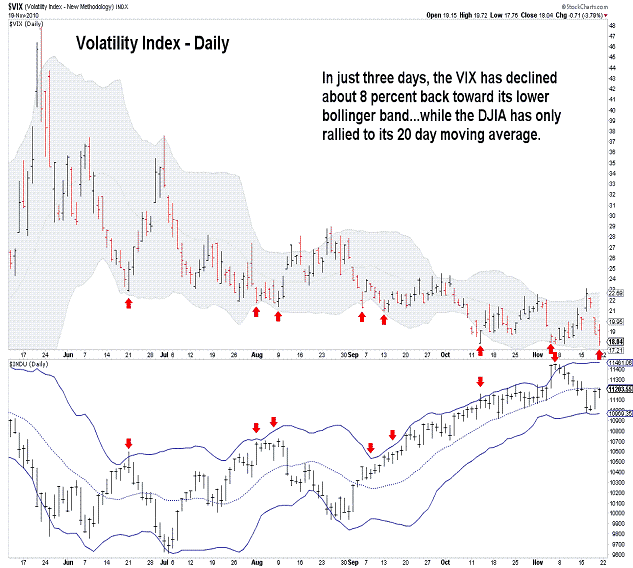
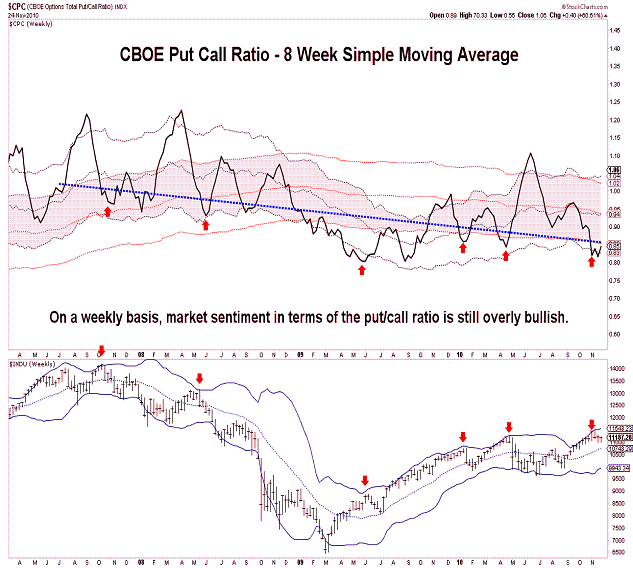
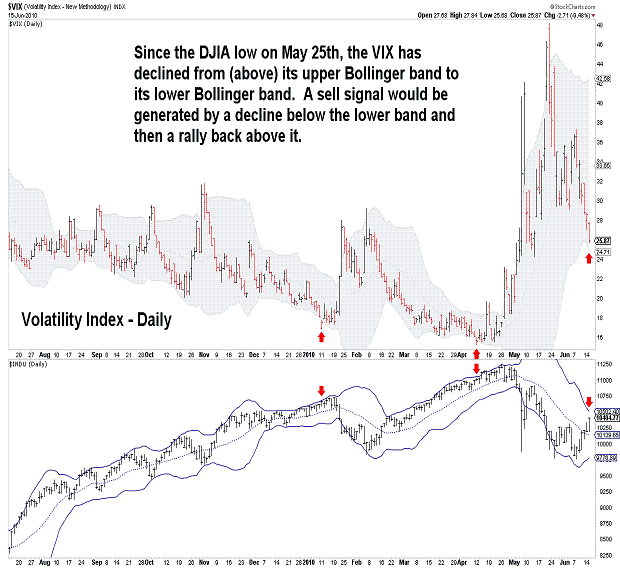
| November 19, 2010 update...On Tuesday I said: "The DJIA has...reached its lower bollinger band...on the daily chart (which) is typically a point where there should be a bounce of one degree or another." Well, the DJIA did bounce...and has, so far, retraced about 50 percent of its decline from the November 5th high. As of today's close, the wave count is open to a number of interpretations...but, it does appear that, except for the chart of daily closing prices (a five-wave pattern), the pattern appears corrective. That does not necessarily imply that the DJIA will continue to rally and surpass the November 5th high...but, that possibility does exist. Some technical factors that millitate against that happening this time are: (1) the put/call ratio is still in excessively bullish territory, and (2) the VIX has quickly declined back toward its lower bollinger band (close to a sell signal). We'll have to wait for more action next week to get confirmation of the market's larger trend. At the very least, the odds have increased that an intermediate term decline has begun. Should a rally to a new high occur, it would be short-lived IMO and an intermediate term reversal would immediately follow. |
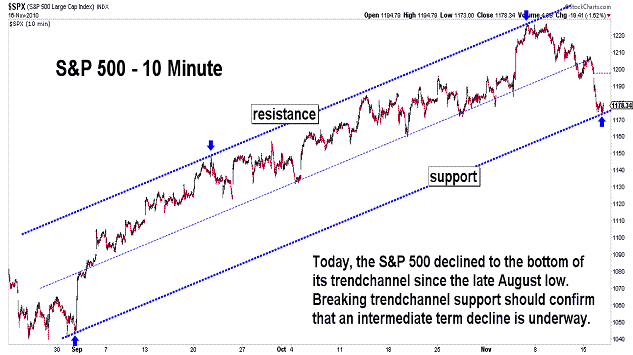
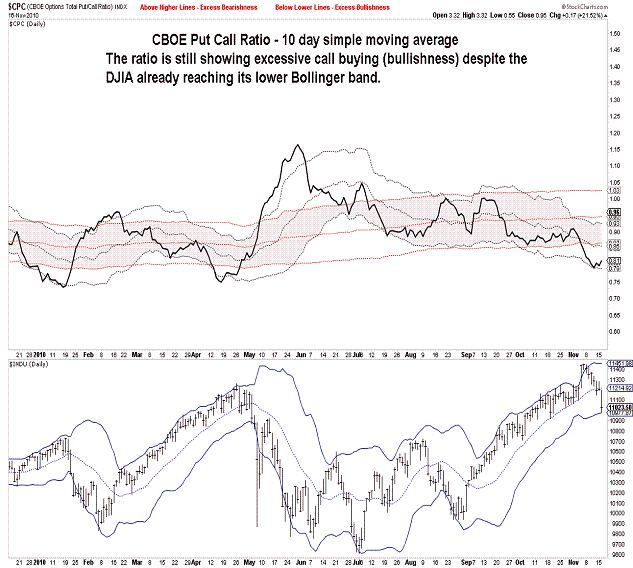
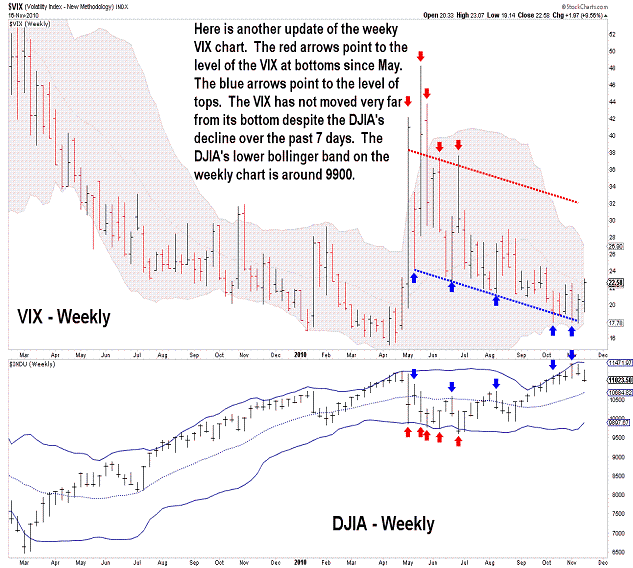
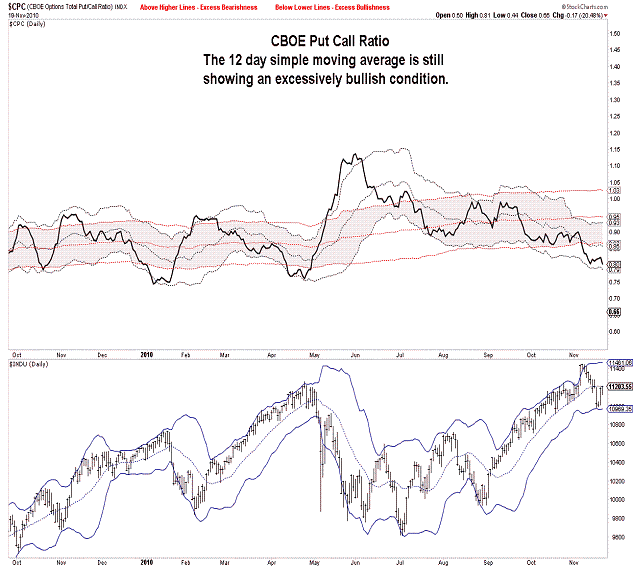
| November 16, 2010 update...The DJIA has declined about 420 points over the past 7 days...and in so doing, has reached its lower bollinger band (computed using a 20 day moving average and 2 standard deviations) on the daily chart. This is typically a point where there should be a bounce of one degree or another. In addition, the S&P 500 has reached the bottom of its rising trendchannel from the August low, and this is a level that would also suggest some type of bounce. So, it will interesting to see if one does, in fact, develop over the next few days...and, if so, how high it goes. Any failure by the market to rally will, in my opinion, be a clear signal that an intermediate term decline (wave "c" under my preferred Elliott wave count) is underway. Technically, the market is still supportive of further declines. Except for the most short term of indicators, the market is just beginning to move out of an overbought condition. Market sentiment, in terms of the CBOE put/call ratio, is still showing excessive bullishness. The VIX (a measure of volatility) is another indicator that is no where near levels that suggest an important bottom is in place. As long as any rally that does develop in the coming days is of a corrective nature, i.e. a three wave pattern, the larger trend will be down toward the July lows. Short term resistance should be around yesterday's high. |
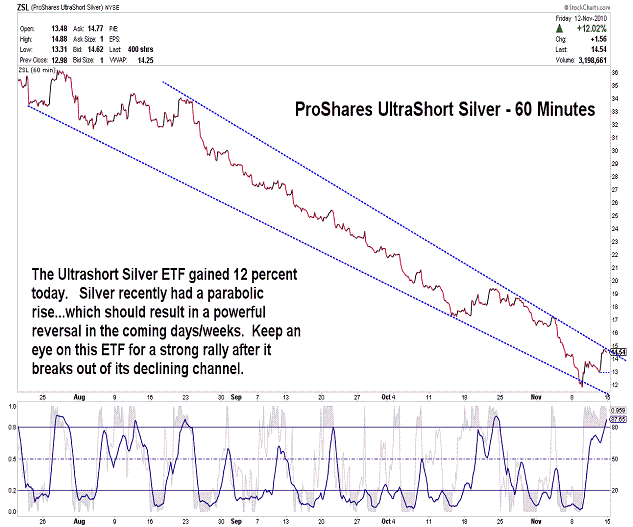
| November 12, 2010 update...There is not much to add to Tuesday's commentary. The market made a top last Friday...and has since declined about 2 percent. Whether or not it's the final top before a wave "c" decline below the July lows is not yet clear. I think a decline below 10900 would suggest that it is...but, until then keep your options open. And, even if a top is in place, there is likely to be one scary contertrend (wave 2) rally at some point in the near term. Lastly, keep you eyes on silver (the chart of ProShare UltraShort Silver ETF is used as a proxy above). It's recent rally was parabolic...and these types of moves are almost always followed by similar action in the opposite direction. |
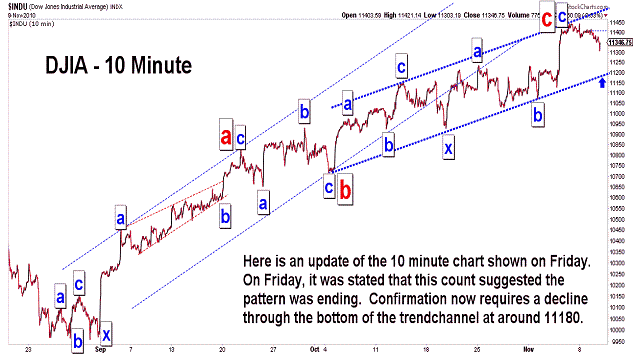
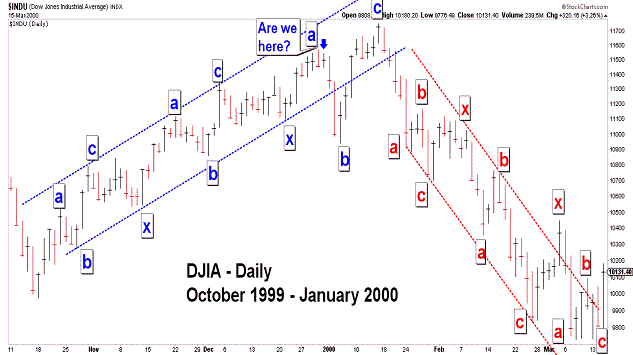
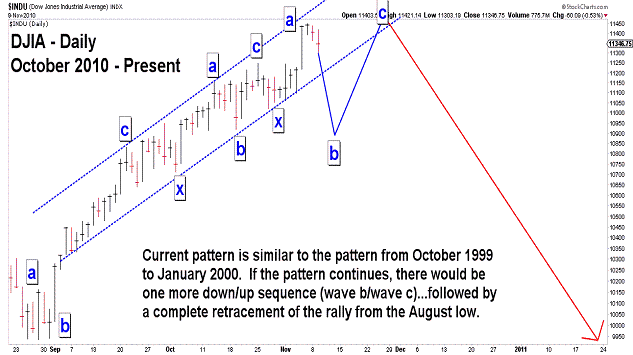
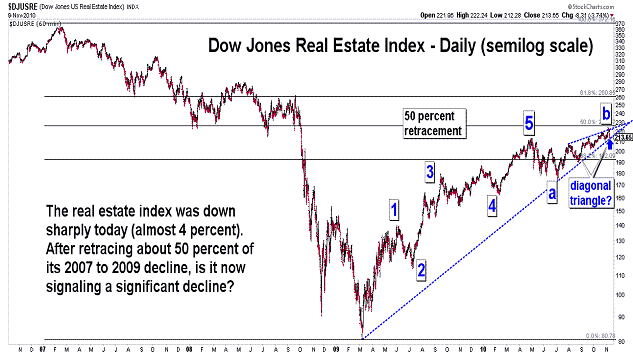
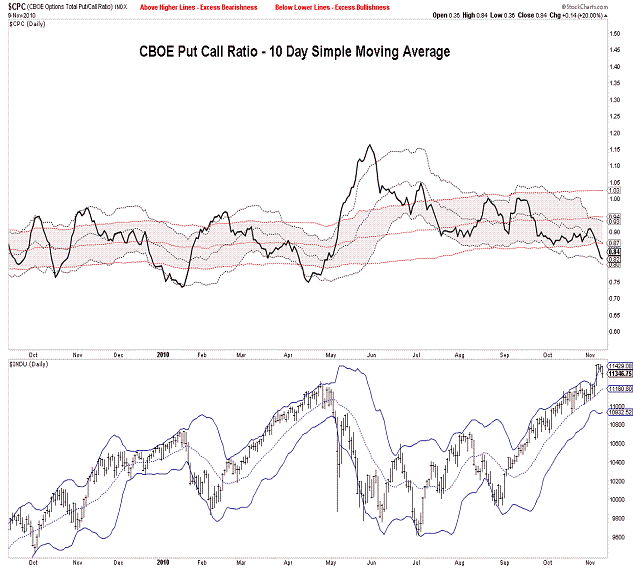
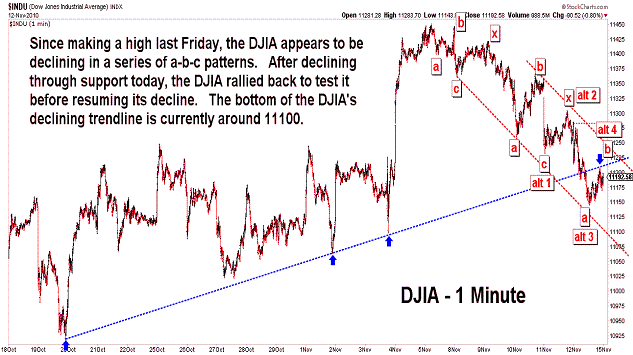
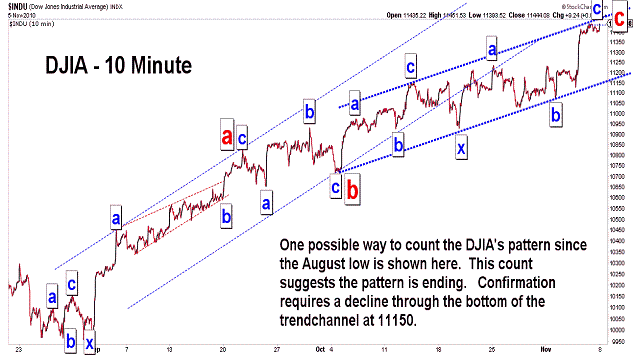
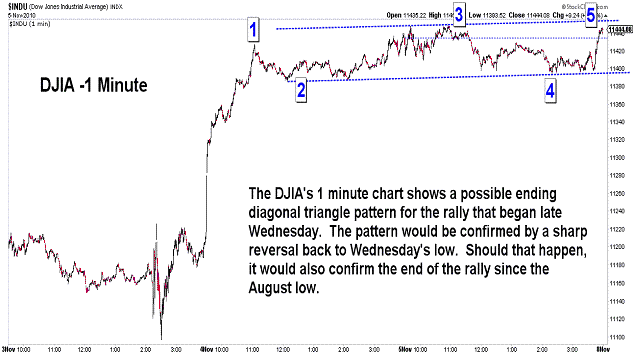
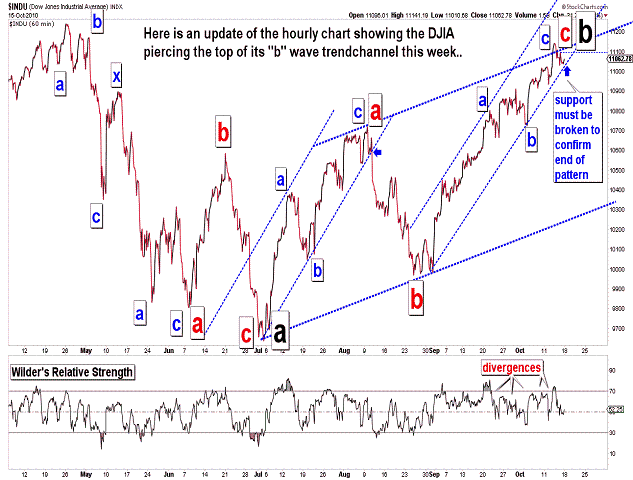
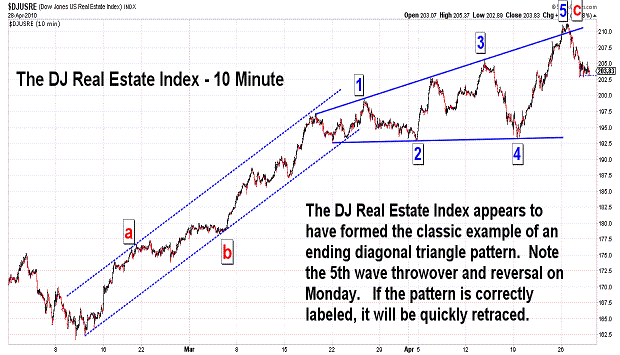
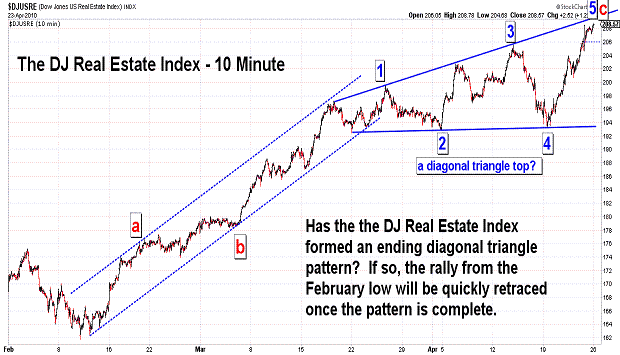
| November 9, 2010 update...The market has started to decline...but, must continue further to confirm that a top is in place. Initial confirmation requires a break of the 11180 level, the bottom of the DJIA's current trendchannel. Even if that level is broken, there is still the possibility of a final surge, as illustrated by the 1999-2000 pattern. The extent of the current decline should provide some clues as to whether or not another rally is likely to occur. One indicator to watch now is the put/call ratio. High put/call ratios in the coming days would suggest another rally. On the other hand, a low ratio would be mean that call buyers are speculating on another rally...reducing the liklihood of that outcome. I noticed today that the real estate index was especially weak...and appears to have completed a pattern that suggests further declines. We'll see. |
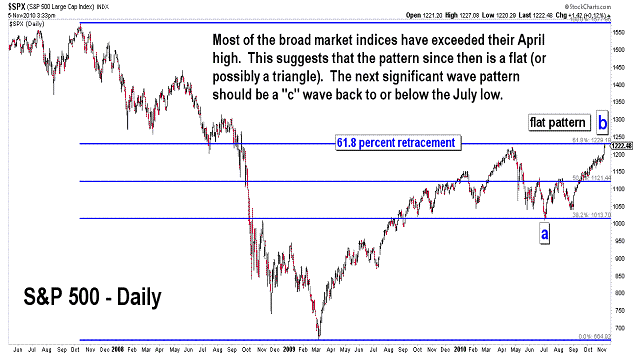
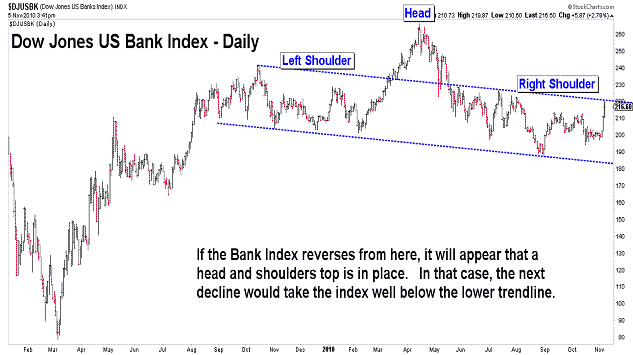
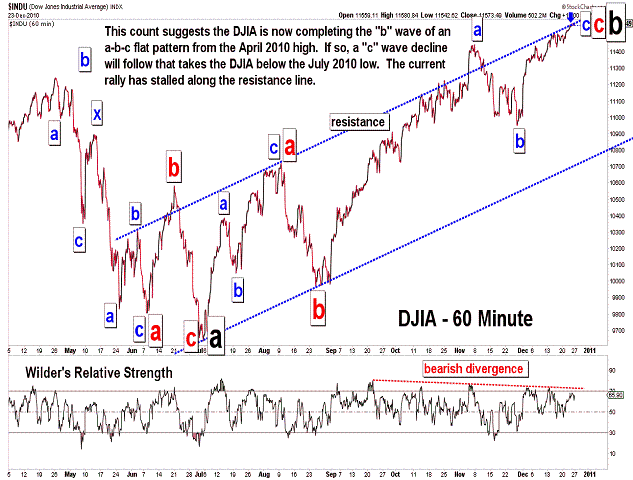
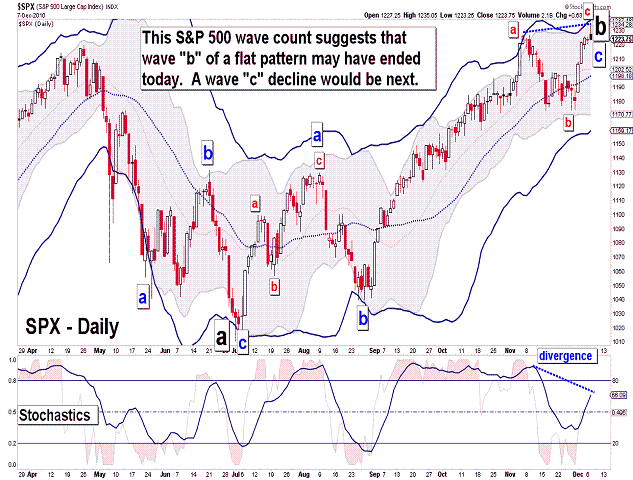
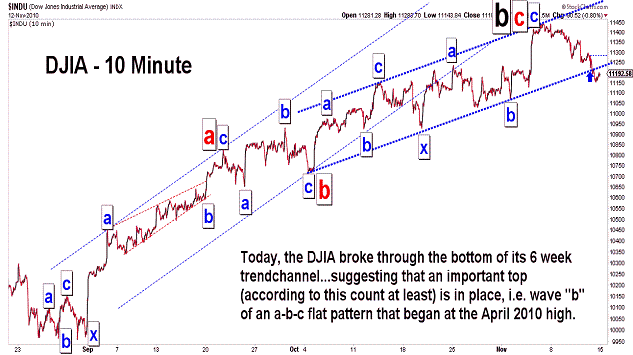
| November 5, 2010 update...Last Friday, when the monthly close for October exceeded the close for April, I said: "...if the daily and weekly charts follow the monthly chart, then there will be a rally at some point above 11258." Well, we didn't have to wait very long. Today's high was almost 200 points above the April high. Most of the other broad indices have joined in and exceeded their April highs as well, with the exception of these three that I follow: OEX, RUT and XII. An interesting divergence would be in place if the market turns down without these indices making new highs. As it is now, the longer term wave count is open to a variety of possibilites. I think I discussed the possibility of a new high previously in terms of an a-b-c flat pattern since April. That suggests a "c" wave decline will follow the completion of the current rally wave...and take the DJIA back to or below the July low. From there (depending on the form of the decline), the corrective pattern could expand into a triangle, or, if the pattern from April is complete, a rally back towards the October 2007 highs could even unfold. There are other possibilities as well (I really hate when there is this much uncertainty - thank you Federal Reserve!). I have heard that some other Elliott wave sites are labeling the current rally as a wave "3" of "5"...and are expecting the next decline to be a "4th" wave. I personally don't like this count given the pattern of the decline from April to July...but, I guess it is a possibility. Finally, note the posting of the charts of the S&P 500 and Bank index, in addition to the DJIA charts. Like the DJIA did in April, the S&P 500 has now rallied to the 61.8 percent Fibonacci retracement level of its 2007 to 2009 decline. The Bank Index, which has been one of the weakest indices since the April high, has traced out an apparent head and shoulders top, IF the index turns down from here. We'll see. |
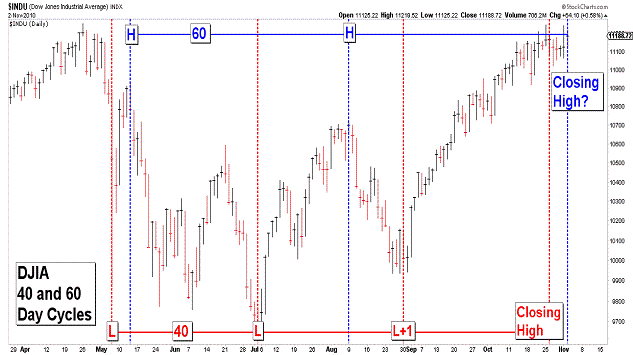
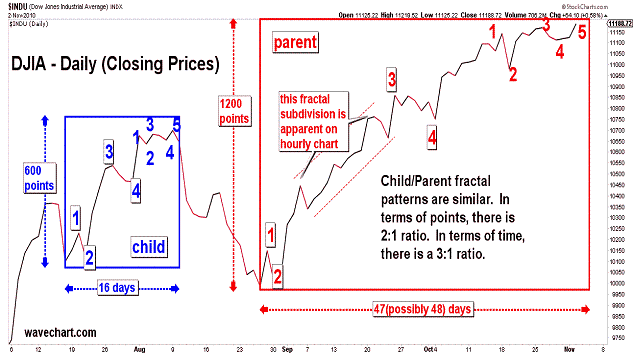
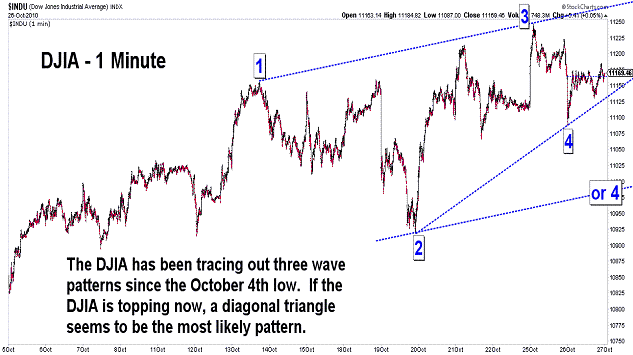
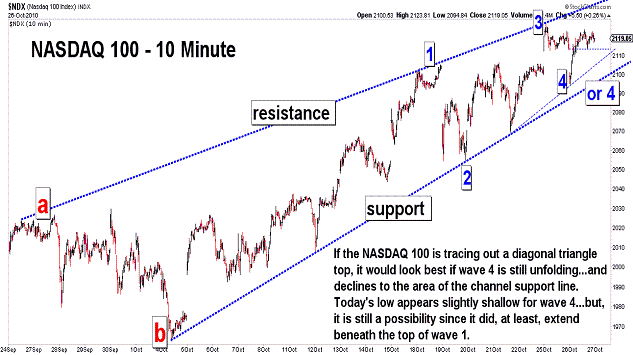
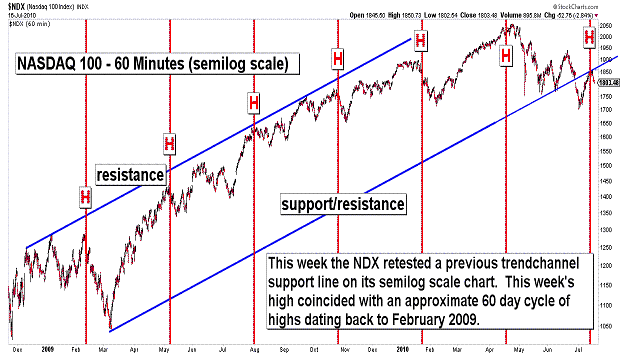
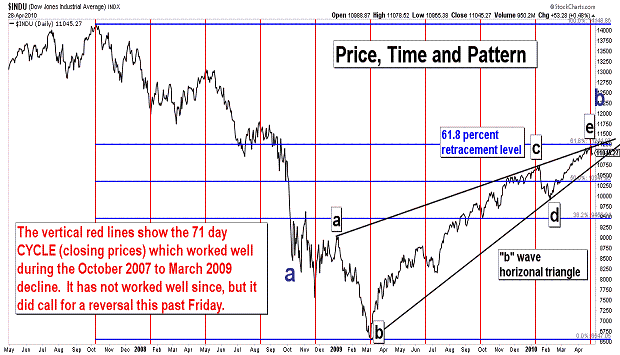
| November 2, 2010 update...In recent updates I have pointed out a number of cycle turning points materializing in the current time frame, one of which occurred today. Today's 60 day cycle turn date did not produce an intraday high (the most recent intraday high occurred on October 25th), but it did, at least, produce a closing high of 11188, the highest since the April 26th close of 11205. The short term pattern in most of the indices appears closest in appearancee to a diagonal triangle, although the pattern is clearly subclassic in form. Argueably, the fourth wave of the pattern was shallow and the fifth wave has not (yet) exceeded the third wave high. So, it is still possible that a rally above 11247 will take place in the next day or two. The diagonal triangle pattern could even elongate and become more complex. It would take a close below 10978 to eliminate that possibility. Take a look at the third chart above. It is a fractal chart which currently shows some interesting pattern, price and time relationships (on a closing basis) between the late July to early August rally and the present rally from the late August low. It requires a downward reversal in the next day or two from near current levels if the relationships are to remain intact. |
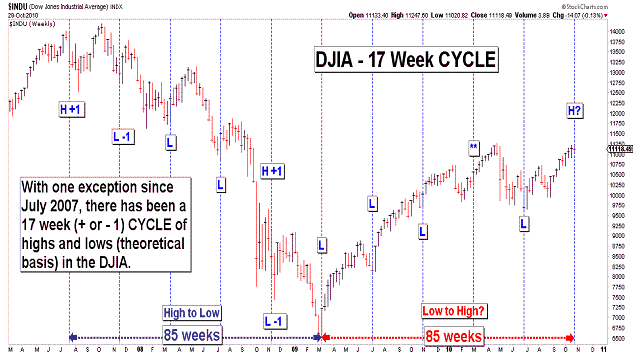
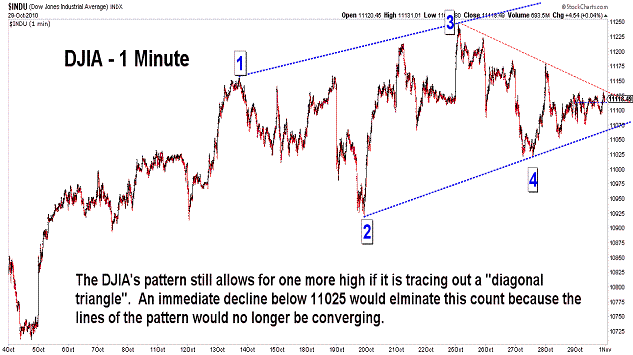
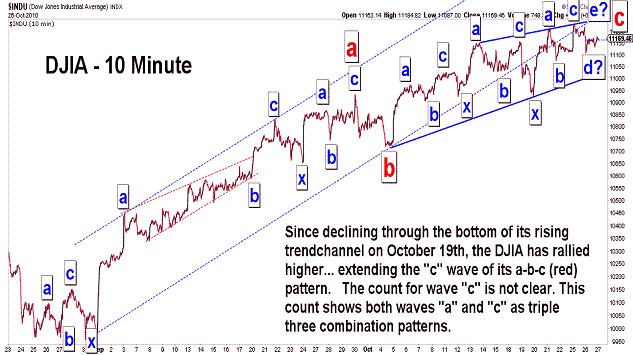
| October 29, 2010 update...On Tuesday I said that "this week is...the 17th week since the early July low...(and it) suggests a turning point this week, especially if the DJIA closes down for the week." (See first chart above.) Well, the DJIA did close down for the week...only the second time since the late August low. Thus, in terms of time, the market should now turn down. Patternwise, however, the DJIA could still rally higher to complete a diagonal triangle pattern. (See second chart above.) The 11025 area is the first key level for this count. It is the point where the lines of the diagonal triangle would start to expand, rather than converge (which is typical for this pattern). On a closing basis, the key level is 10978 (the DJIA's close on October 19th). This lower level would be the better confirmation that a top is in place. How low we would go next depends on the proper wave count for the pattern since July 2nd. If it is an a-b-c corrective pattern, it should be completely retraced...and more. If it is not an a-b-c pattern, and some doubt has been created by today's close on the monthly chart, then the decline will be less. The month of October ended slighly more than 100 points higher than the April closing high. Although there are times when all of the various charts don't line up with each other, if the daily and weekly charts follow the monthly chart, then there will be a rally at some point above 11258, either next week or later. We'll see. |
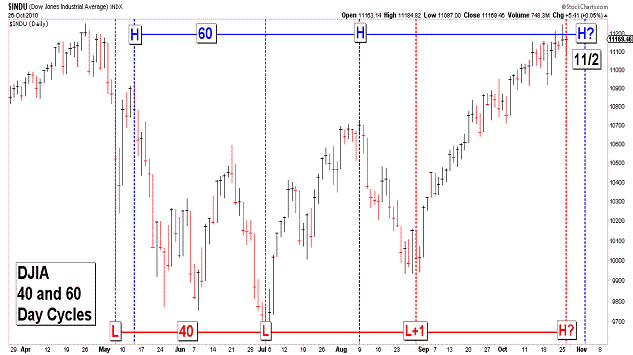
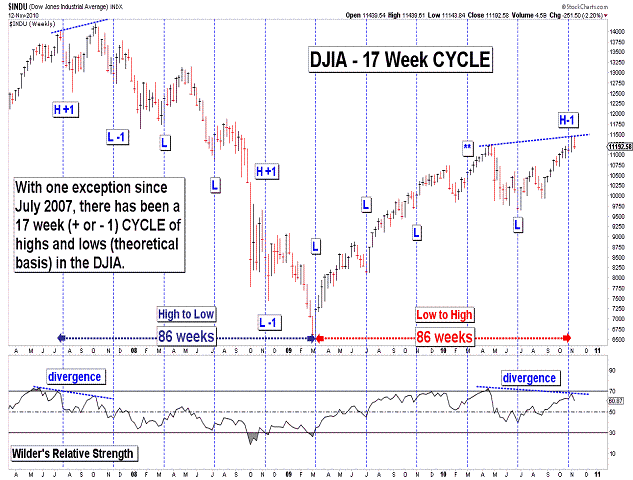
| October 26, 2010 update...It has been fruitless attempting to pick a top for the rally since late August using technical indicators, as well as Elliott wave pattern analysis. It seems when momentum takes hold of the market, you just have to bide your time. And time, in fact, may finally be running out for this rally if recent cycles have anything to do with it. Since the flash crash low on May 6th, there have been two prominent cycles in terms of trading days. Three important lows have occurred at 40 day intervals...and two important highs have occurred at a 60 day inteveral (a Fibonacci 2:3 ratio). We have entered a window beginning today where the two cycles are very close together. Today was the 40th day since the previous low...and next Tuesday will be the 60th day since the previous high. This week is also the 17th week since the early July low. It suggests a turning point this week, especially if the DJIA closes down for the week. I believe I last posted a chart of the 17 week cycle of highs and low in March...I'll post an update of it on Friday. |
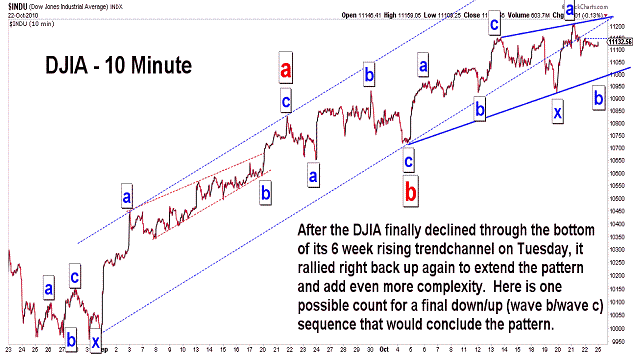
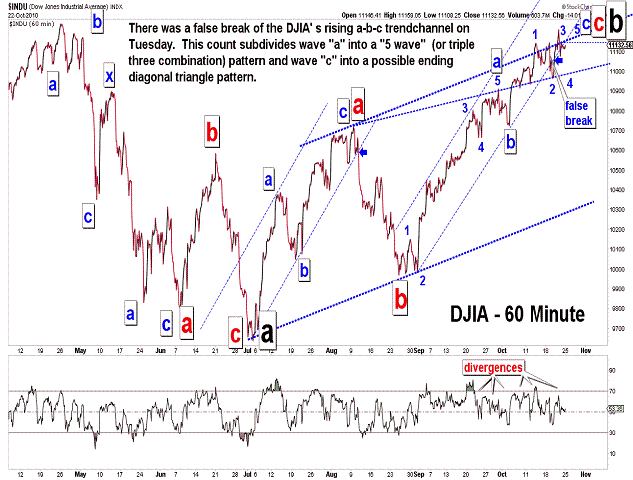
| October 22, 2010 update...Most of the broad market indices were up about 1/2 percent or so for the week. One of the most prominent losers of the week was the precious metals...the XAU lost more than 4 percent. Could this be an early indication of what is about to come for the rest of the market? We'll see. Thursday's high was 77 days from the July 2nd low. The April 26th high was 48 days before that low. So, that leaves a nice 1: 1.618 Fibonacci ratio in place between the two a-b-c corrective patterns...assuming, of course, the market does not move higher next week. The only problem I see with it is that the current wave pattern allows for an additional high...if, as the second chart above suggests as one possibility, a diagonal triangle top is unfolding. There is no question that this market has been stronger than its technical underpinnings for weeks. The market has frustrated everyone (including me) that has called for an imminent top in the pattern since August 27th. Unlike the trendchannel break that produced the 3-week decline after the August 9th high, this week's trendchannel break (an initial "false" confirmation of a top) was followed immediately by a rally to a new high. I guess we just have to be patient waiting for a final top here. What I don't want to see is all of the market indices together exceeding their April 2010 highs. |
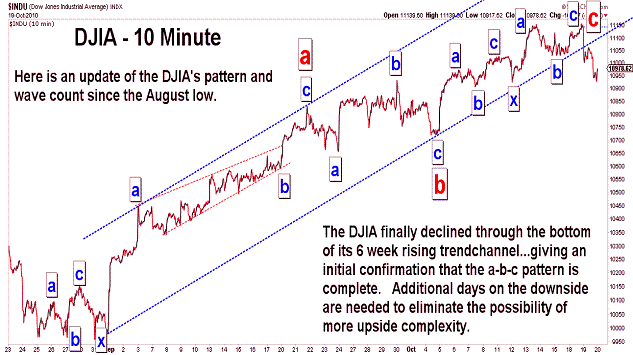
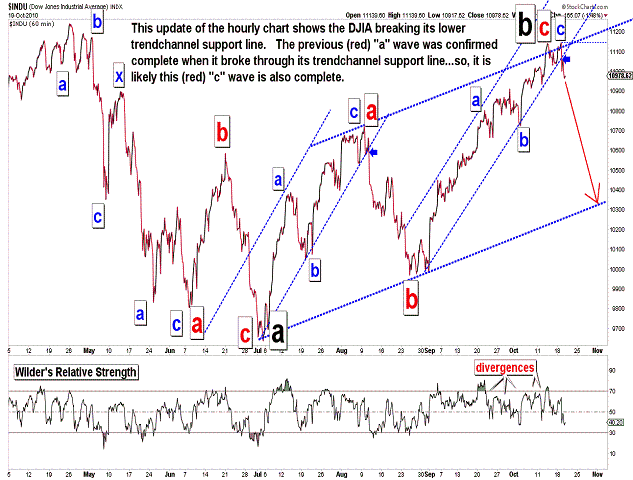
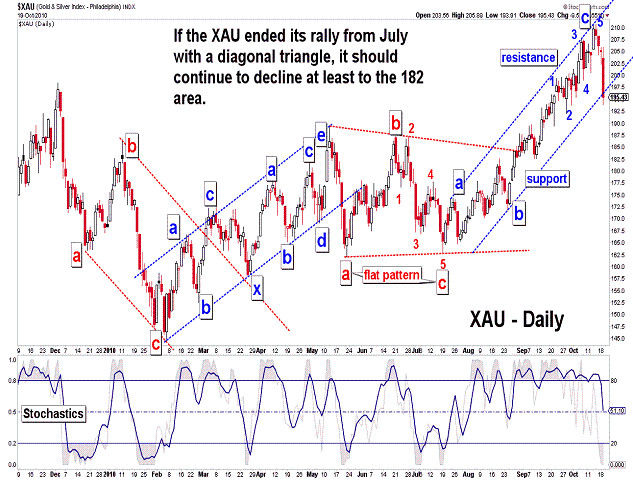
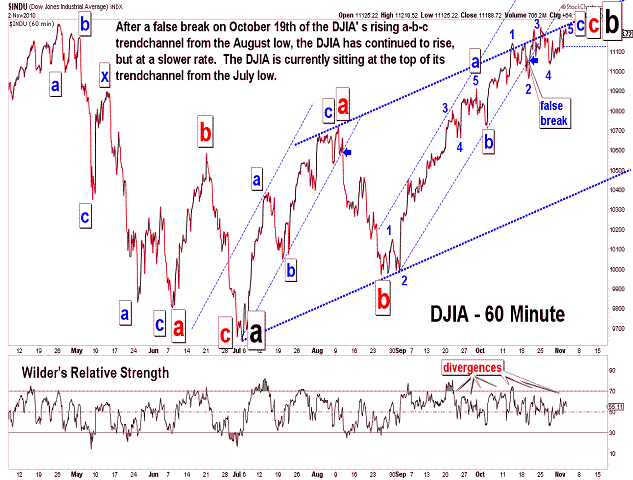
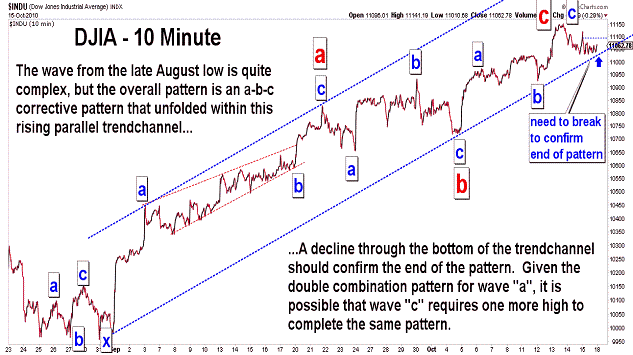
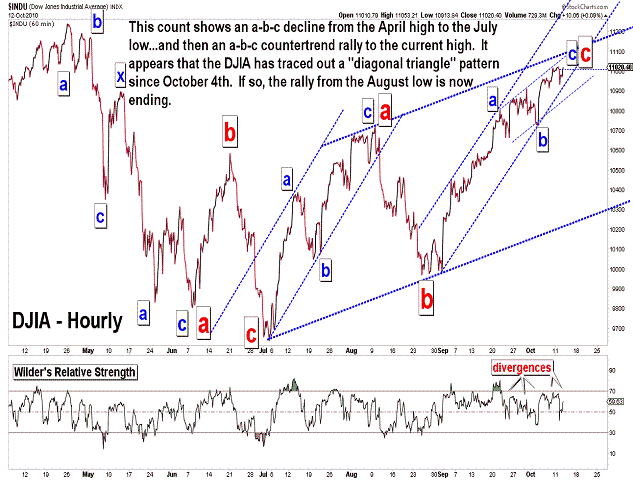
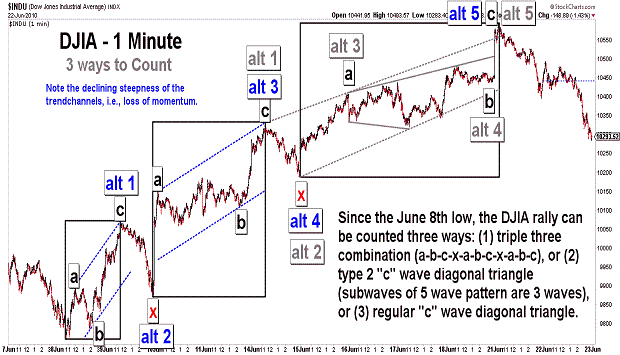
| October 19, 2010 update...Yesterday's new high allowed the DJIA to complete a double combination pattern (a-b-c-x-a-b-c) from the October 4th low. As I said on the DJIA's 10 minute chart last Friday, one more high would allow this "c" wave pattern (as I labeled it) to match up with the double combination pattern for wave "a" (8/25 to 9/21). The entire a-b-c pattern from the August low...as well as the larger a-b-c pattern from the July low can now be counted as complete. Assuming it is complete, a wave "c" (it would be a black "c'" on second chart above) decline should now be getting underway. If this count from the April 2010 high is correct, the decline should eventually take the DJIA well below the July low of 9614. |
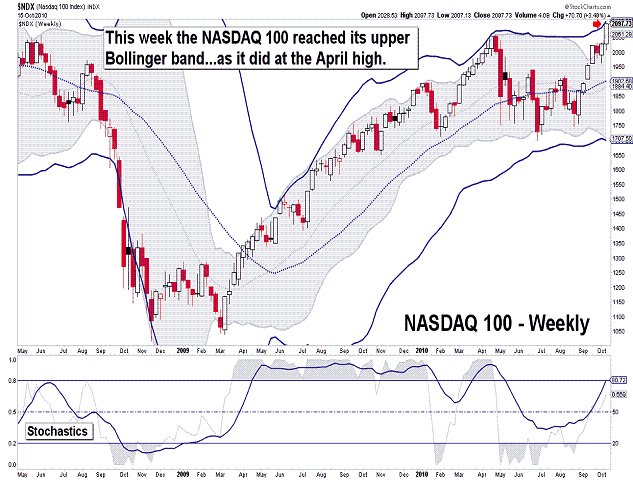
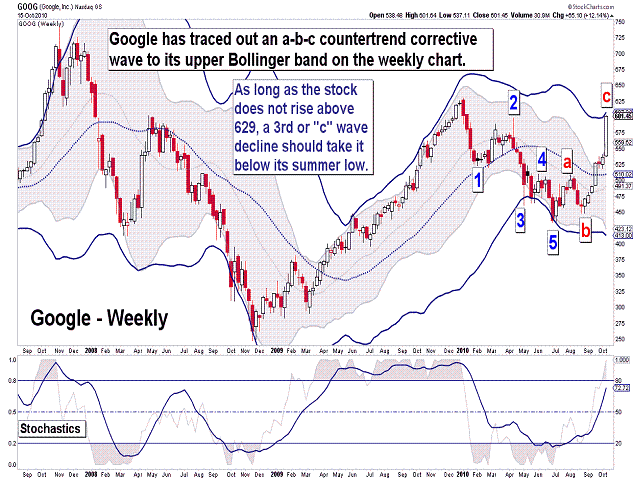
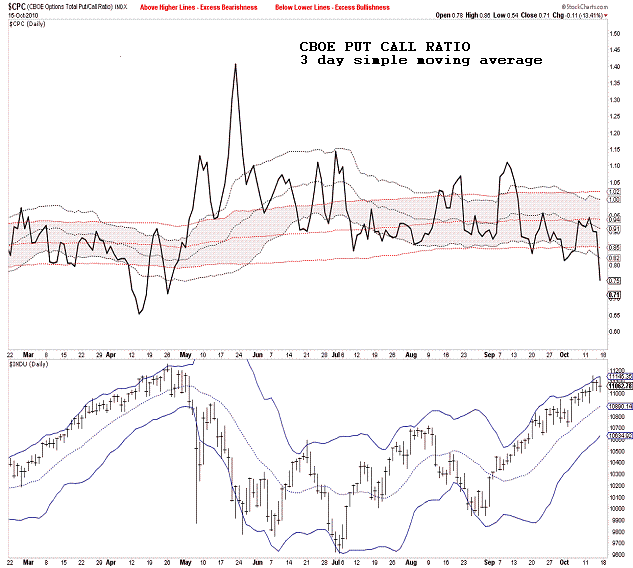
| October 15, 2010 update...On a day when the NASDAQ Composite was up 33 points and the NASDAQ 100 was up even more...43 points, there were almost 100 more declining NASDAQ stocks than advancing stocks. Are the troops finally abandoning the generals? It's no wonder the indices were higher...with GOOG up 11 percent and AAPL up 4 percent. These two stocks alone account for about a quarter of the NDX. I don't know about you, but these 2 stocks don't affect 25 percent of my life. I do use Google's search engine daily, but I have never bought a single Apple product. Obviously, the market doesn't care. So, where are we? As you can see from the charts, the market is at a top using all kinds of traditional technical tools. Market sentiment is finally reaching a point where market tops have occurred in the past. Ten days ago I said in connection with a top that "...I would still like to see at least one day where the put/call ratio falls to .71 or lower (the level on August 23rd)..." because it would give me "...more confidence about the extent of the next decline." Well, today that finally happend (the CBOE put call ratio was excactly .71). Finally, with respect to Fibonacci time cycles, we are entering a period from here to next Friday (it depends on which time interval chart you use) where the length of time from the July low until the current high is 1.618x the length of time from the April high to the July low. If I am right about the wave count labeling, i.e, a "b" wave up following an "a" wave down...that is a common time relationship. We'll see if it works this time. |
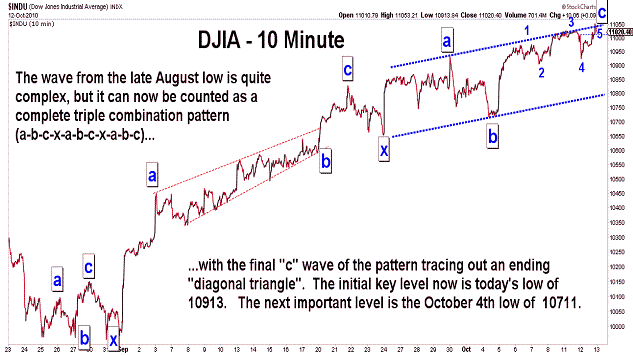
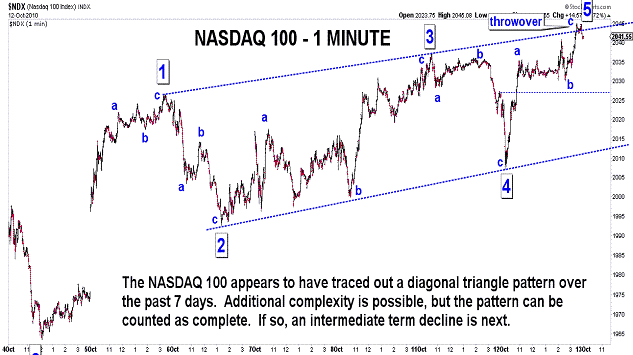
| October 12, 2010 update...The DJIA gained ground the first two days of this week...but, only by a combined total of 13.92 points. For several weeks now, I have discussed the market's weakening technical condition...and that has continued this week. The market's pattern, on the other hand, has unfortunately developed in a way that has left room for various options, extensions and complexities. To date, the market has yet to confirm a top by breaking below the critical levels that I have noted as the rally from the August low has unfolded. But maybe, with this week's action, the market is finally providing a clue that the rally is ending. As you can see in the NDX and DJIA charts above, a clear diagonal triangle topping pattern has formed. Today's low is now the key to this pattern. If that low is quickly broken, then the diagonal triangle pattern is left in place as a top...and an intermediate term decline should be underway. Of course, if the market continues to meander higher, something else is going on...and the pattern will be nullified. Anyway, we should know the outcome of this wave pattern very quickly. |
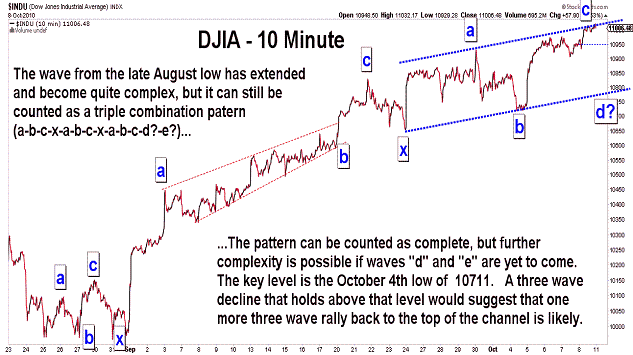
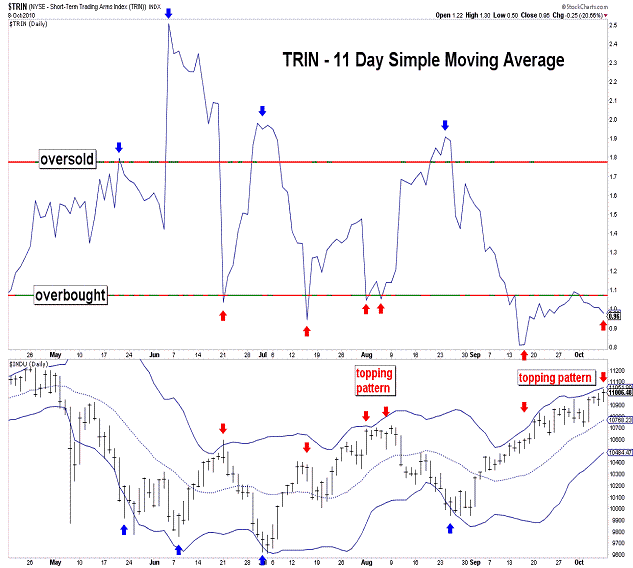
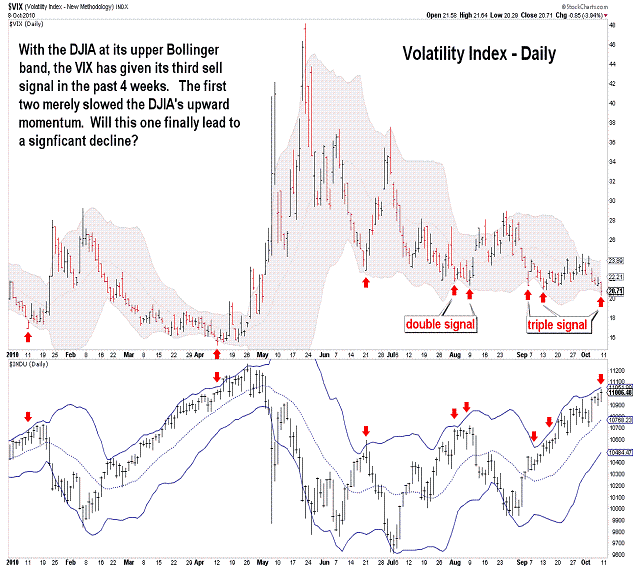
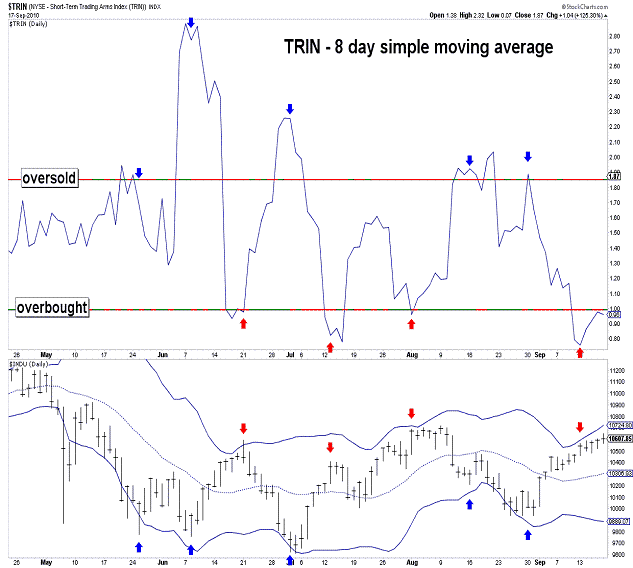
| October 8, 2010 update...After reporting poor employment news, the market did the opposite of what everyone expected...it rallied. It has indeed been frustrating waiting for the market to complete the pattern from the August low...but, the pattern, as I have counted it (a triple combination pattern), has options in terms of extensions and complexity. Comparing the short term patterns of the DJIA, SPX and NDX, a case can be made either: (1) that a top is virutally in place (SPX and DJIA), or (2) that the topping pattern has another week or so to go before completion (NDX and DJIA). The vast majority of technical indicators are in place for a top and various sell signals have previously been triggered (see TRIN and VIX). Market sentiment indicators, however, are a mixed bag and have only given a weak confirmation of the sell signals in effect. So, all we can really do now is wait for the market to tip its hand (the October 4th low is the key). |
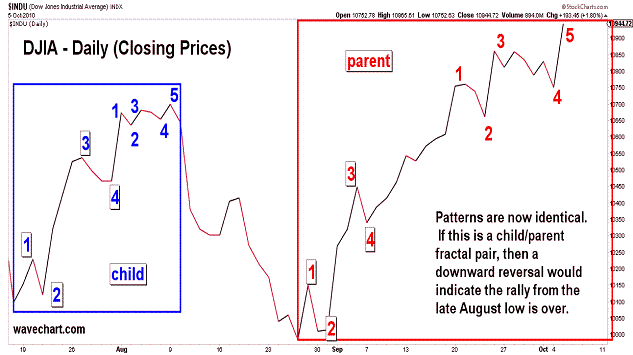
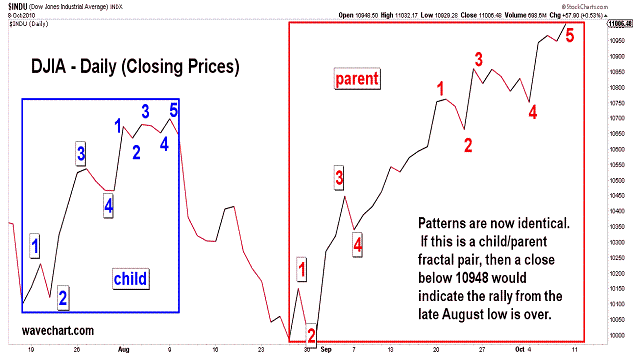
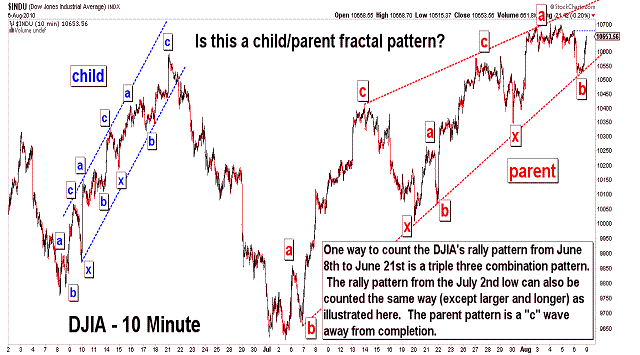
| October 5, 2010 update...Last Friday, I posted the first chart above...showing the unfolding of child/parent fractal pattern since the July low. I said that if "the pattern continues to follow suit, there will be one more closing high above 10860.26 next week". Well, the DJIA fulfilled that requirement today...closing at 10944.72. So, the next step...if the pattern and my wave count are valid...should be a reversal and the start of a wave "c" decline below 10900. The market's technical condition certainly suggests a likely top is in place...but, it is not completely one sided. I would still like to see at least one day where the put/call ratio falls to .71 or lower (the level on August 23rd). It would give me more confidence about the extent of the next decline...but, it is not a requirement. |
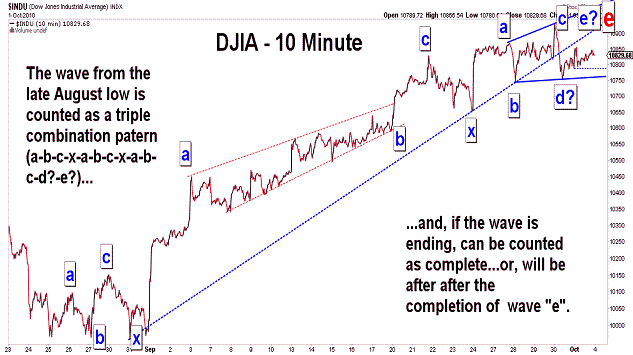
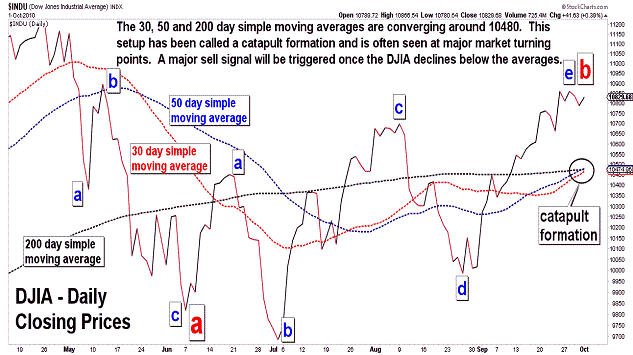
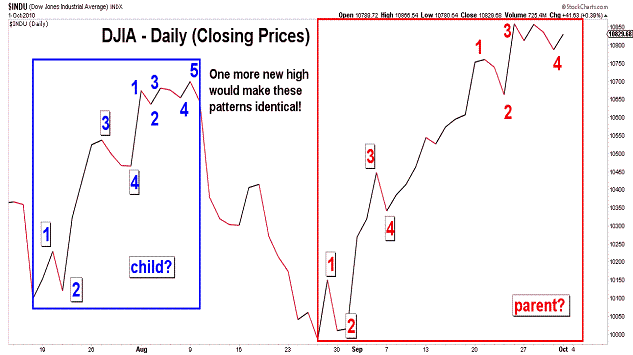
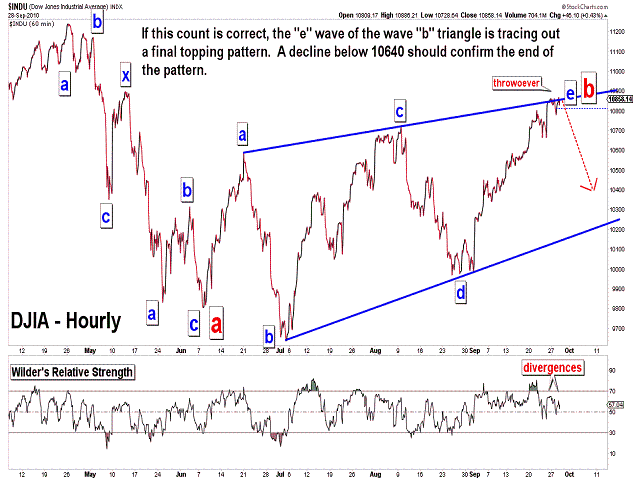
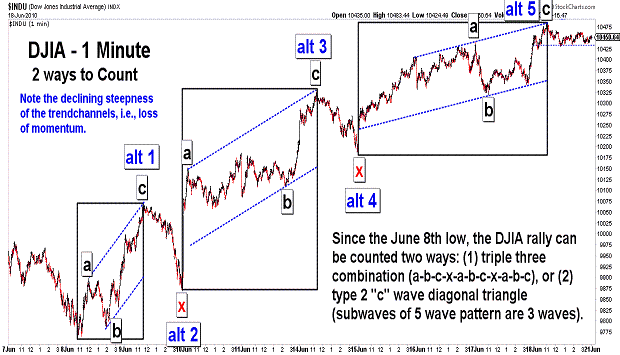
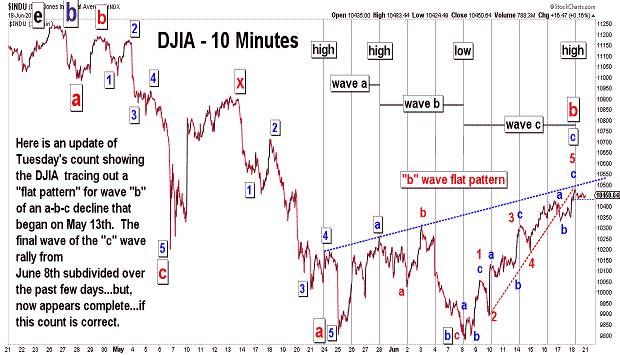
| October 1, 2010 update...Most of the broad indices ended the week modestly lower. The Midcaps and Smallcaps were the notable exceptions. The NASDAQ 100, the strongest indice since the late August lows, was the weakest this week. As you can see in the fourth chart above, the DJIA's pattern (closing basis) since the late August lows is very similar to the DJIA's pattern (closing basis) from July 16th to August 9th. If the pattern continues to follow suit, there will be one more closing high above 10860.26 next week. The July pattern was quickly retraced...with some additional loss beyond that. A similar decline in the DJIA would take it below 9968...and because it would complete the "b" wave triangle pattern since June 8th...it would eventually lead to much lower prices over the weeks/months that follow. One thing that I would like to see in conjuction with a new closing high next week is a very low CBOE put/call ratio...it isn't necessary to confirm a top, but it would be a significant piece "sentimentwise" to add to the other technical indicators suggesting a top. |
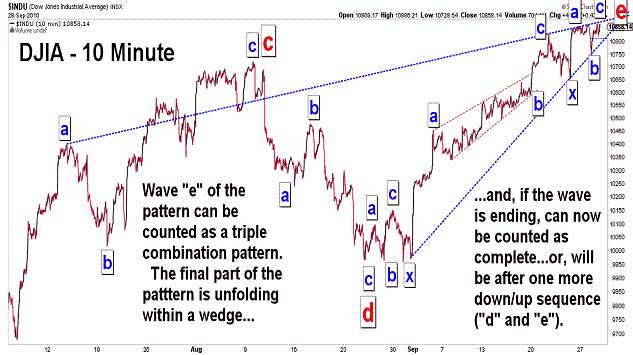
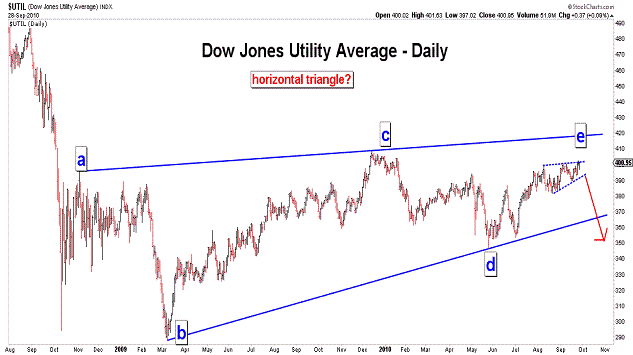
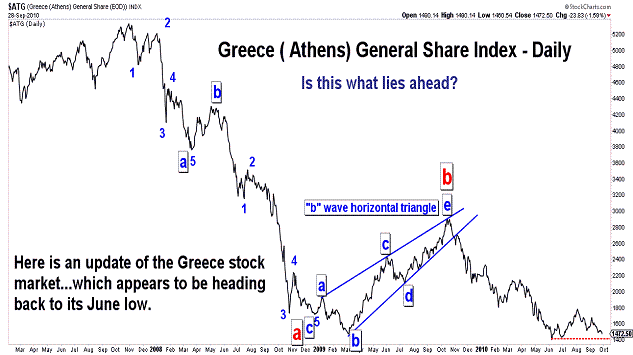
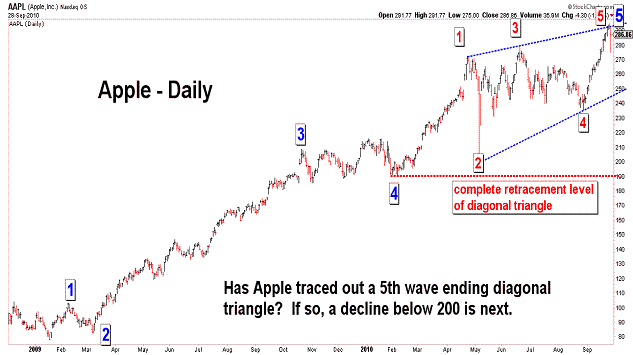
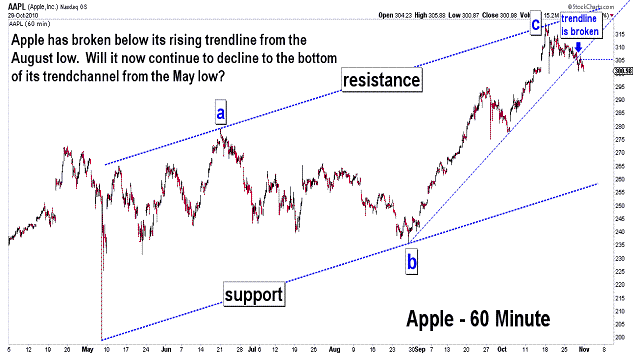
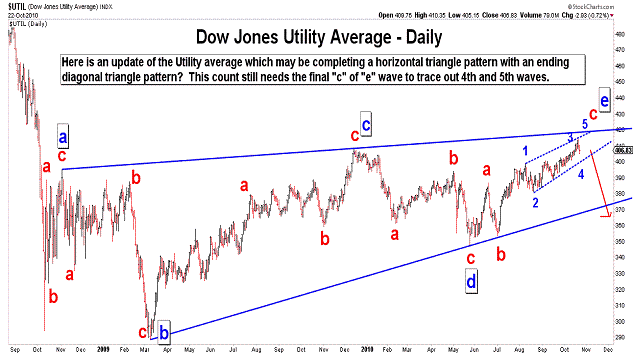
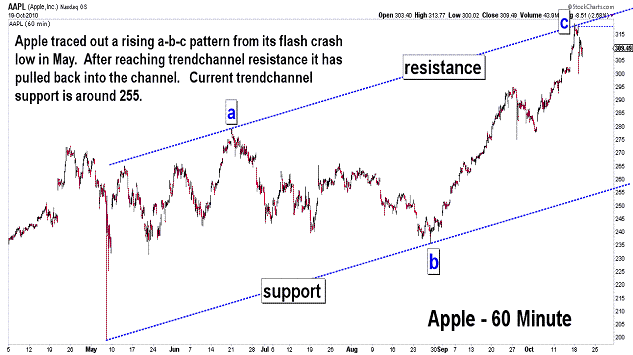
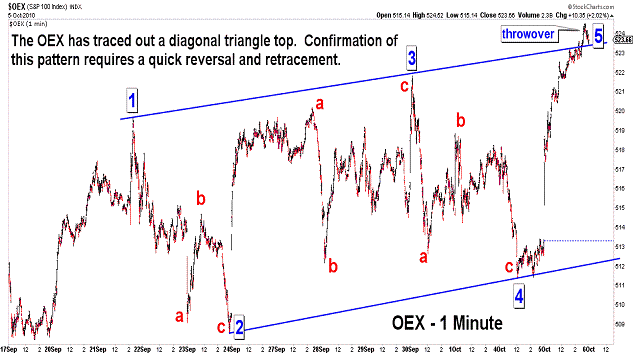
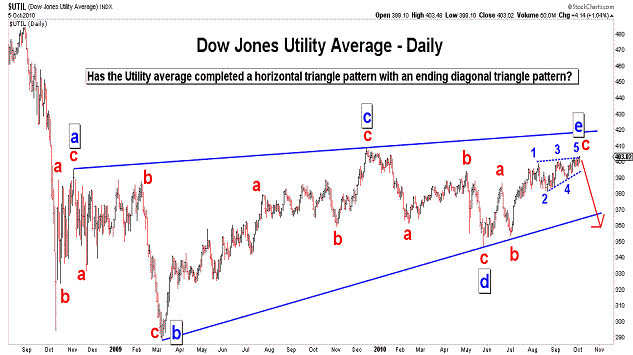
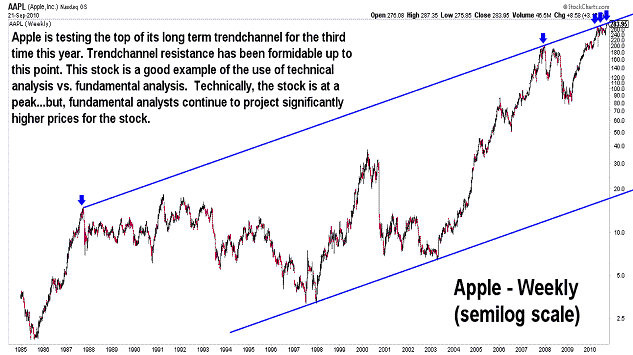
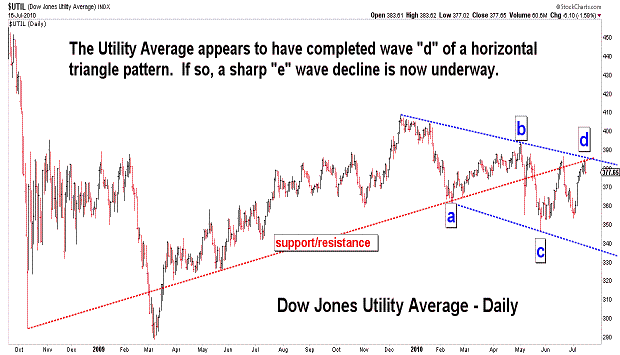
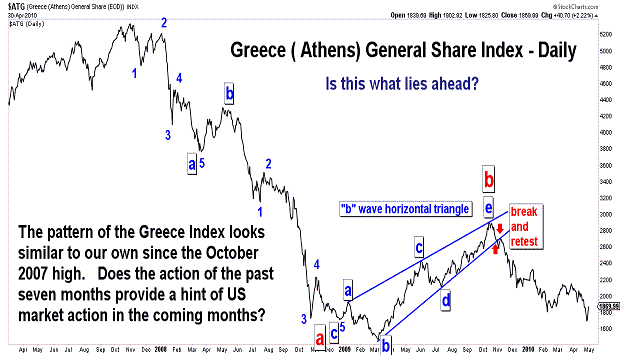
| September 28, 2010 update...Today the DJIA closed 2 points below Friday's high...after making a new intraday high for the third consecutive day. I discussed the possibility of a diagonal triangle top in the last few updates...and, as you can see in the DJIA's 10 minute chart, it may indeed be taking place (note the clear wedge shape of the pattern). A powerful move should emerge at the conclusion of this pattern. The technicals and wave count I am using suggest it will be downward. A resolution of this pattern one way or another should be imminent (barring an extension and added complexity). Tonight, I also posted charts of the Dow Jones Utility Average, Greece's Athens General Share Index and Apple. A case can be made that each of these charts can now be viewed as supporting a signficant decline. We'll see. |
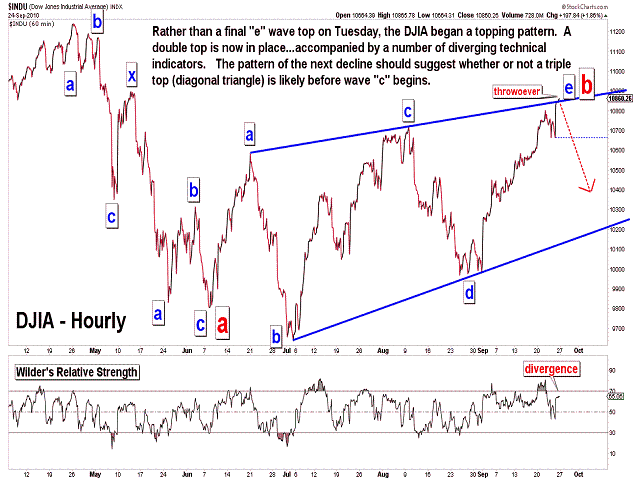
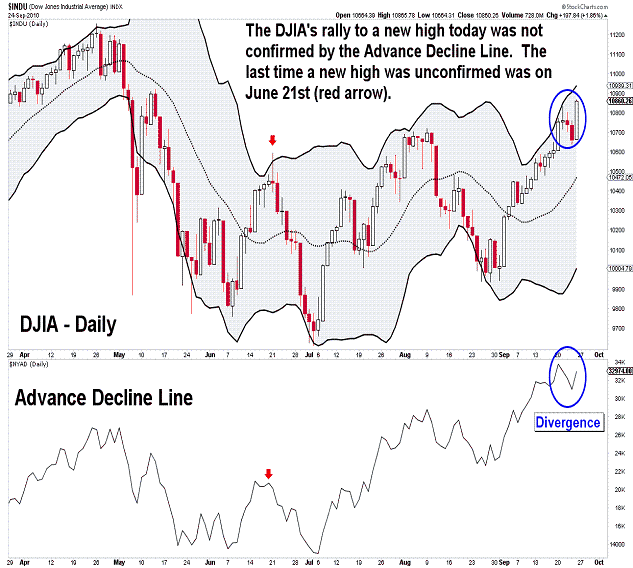
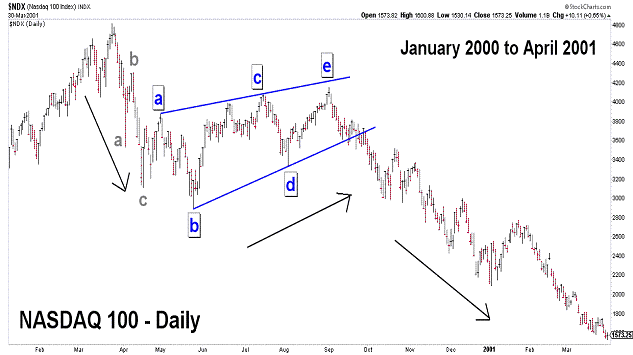
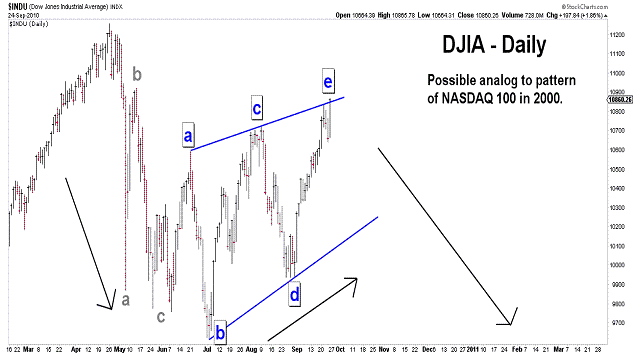
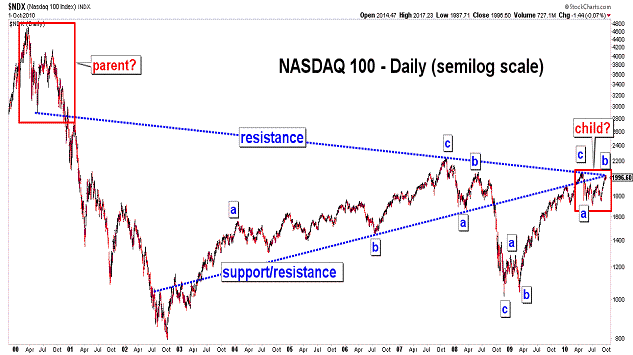
| September 24, 2010 update...After Tuesday's update, the market reversed to the downside...not enough, however, to confirm a trend reversal. Instead of a final top, it was merely the beginning (I believe) of a topping pattern. Most indices today exceeded their earlier week highs...but, there were exceptions (OEX, XMI, RUT, XII, NYSE Advance Decline Line). Price divergences like this are often seen at important turning points. In this case, possibly, it could prove short-lived because it will only require a tiny rally next week to cure the problem. Still, more technical evidence is accumulating than an important top is near. In addition to price divergences among the indices, there are many technical indicators that are not confirming the higher prices. In any event, a short term double top is in place. It will now be necessary to examine the character of the next selloff to determine whether or not it will take a triple top (or diagonal triangle pattern) to complete the topping process. Yesterday's low of 10640 is the key. Finally, I posted a chart of the NASDAQ 100 from January 2000 to April 2001. The pattern of that decline in the NDX from its all time high bears a very strong resemblance to the pattern of the DJIA since its April high this year. If the analog continues, a major multi-month "c" wave decline will soon begin. We'll see. |
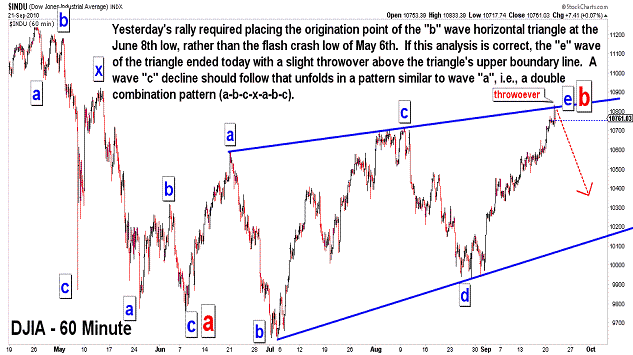
| September 21, 2010 update...As I pointed out on Friday, there is a Fibonacci turn window in play for the first part of this week. That particular time cycle may have had an effect on today's action...which had many characteristics of a reversal day...with many of the broad indices forming "key reversal" patterns (the DJIA was one exception). Please note that there is a slight change in the wave count from Friday's update. Yesterday's strong rally above 10719 required me to relabel the subwaves of the "b" wave horizontal triangle pattern that has been discussed here for a few weeks. Instead of originating after the flash crash of May 6th, the count works best now from the June 8th low. Of course, in order for the count to be valid, the market must reverse lower from here (or, alternatively at a minimum, trace out a small diagonal triangle topping pattern). If the market holds up much beyond next week, I would have serious doubts about this count. Initial confirmation that a significant selloff is underway will be a decline below last Friday's close of 10607. |
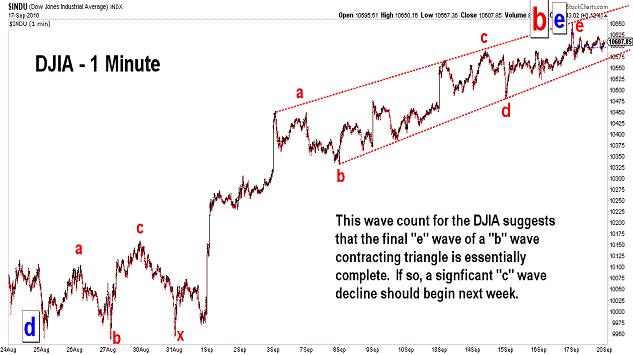
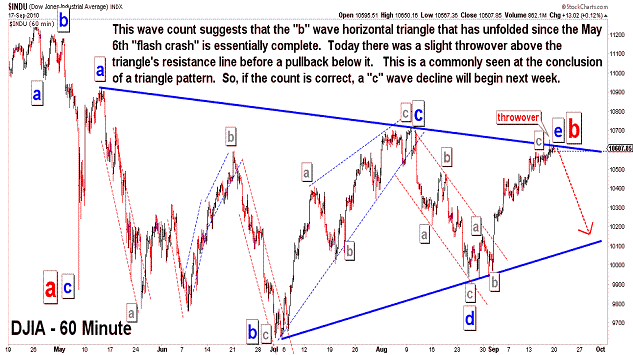
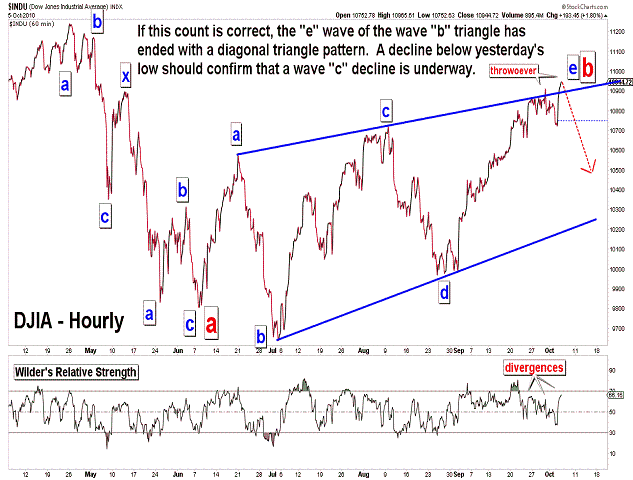
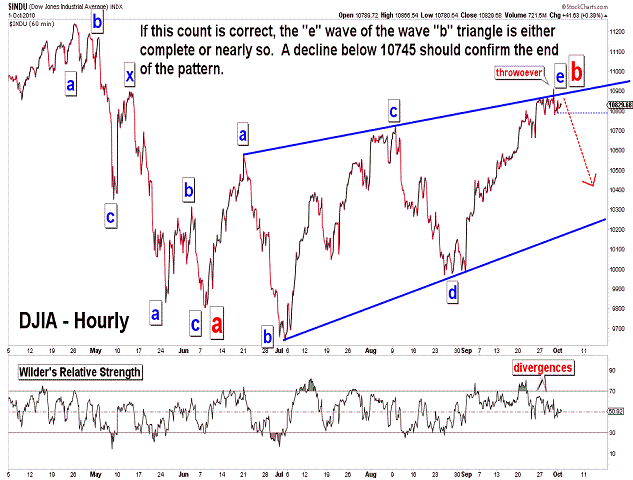
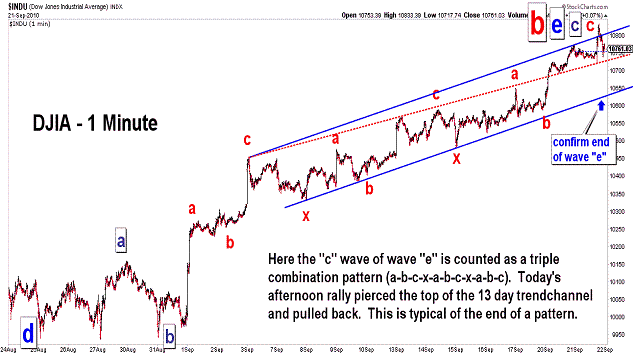
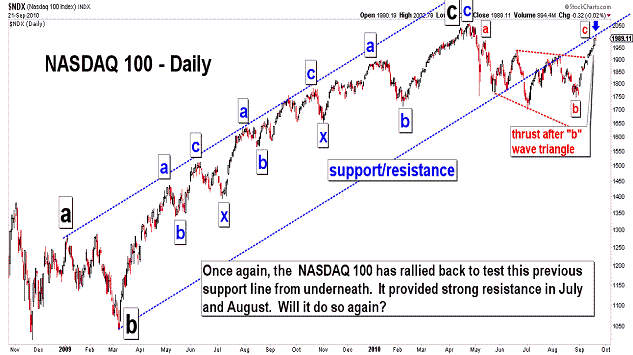
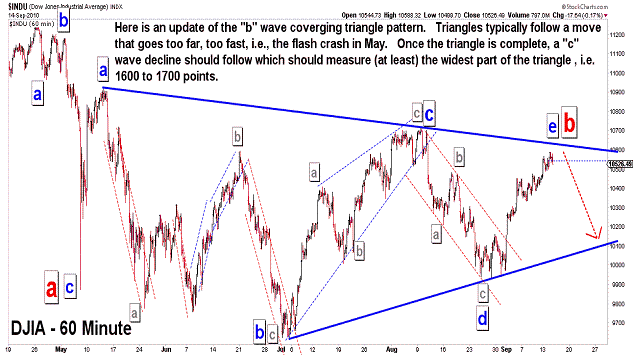
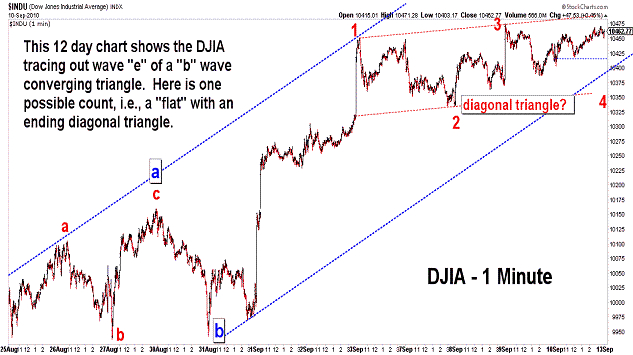
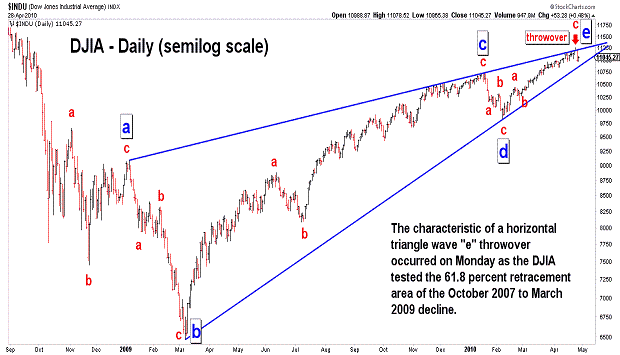
| September 17, 2010 update...In recent updates, I have discussed the formation of a "b" wave converging triangle since the May 6th "flash crash". Well, the validity of that wave count will now be put to the test. The three most important elements of Elliott wave analysis, i.e, price, pattern and time, are now aligned. Pattern: the horizonal triangle pattern appears to be complete (or nearly so). There was an "e" wave throwover this morning...which is very common at the end of a triangle pattern. Price: the 61.8 percent retracement area (106130) of the April 26th high to July 2nd low range was successfully tested. Time: on the Fibonacci daily chart, Monday will be the 144th day since the April 26th high (also 89th day since June 21st high). Interestingly, there was a 144 day period that preceeded the March 2009 low...which began at the October 2008 "crash" low. If there is some type of "symbiotic" relationship between these periods, can we expect "crash" type action to follow the current 144 day period? We'll see! |
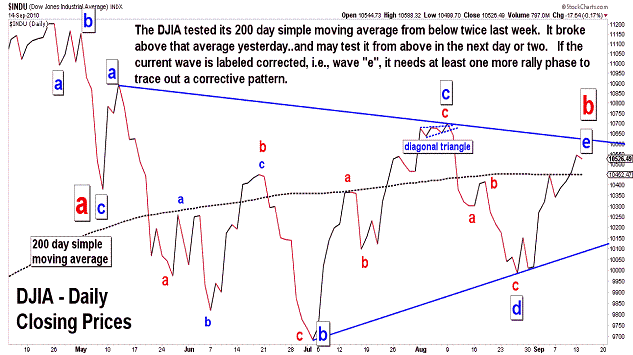
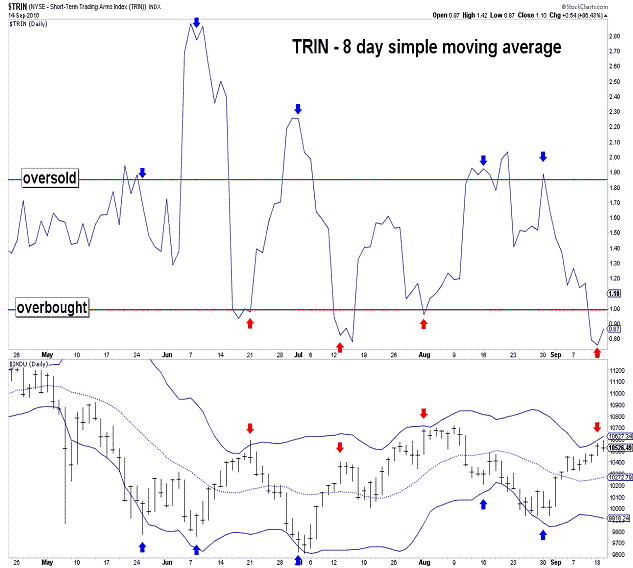
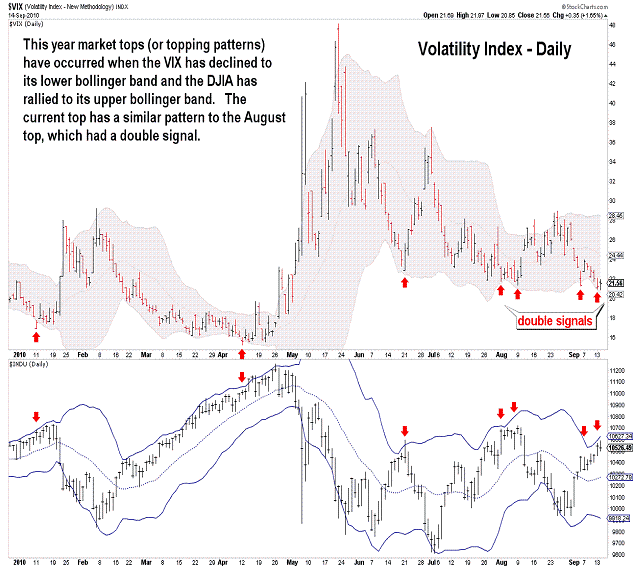
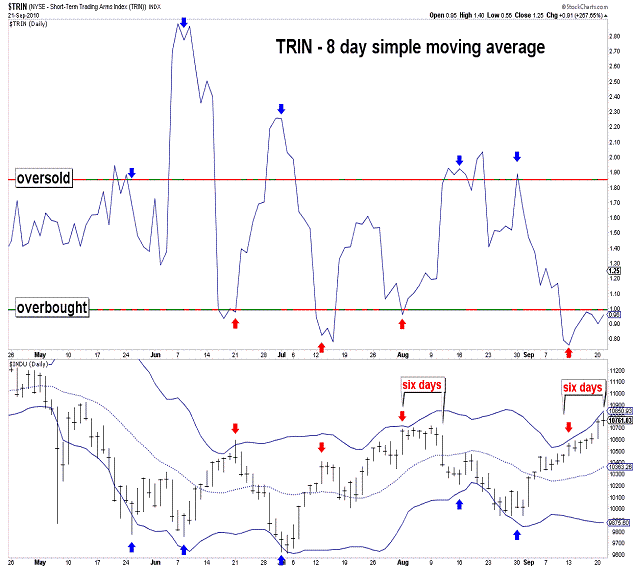
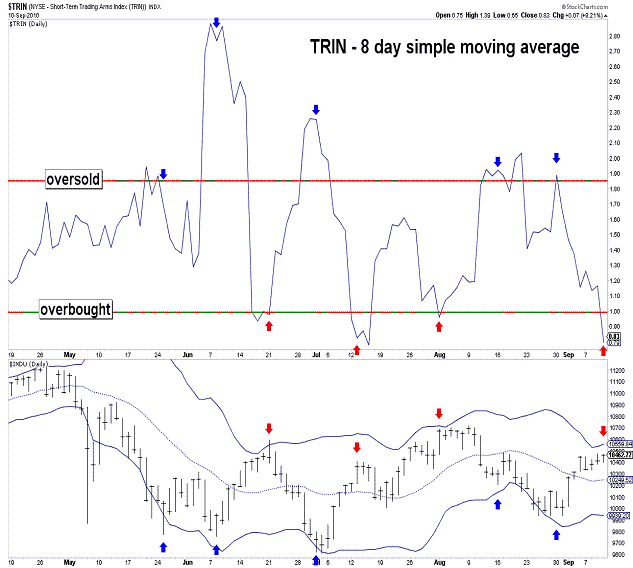
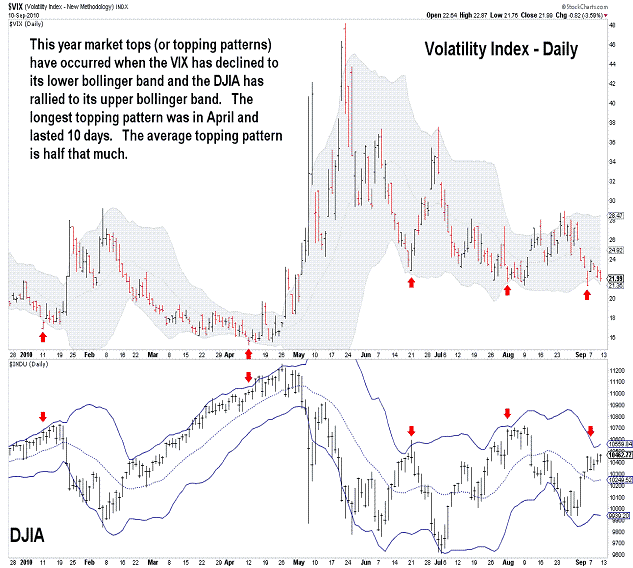
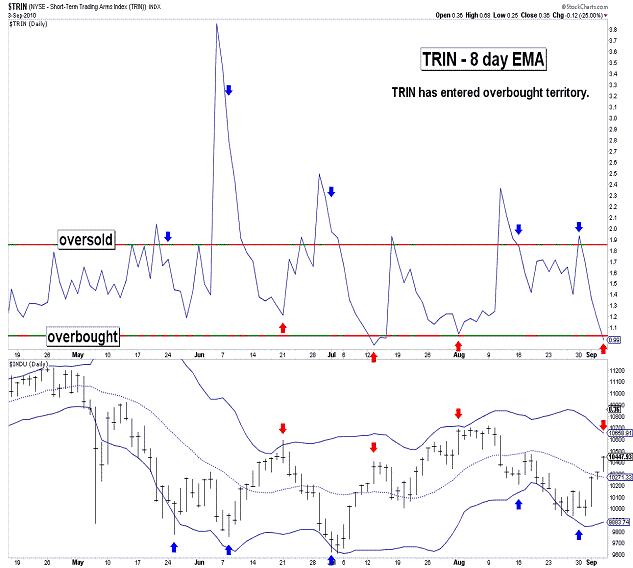
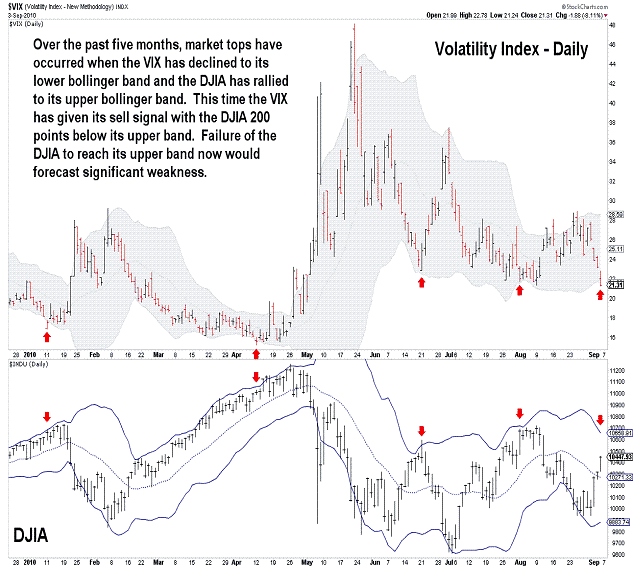
| September 13, 2010 update...There is not much to say since Friday's update. Tonight's charts simply update the charts that were posted on Friday. As you can see, the "b" wave triangle wave count remains the same (although wave "e" is slightly altered). The two technical indicators (TRIN and VIX) are still in "sell" territory, perhaps even more so. With respect to Friday's comment about the put/call ratios...the CBOE equity put/call ratio has moved to a level that has coincided with some recent tops...but, not so for the CBOE total put/call ratio. This could be an indication of some near term weakness before a final rally and top soon thereafter. We'll see. |
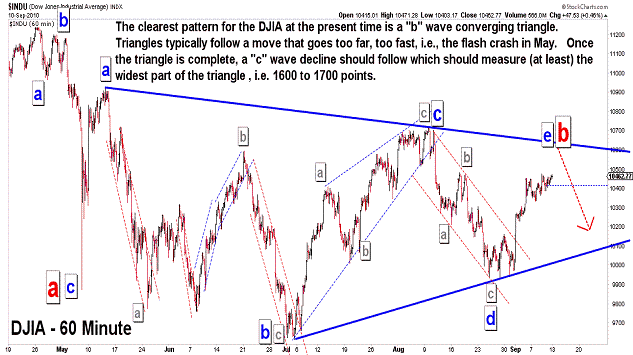
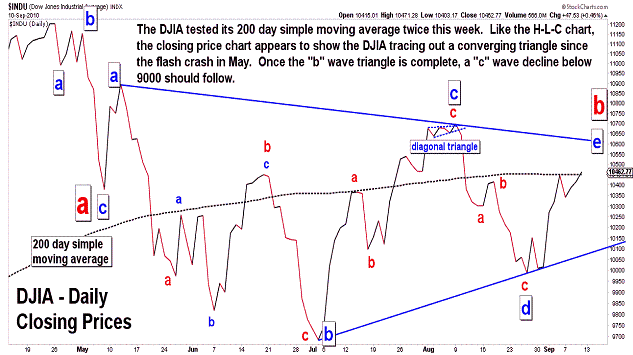
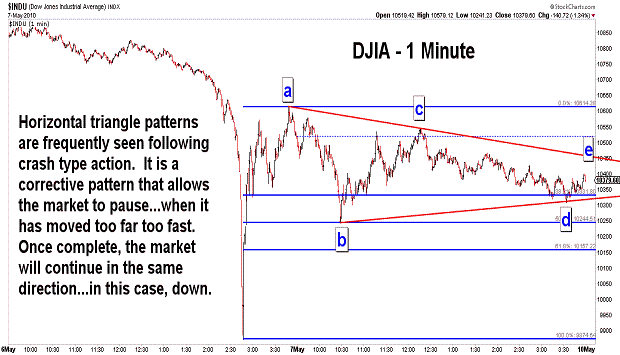
| September 10, 2010 update...Last week's strong gain in the DJIA was followed this week by a nominal 15 point gain. The NASDAQ provided relatively stronger gains for most of the week. Last week, in one of my charts, I speculated about the possibility of a triangle wave count if wave "b" was not complete at the August 9th high. I think the time has finally come to consider that count the best fit to the market's action since the flash crash on May 6th. And, actually there is some logic to this count. Triangles typically follow market action that moves too far...too fast. That certainly happened on May 6th. But, who would have guessed that it would take more than four months of sideways action to correct that one day of immense volatility? If this "b" wave horizontal triangle count is correct, then the final "e" wave is unfolding...and it should be complete shortly. Once complete, wave "c" will unfold...and it should take the DJIA (at least) 1600 to 1700 points lower (the approximate distance of the widest part of the triangle). More technical indicators this week moved toward an overbought condition...setting up (or confirming) the likelihood of a near term top. One exception is the put/call ratio. I am not sure why, but the put/call ratio has been giving some poor signals lately. We won't have to wait too long to find out if this another one! |
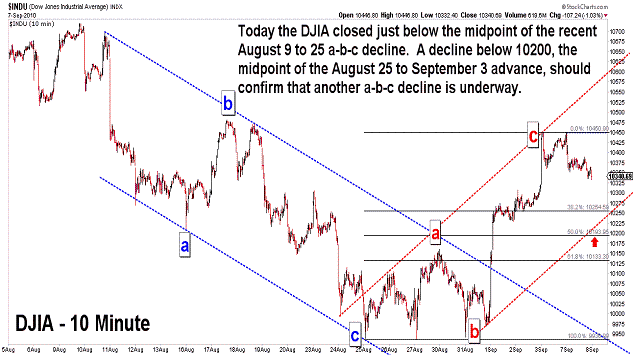
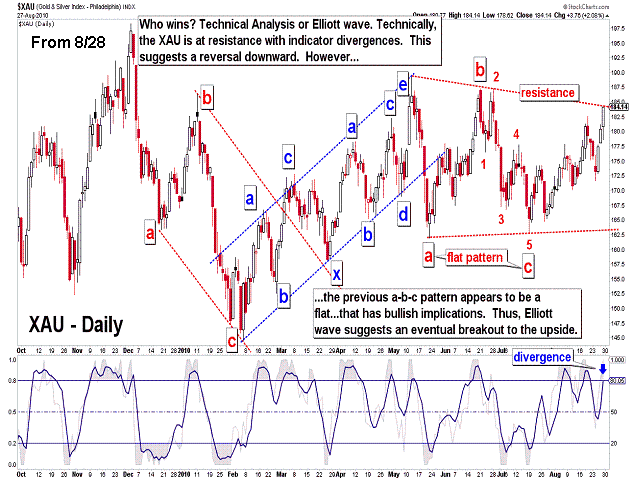
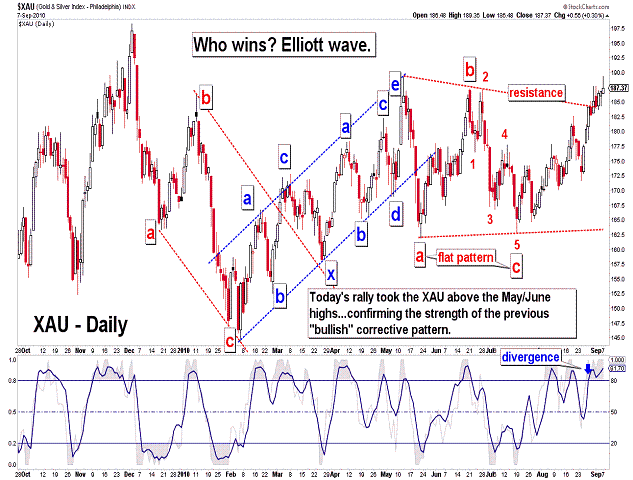
| September 7, 2010 update...Today's triple digit decline brought the DJIA back to the midpoint of its recent August 9th to August 25th a-b-c decline. The rally of August 25th to September 3rd can be counted as a complete countertrend a-b-c pattern. A close below 10200 would likely confirm that another a-b-c decline is underway...and it should challenge the July lows around 9600. XAU update: I posted a chart of the XAU on August 28th that illustrated an interesting "conflict" between technical analysis and Elliott wave analysis (second chart above)...regarding the index's near term direction, i.e., reversal or breakout. We now have a "winner"...it is Elliott wave (third chart above). |
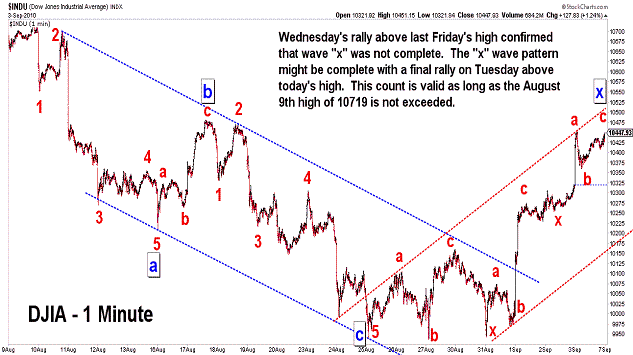
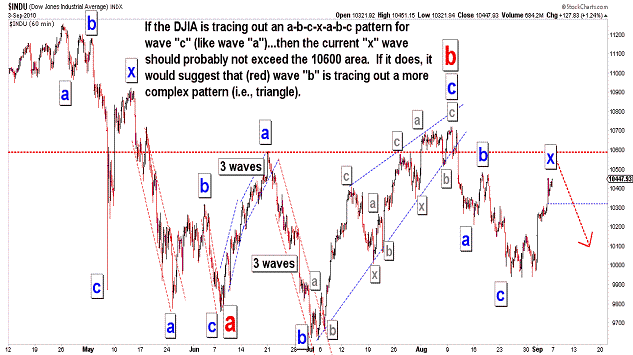
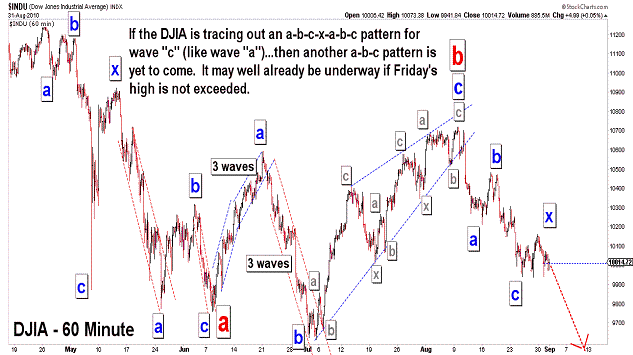
| September 3, 2010 update...Market declines on Monday and Tuesday proved to be a false indication of short term weakness...as the the DJIA closed up each day thereafter...ending 3 percent higher for the week. Wednesday morning's rally cut right through last Friday's high indicating that my wave "x" count was incomplete (see first chart above)...and that the wave "x" pattern continued to unfold today. The strength of the rally has opened the door for some alternate wave counts, especially if the 10600 area is exceeded. Technically, the market is not yet overbought (also there are no serious divergences to report)...but some of the short term technicals are suggesting that, at a minimum, a topping pattern could begin from here. Sepember is typically one of the weakest months of the year...so, we'll see if history weighs in the holday-shortened action next week. Personal Note: I appolgize for the lateness of today's update. I finished my radiation treatments on Wednesday...so that, at least, is one thing off of my plate...hopefully...for the rest of my life (unending doctor visits are another story). Completely unrelated to that, a former colleague of mine in the legal profession recently asked me to assist him with some time sensitive legal work...so, I have been getting back to my office rather late. I am keeping my eye on the market during the day...but, I will have to do my stock market analysis later in the evening. As a result, some updates may, from time to time, be posted closer to 10-11pm. Thanks for your understanding. |
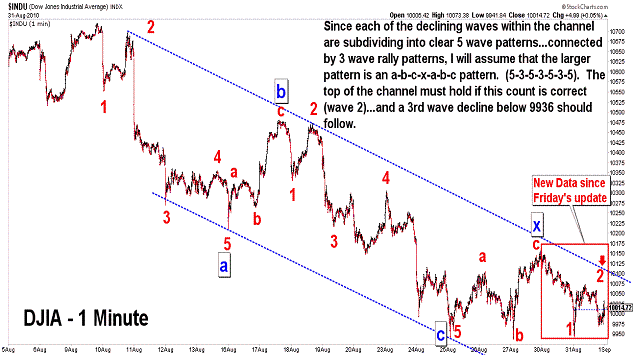
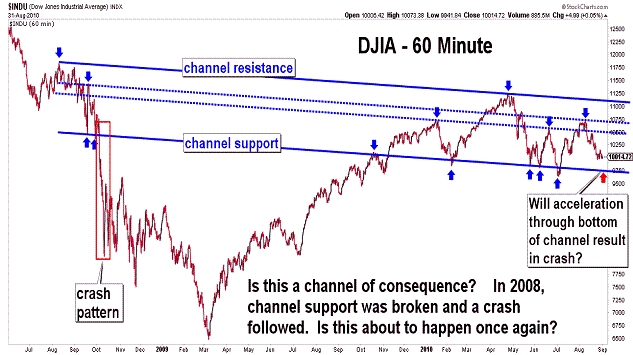
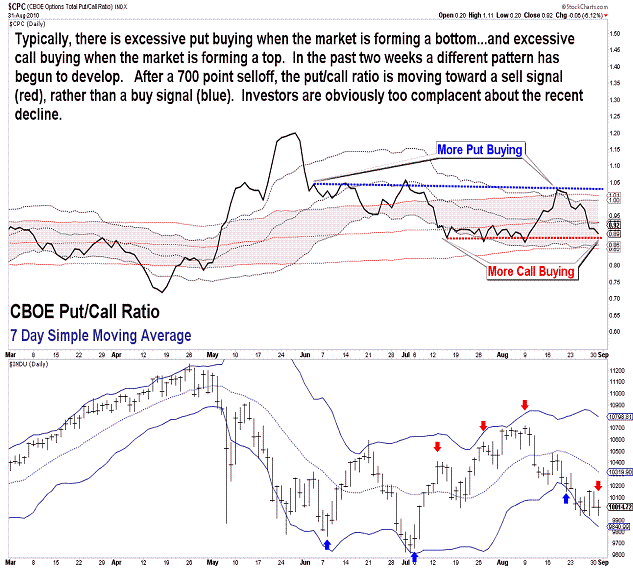
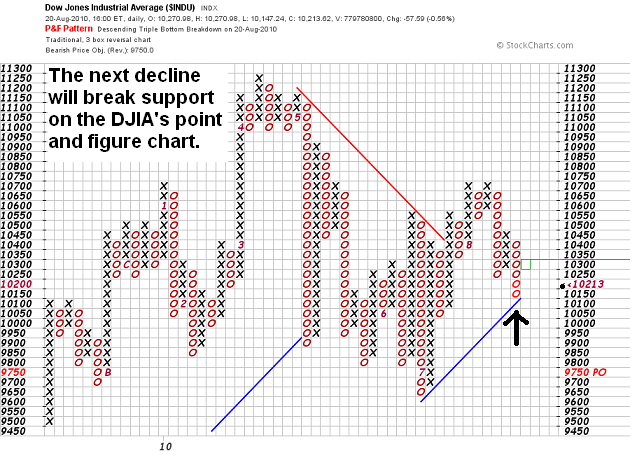
| August 31, 2010 update...Yesterday, the market gave back most of Friday's rally...indicating that cyclical and seasonal downward forces are in force and still developing. Today's early selloff and recovery was, I think, just a maneuver by the bears to provide a small bit of hope for the bulls. It is/was needed to set up the eventual "crash" pattern that will slice right through the four month lows (see third chart above). This can also be seen in market sentiment measurements, like the put/call ratio, which shows a complacency among investors toward the market going forward. The next important test should come when the DJIA drops another 2 to 3 percent from here. |
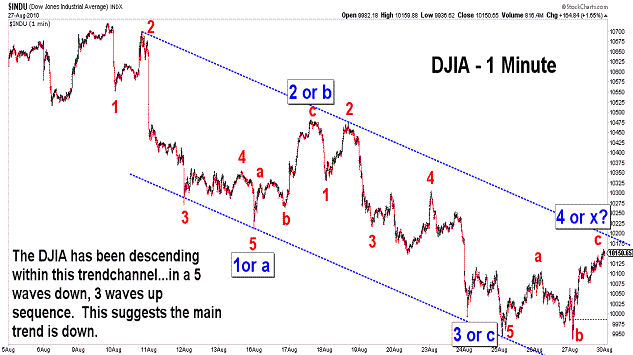
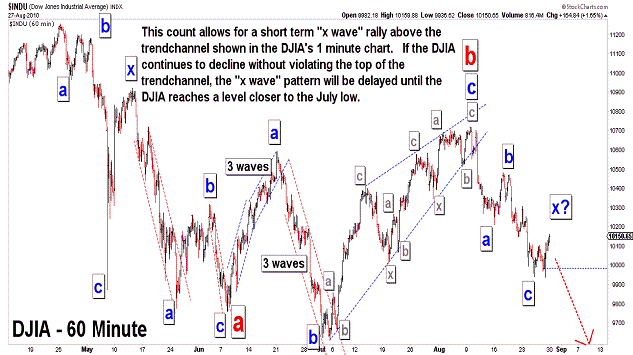
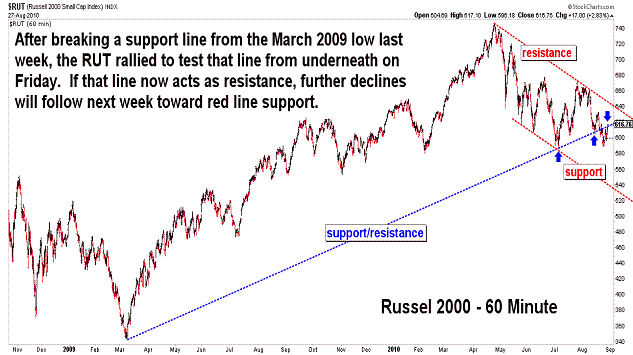
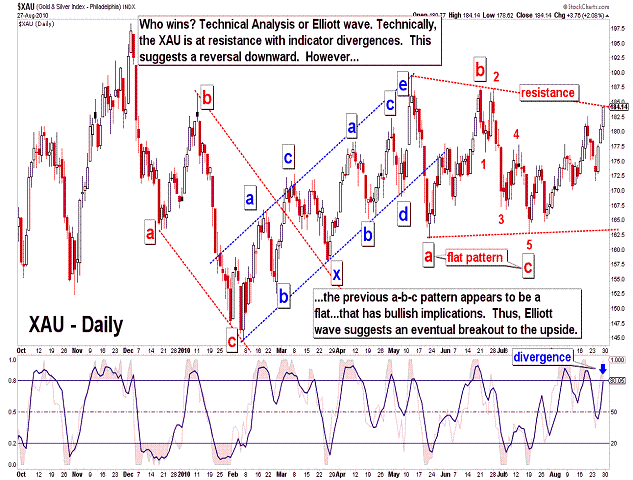
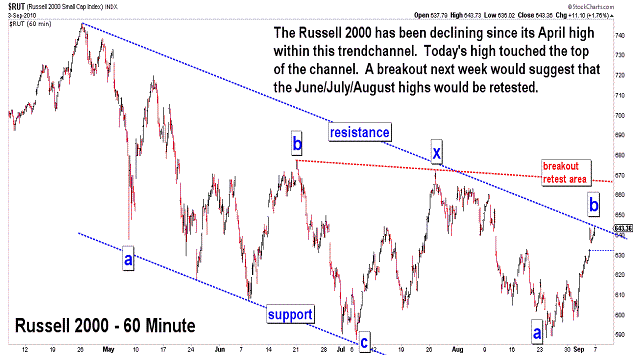
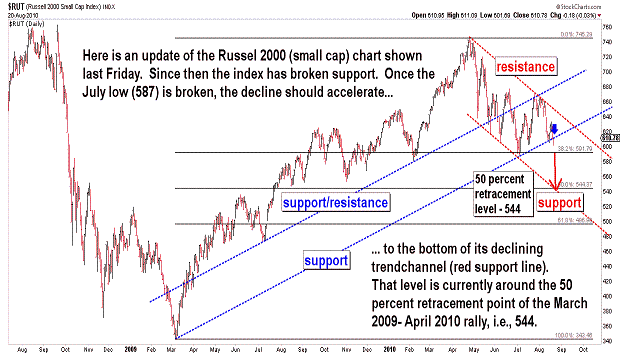
| August 28, 2010 update...Despite Friday's strong rally, the market was generally down for the week. One apparent expection was the small caps. They have been relatively weaker than the rest of the broad averages for the past month...so, I guess they were due for a good bounce. But, take a look at the Russell 2000 chart above. The RUT broke a support line from the March 2009 low last week...and yesterday it rallied to test that line from underneath. Whether or not that line is now strong resistance will be determined by what the index does next week. In terms of the DJIA, there are some short term options. The average has been declining perfectly within a trendchannel since the August 9th high. If the rally ends at the top of the channel, then a test of the July lows is next. If that line is exceeded, the wave count would suggest that some kind of "x" wave corrective pattern is underway that could last until the short term indicators return to an "overbought" condition. While I don't often post the XAU chart, I thought it posed an interesting technical analysis vs. Elliott wave analysis dilema. Techncially, the index appears ready for a reversal to the downside. However, from an Elliott wave viewpoint, its most recent downward corrective pattern was a bullish "flat" (3-3-5). That would imply that the current upward pattern should exceed its June high. We'll see. |
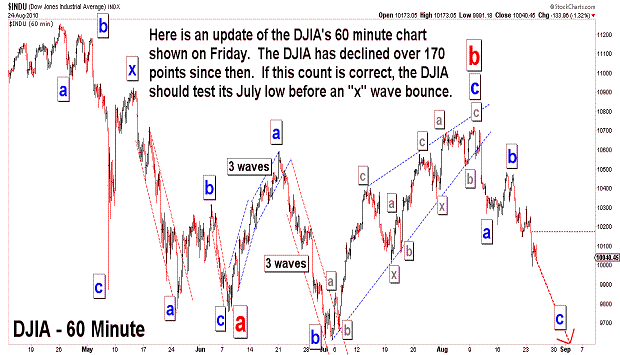
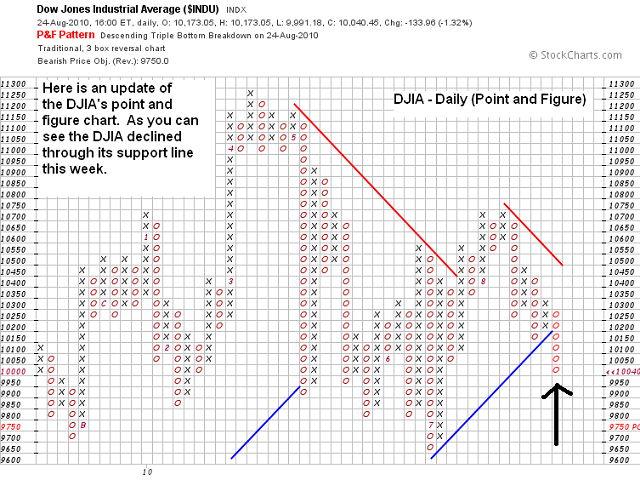
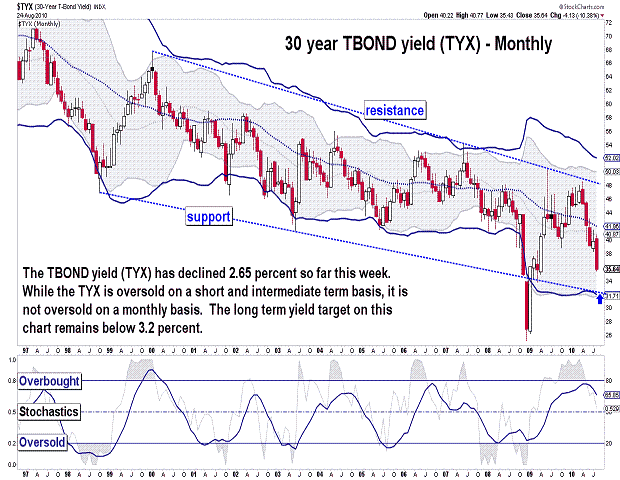
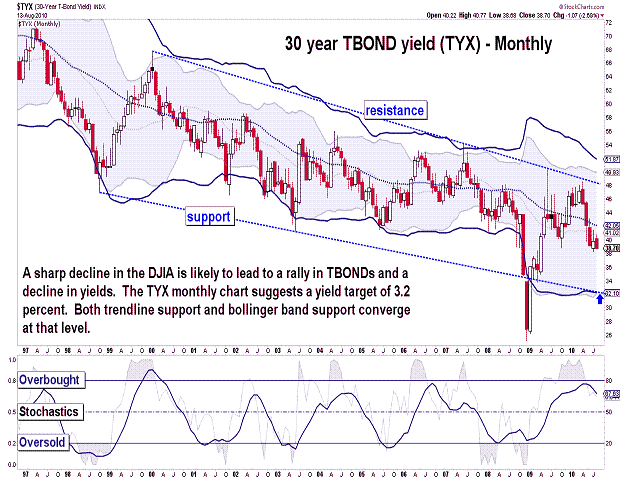
| August 24, 2010 update...The DJIA has lost 1.7 percent already this week; the NASDAQ even more...above 2.5 percent; all the while, long term bonds are soaring in price as yields continue to decline. Of late, each reported economic number disappoints...today it was housing. The DJIA's pattern suggests a test of the July low is coming...then a possible bounce...and finally a waterfall decline below 9000. No guaratees, of course. My work continues to suggest a declining pattern well into next year...with a test of the October 2008 lows, at a minimum...7800. If you missed this interview on CBNC today with Charles Nenner, take a look. |
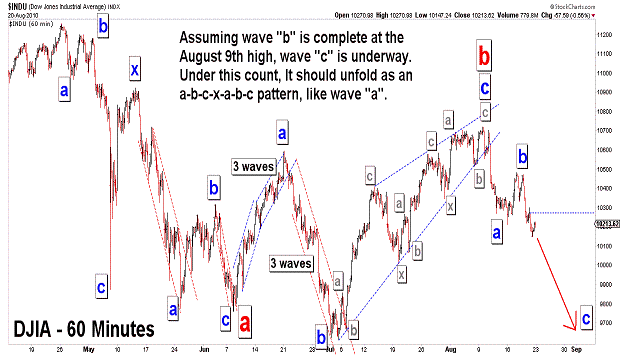
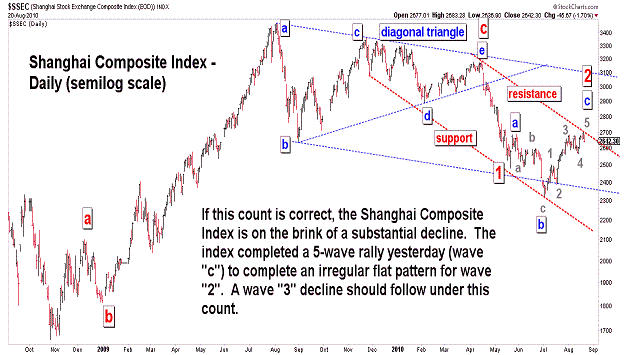
| August 20, 2010 update...The DJIA lost almost 1 percent for the week...while most of the other indices ended nominally higher or lower. The question now is this: are all of the upward corrective patterns complete and is the market finally ready to begin the next downward phase of its intermediate term decline? While most of the recent corrective patterns among the various indices can, arguably, be counted as complete...Elliott wave rules and guidelines allow for extensions and additional complexity. The fly in the ointment now (and my present concern) is that some of the short term indicators are oversold and the put/call ratios are in a range where, during the past year, rallies have occurred. So, the market is certainly not at a point where everything is one-sided and lined up for a sure-thing mega-decline. The one index that does show a complete classic Elliott wave corrective pattern is the Shanghai index (see last chart above). The recent rally was a 5 wave "c" wave ending at the top of a perfectly formed declining trendchannel. That "c" wave is part of a bearish irregular wave "2" flat pattern that developed in model fashion across the trendchannel. Wave 3 should be next...but, a sizeable down day is needed next week to confirm it. Check this index before the US markets open next week. It might just provide the signal that the bear market is back in full gear. |
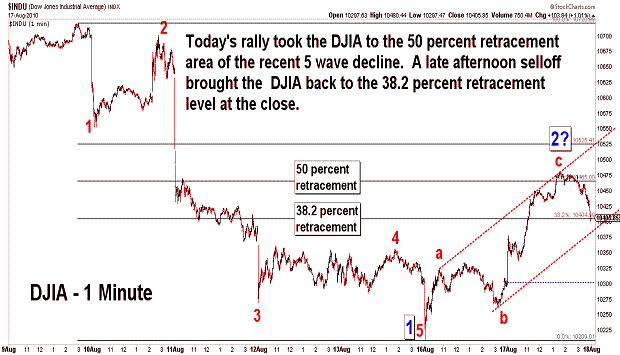
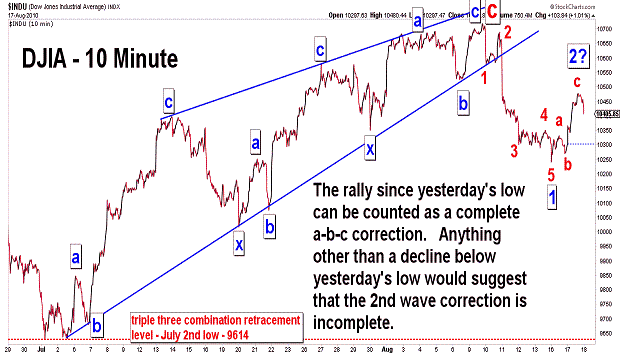
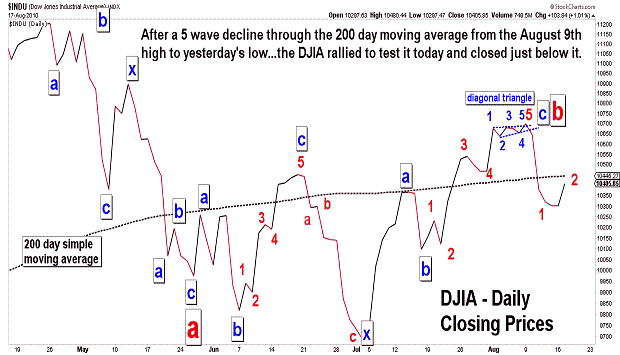
| August 17, 2010 update...Today I finished day 20 of 31 radiation treatments...and the treatments, combined with the medication I am taking, leaves me sleepy all day long. The market action this week has done nothing to energize me...yet (I think a powerful wave 3 decline pill would do it!). The DJIA completed a 5- wave decline yesterday morning (wave 1)...and has sinced traced out an a-b-c corrective pattern (wave 2?). Today's intraday high was in the vicinity of the 50 percent retracement point of the recent decline...and the DJIA' s closing price was right on the 38.2 percent retracement point. If the upward correction is complete, a wave 3 decline is next. Anything short of an immediate decline below yesterday's low would suggest that the wave 2 corrective action is not complete. I think we should know by tomorrow. |
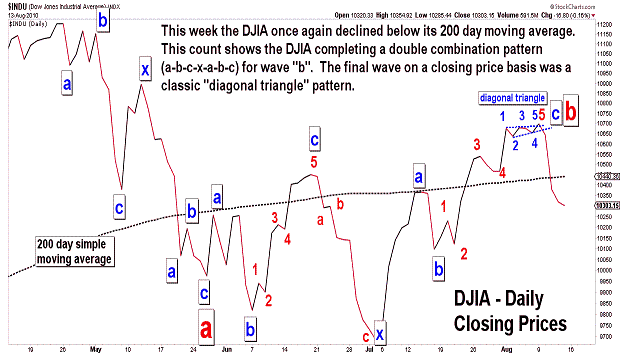
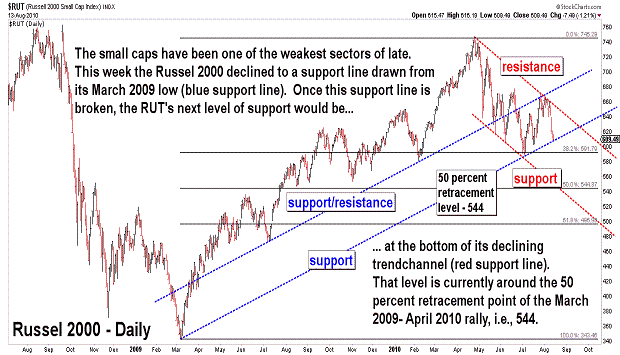
| August 13, 2010 update...My ideal scenario from Tuesday's update did not play out when the DJIA sliced right through the 10551 and 10515 levels on Wednesday...confirming the completion of the July-August rally (these confirmation levels were provided in Tuesday's charts). Both wave counts previously shown (see first and second charts above) remain valid...and have similar outcomes. If the intermediate term "c" wave decline is now, in fact, underway...the DJIA must continue to decline in the coming weeks. Taking out the July 20th low and then the July 2nd low are the next objectives. Two weeks ago in the July 30th upate, I showed a chart of the DJIA's "b" wave triangle pattern and suggested that the market was likely to turn when the triangle formed its apex. Argueably, the apex formed on Monday...and from there the market reversed course and headed south. For the week, the DJIA lost over 3 percent, the NASDAQ over 4 percent...and the extemely weak small caps (RUT) over 6 percent. As you can see in the Russell 2000 chart above, the RUT declined to a support line extending from the March 2009 low. Breaking that line will be another confirmation of much lower prices. For months now there has been much discussion in the press about the likelyhood of a double dip recession. I have long been in the camp that believes a double dip recession is a done deal given the extremely bearish stock market patterns that I see. Another reason for that is the high unemployment rate (see David Rosenberg: Forget The Unemployment Rate, Here's Some Ugly Jobs Data You Probably Missed This Week). I only have to look at my own family's experience with unemployment (two of my children have been trying to get jobs for more than one year)...to see that we are a long way off from the beginning of long term improvements in the economy. |
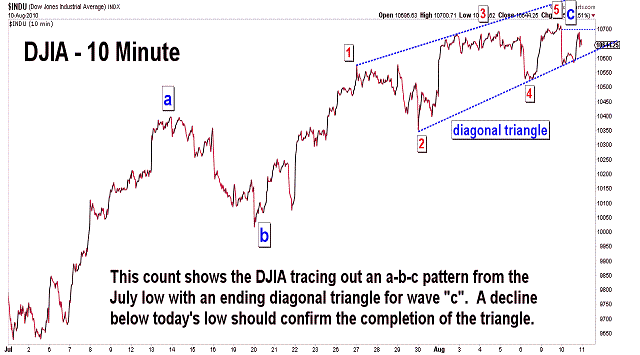
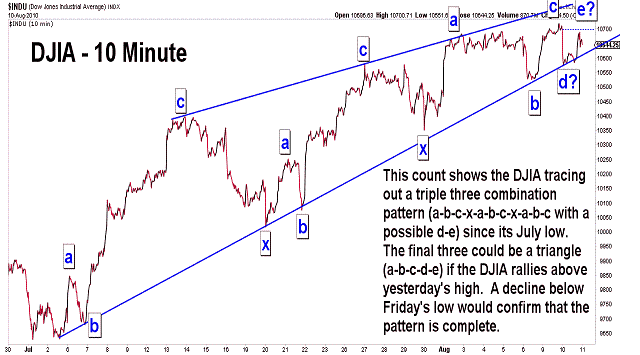
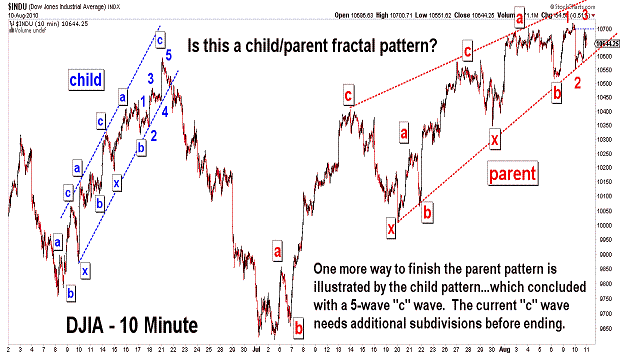
| August 10, 2010 update...As I stare at the DJIA's current pattern, the ideal scenario tomorrow (for me) would be a rally above 10719, then a reversal and a close below 10644. It does not have to happen that way for the rally from July 2nd to be complete and an intermediate term top to be in place...but, it would be very bearish both from a technical and Elliott wave standpoint. Key reversal patterns are frequently (but not always) seen at important market turning points. That has not happened yet. My scenario would produce one. It would also produce an ending Elliott wave "diagonal triangle" pattern at 2 different degrees of trend, i.e., (1) a "c" wave diagonal triangle from the July 2nd low, and (2) a 5th wave diagonal triangle from the July 30th low. What I don't want to see (since I am still bearish) is a powerful rally above the upper resistance lines on the above charts. |
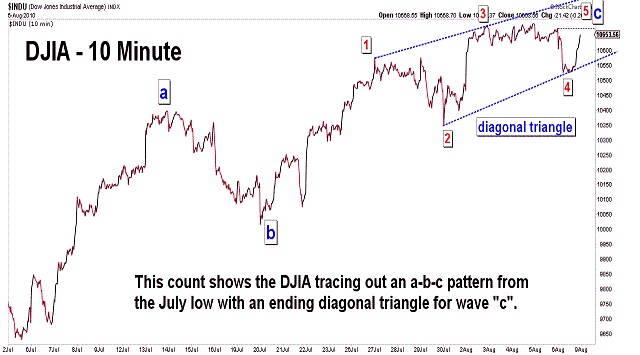
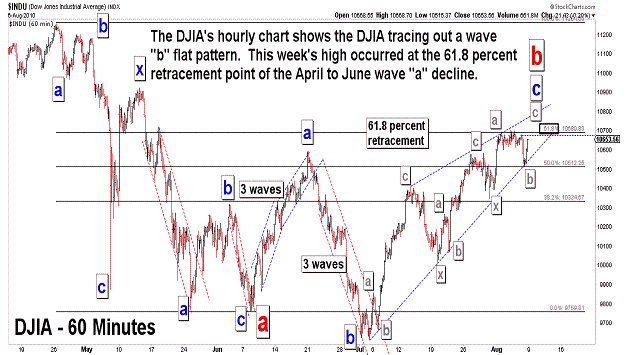
| August 6, 2010 update...Today's late day recovery left most broad market indices higher for the week. The small caps were a notable exception. After worse than expected job numbers this morning, the market sold off...but, it held around 11:00 am at a rising support line from the July low. Given the market'a recovery from this support line, I now think it is likely that a final "c" wave (or 5th wave) rally is underway to complete the entire pattern from the beginning of July. There are a few different ways to count the pattern as I show in the charts above...but, the eventual outcome is the same once the rally pattern is complete, i.e., a decline toward 8700-9400 and eventually lower. An immediate decline below today's low would mean that the final "c" or 5th wave was a "failure"...and the next phase of the intermediate term decline was most likely underway. |
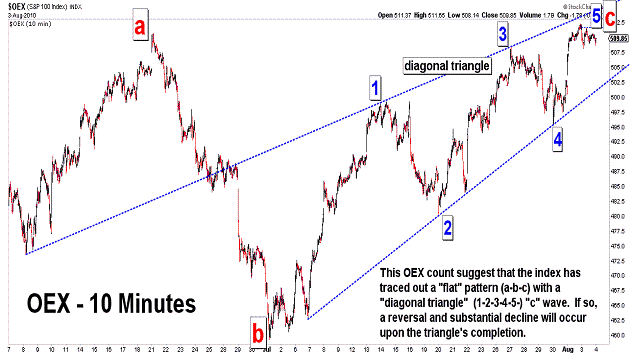
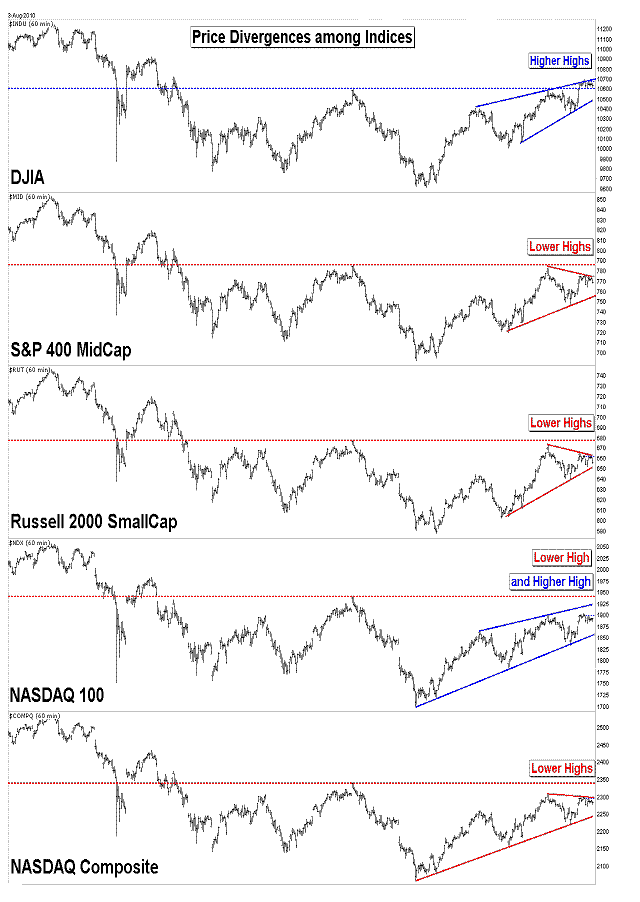
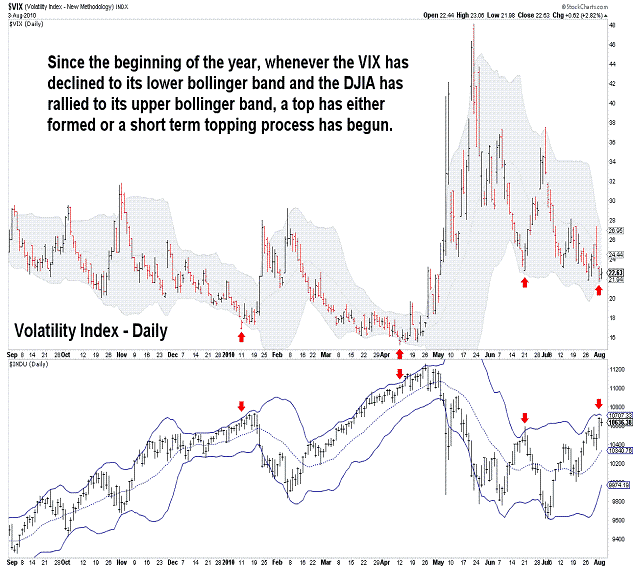
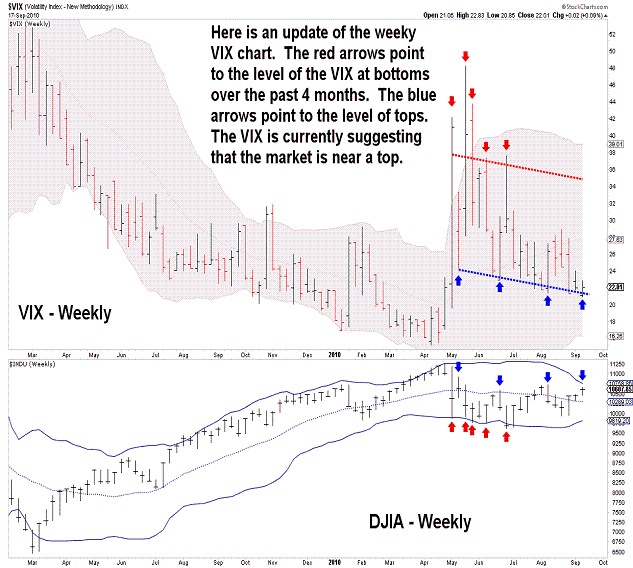
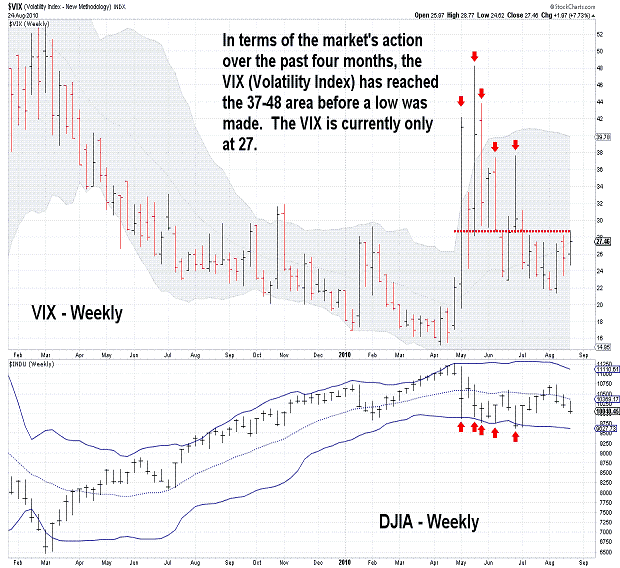
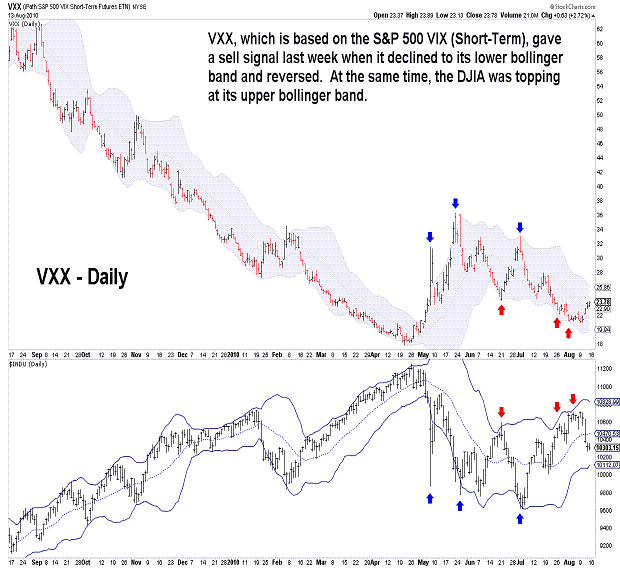
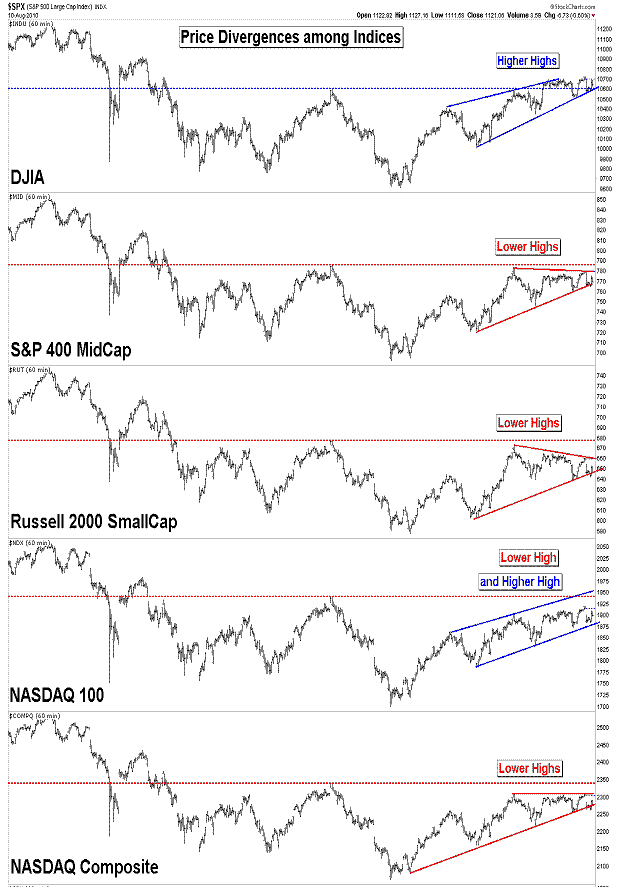
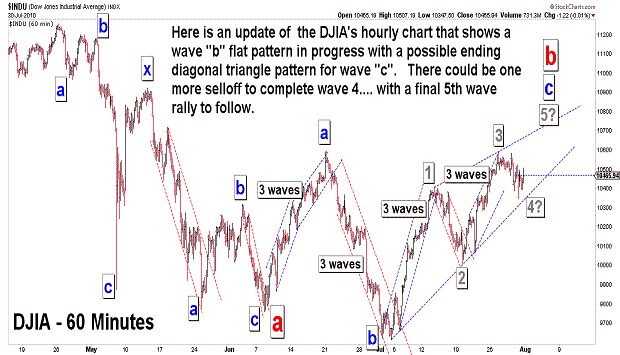
| August 3, 2010 update...Last Friday, I suggested that the door was left "open for one more rally following the current pullback." The rally started immediately at the open yesterday and, according to the wave count I have discussed here in recent updates, should be the 5th wave of an ending "diagonal triangle" pattern that began at the early July low (see second chart above). Cycles suggest that the ideal date for a top is Thursday (see first chart above)...but, several days on either side of that date is good enough given that the pattern already looks complete. Additional subdivisions and complexities are possible to extend the top until Thursday (or abit later)...but, a rally that continues significantly higher from here would cast doubt on the wave count's validity. As you see in the third chart, the broad market indices are diverging pricewise...and that is a common occurence at important turning points. Technicals, like the VIX indicator (see fourth chart above), are also flashing sell signals as they have done previously since the beginning of the year. |
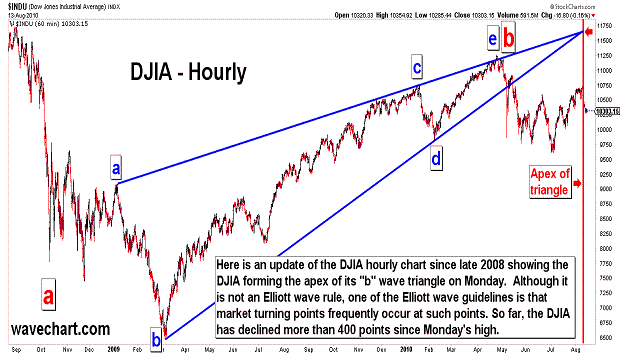
| July 30, 2010 update...The market was mixed for the week with the broad indices just slightly higher or lower. Unfortunately, this week's action did not give us a clear signal that a "b" wave top is in place...and it leaves the door open for one more rally following the current pullback. I have updated the charts shown in the past week...and the only real new information you will see is in the second chart above. The "b" wave triangle that I have been using in my preferred wave count is about to form its apex. Typically, the market will reverse course when that happens. Such reversals can be major or minor ones...and depend upon the larger wave pattern unfolding at the time of the apex formation. In the present case, I believe we are due for a MAJOR reversal that will finally take the DJIA to the 8700 to 9400 area...with lower levels to come thereafter. We'll see. |
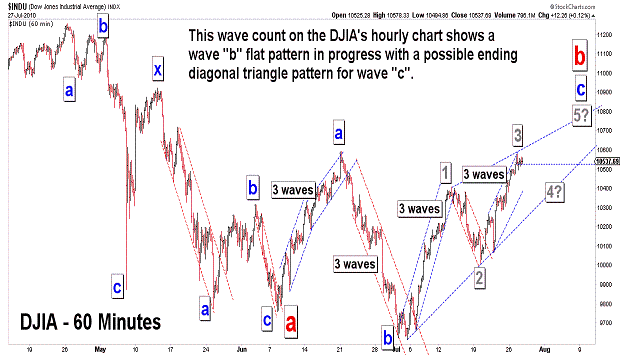
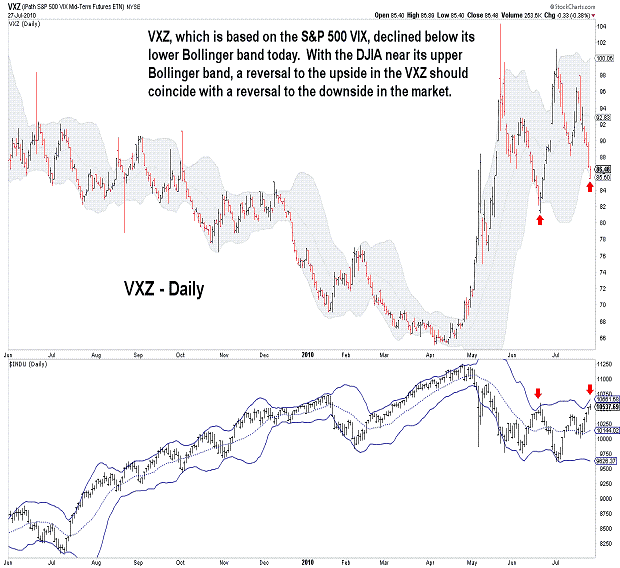
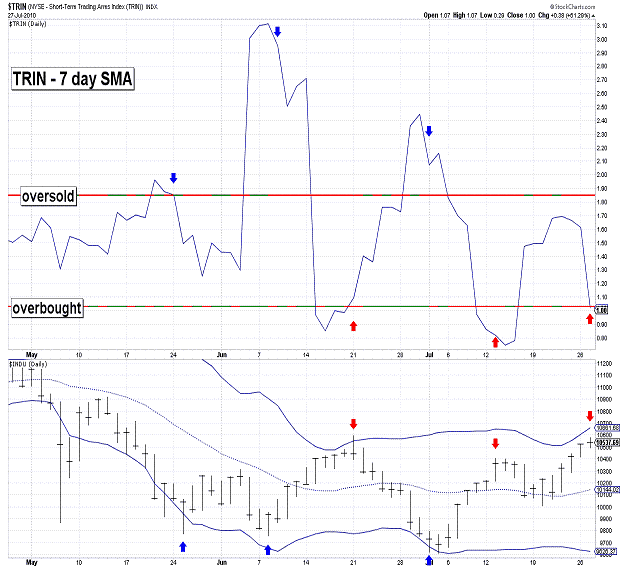
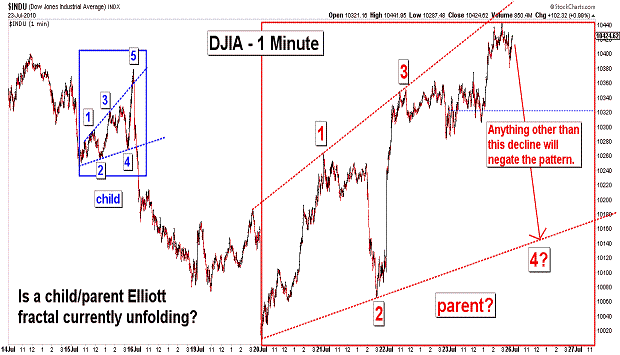
| July 27, 2010 update...The market was mixed today with a number of indices forming key reversal patterns (i.e., closing down after making a higher intraday high) on their daily charts . While most indicies that I follow did not exceed the intraday high of June 21st, a few did...Dow Jones Composite, NYSE Composite, Major Market Index. Since price divergences between indices are frequently seen at important turning points, a top could be in place (or nearly so) if the divergence is not cured. A top in the current time frame is suggested by various cycles. There was a Fibonacci Cycle turn date yesterday (see chart in Friday's update)...one on the trading day chart tomorrow (see first chart above)...and another one this week on the Fibonacci Cycle weekly chart. While I have to conceed that the wave count still has a few viable options in terms of the current pattern, various technical indicators are giving initial sell signals. If the market turns down from here and holds above its July 20th low, one possibility is the formation of an ending diagonal triangle pattern. Should that happen there would be one more rally that should exceed this week's high. There are even more complex possibilities that would extend the sideways action since May for several additional weeks...but, breaking the July 20th low would significantly increase the odds that a substantial decline below the July 2nd low is finally underway. |
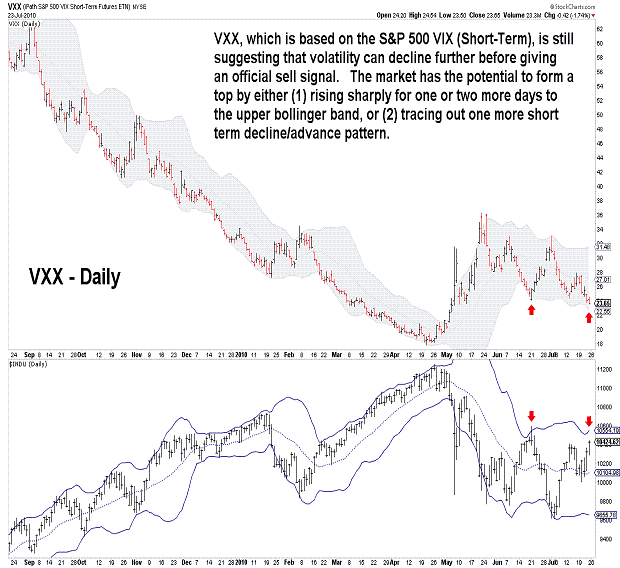
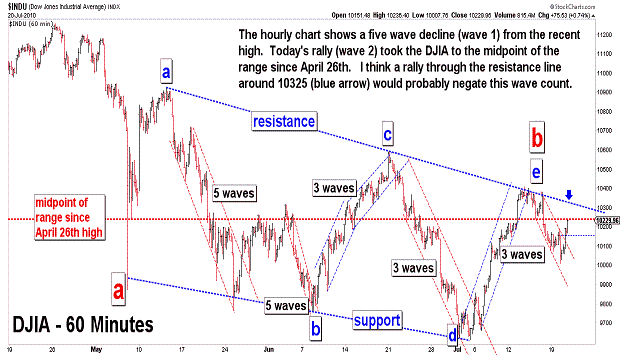
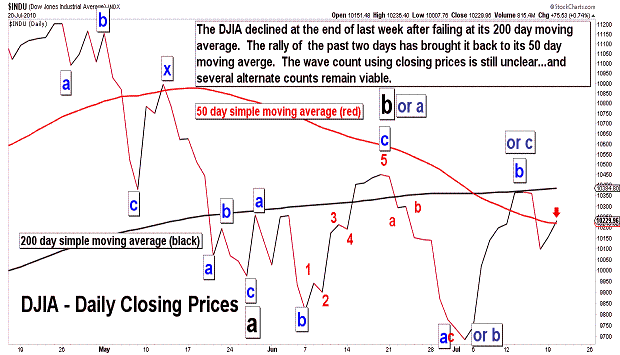
| July 23, 2010 update...Both today and Monday are potential Fibonacci Cycle turn dates (see fourth chart above). Today's rally above the March 13th high (the previous Fibonacci Cycle turn date) eliminates the "b" wave triangle count that was discussed is recent updates. Since I still believe that the April 26th high will remain as the high for the year, there are two basic "bearish" wave counts in play. One is the "leading diagonal" count shown on the Fibonacci Cycle chart just cited...which suggests that the market is currently tracing out a wave "2" (a-b-c) pattern. The other is the a-b-c declining pattern...which suggests that the market is currently tracing out a "b" wave corrective pattern. There are several ways to count the "b" wave...and the difference between them depends solely on how complex the corrective pattern becomes. Market technicals suggests a top is near...but, it may turn out to be only short term if the next decline holds above 10007.76 (Tuesday's low). If that happens the current sideways trading range pattern will extend with another (and likely final) rally back to the top. We'll see. |
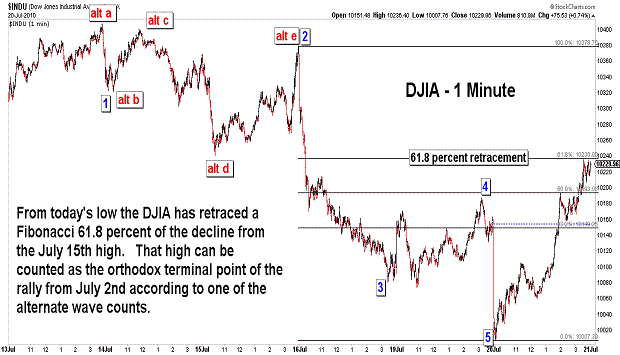
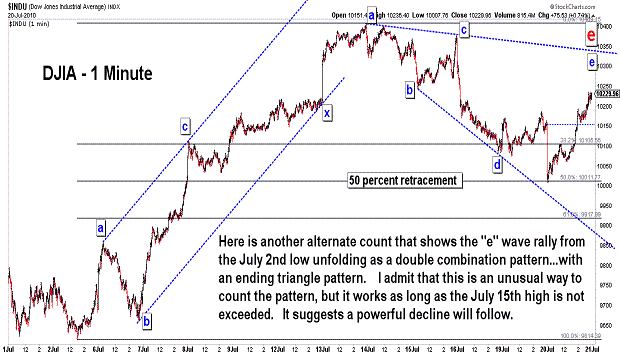
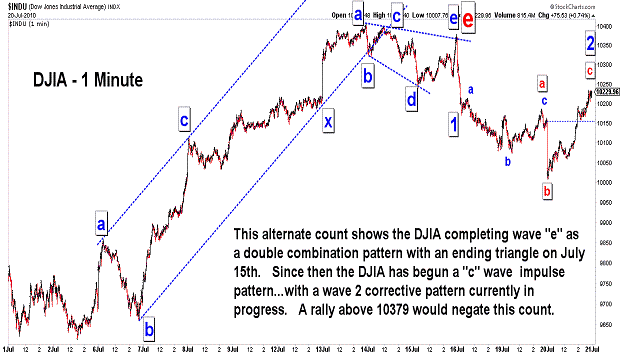
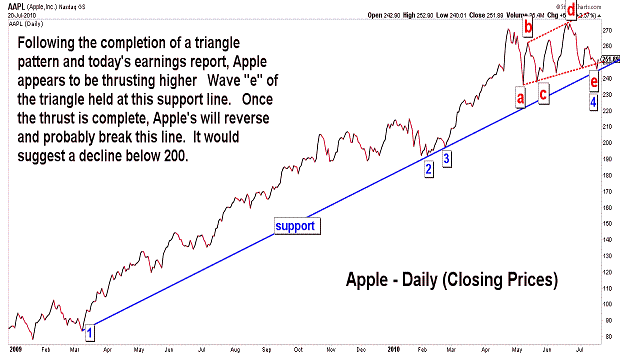
| July 20, 2010 update...Today's opening decline took the DJIA to the 50 percent retracement level of the rally from the July 2nd low. From today's low, the DJIA reversed and rallied 222 points by the close...retracing a Fibonacci 61.8 percent of the decline from the July 15th high. Because of today's sharp reversal, the market's near term direction is somewhat foggy. As you can see in the DJIA charts above, there a number of ways to view the DJIA's pattern since last week's high. The alternate wave counts shown in the charts, for the most part, resolve similarly if the 10359 level (or slightly lower at the indicated resistance line) is not exceeded. If that level IS exceeded, a rally above 10407 becomes likely. However, if and when that happens, it is not yet clear whether the high of June 21st (10594) will hold or fail. A number of technical indicators are likely to give sell signals before that does happen...but, that will not eliminate the possibility of a rally beyond 10594. Today's after hours rally in Apple suggests (as of now) that the NASDAQ 100, at least, is likely to take out its recent high. If that happens without confirmation from other indices, the first of what could be multiple sell signals in the coming days will be triggered. |
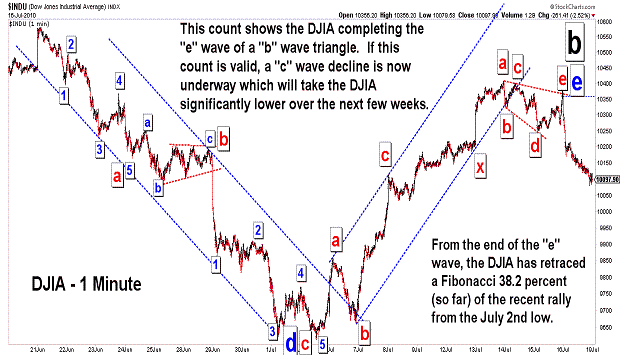
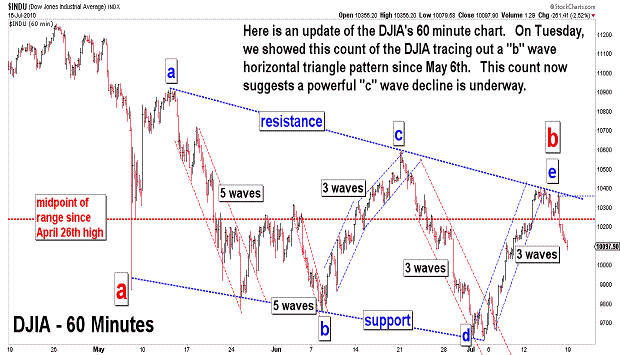
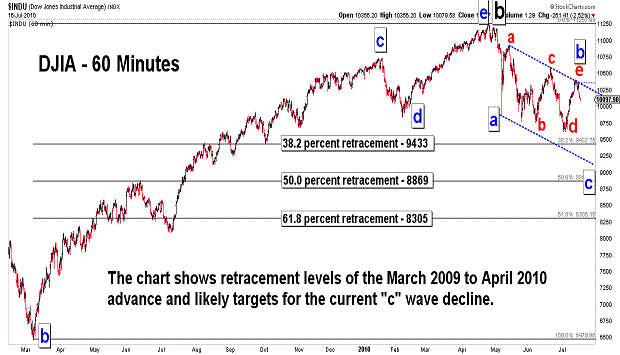
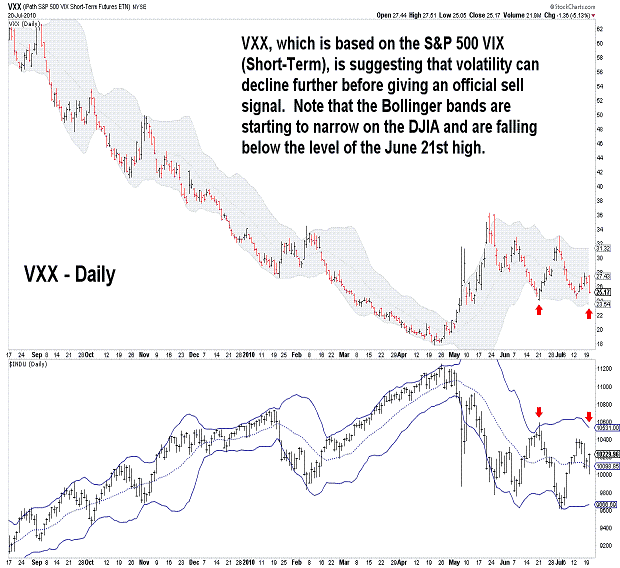
| July 16, 2010 update...Tuesday's Fibonacci cycle turn date called this week's reversal perfectly (see Tuesday's Fibonacci Daily chart). Although the DJIA closed a few points higher on Wednesday, Tuesday's theoretical high was not exceeded...and the DJIA is now more than 2 1/2 percent lower. So where do we go from here? If my wave count is correct, the market goes substantially lower over the next few weeks as wave "c" of an a-b-c pattern from the April 26th high unfolds. There is, however, a small possibility that the rally from the July 2nd low (wave "e") will subdivide into a more complex a-b-c pattern. If so, the current decline is only wave "b" of that pattern. Any decline below 9900 (IMO) would probably negate that possibility...so, a sell off next week of more than 200 points means the DJIA is most likely headed to one of the retracement levels noted in the third chart above. Given the DJIA's current trendchannel, my best guess is the 50 percent level, i.e. around 8869. That is the area of the high just before the June/July 2009 correction. If I am right above the extent of the forthcoming decline, the DJIA will finally have to break its daily and weekly lower Bollinger bands. Should that happen in "crash" like fashion, the tendency is for the market to snap back with a quick relief rally. Alternatively, when it occurs more slowly like January to March 2009, the market tends to hug the line as it falls. Clearly, IF my "b" wave horizontal triangle count (see first three charts above) is correct, the decline should be rapid. |
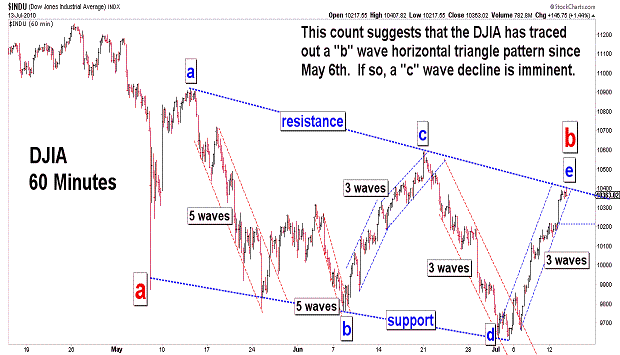
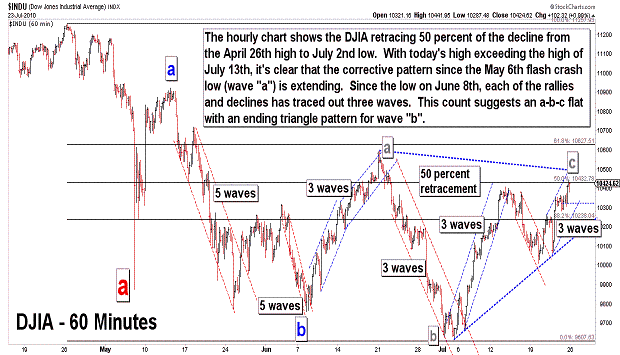
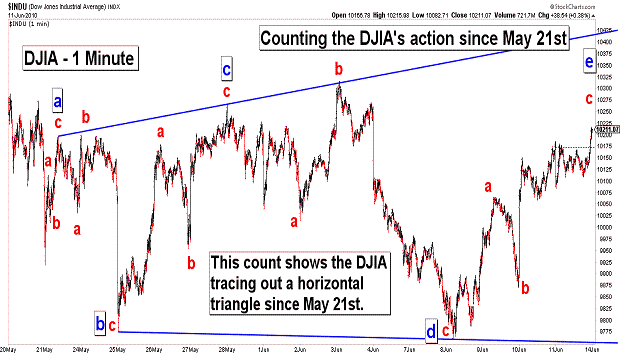
| July 13, 2010 update...As I write this update, there is an after hours rally transpiring...lead by Intel's better than expected earnings. CNBC has made a big deal of it and they keep bringing on one analyst after another that is bullish on corporate profits. I realize it's in CNBC's self interest to hype an economic recovery. But, I just don't see it. I am generally an optimistic person...but, I don't think we can keep postponing the economy's day of reckoning given the country's exploding debt...especially the part that's not even recognized on the official books. If I could see something bullish in the charts I would change my mind. For example, if the market holds above its March 2009 lows through the middle of next year, I think the probability of a rally to new highs will increase. Until then, I'll continue to view the trend since the April 26th high as bearish and unfinished. As you can see in the charts above, we tested a resistance line today...that suggests the DJIA has been tracing out a horizontal triangle pattern since the May 6th "crash" low. That makes some sense...because triangles typically follow market action that moves too far too quickly. If the current rally is the "e" wave of a triangle, a reversal should occur from near current levels...and it should occur this week. We'll see. |
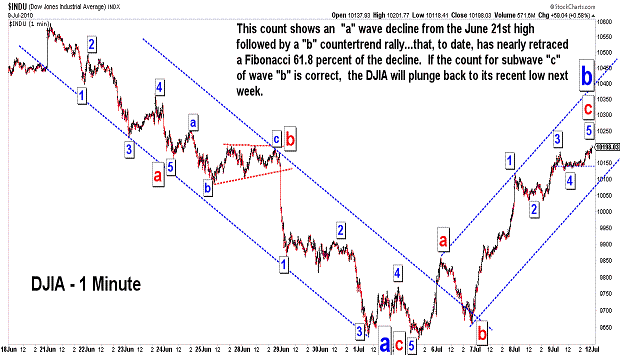
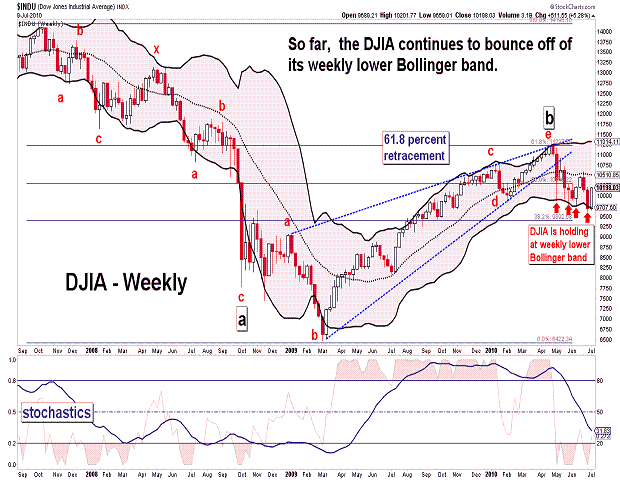
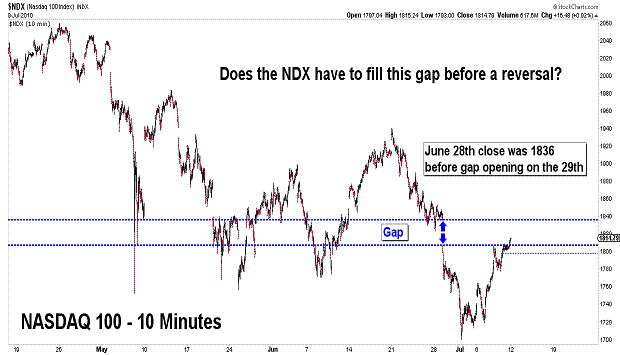
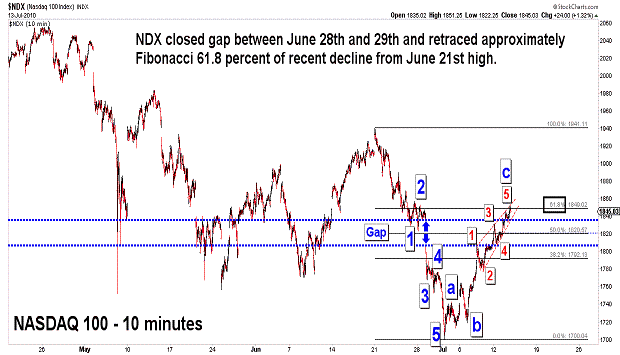
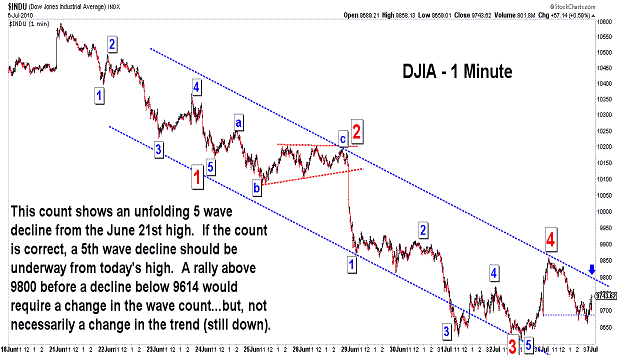
| July 9, 2010 update...Last week at this time I suggested there would "be a good short term bounce...once 5 waves are complete from the June 21st high." We did, in fact, get a short term bounce beginning this past Tuesday, but unfortunately, it occurred without the materialization of a 5th wave decline We had a holiday this past Monday...and it is possible to rationalize that the 5th wave decline occurred in the overnight futures session. Still the charts that we have to deal with, in particularly the DJIA, now show a three wave decline (IMO) from the June 21st high. That opens up a number of wave count alternatives. By today's close, the DJIA had retraced nearly a Fibonacci 61.8 percent of the recent decline. The rally may stop right here...but, higher prices next week can not yet be ruled out...due to those wave count alternatives that are currently in play. As you can see in the weekly chart above, the weekly lower Bollinger band has provided substantial support for the market over the past two months. It will not do so again...assuming that I am correct about a major decline beginning at the April 26th high. The last chart above shows the NDX starting to fill a gap between June 28th and 29th. Should the market climb higher early next week, a reversal might occur once the gap is closed. We'll see. |
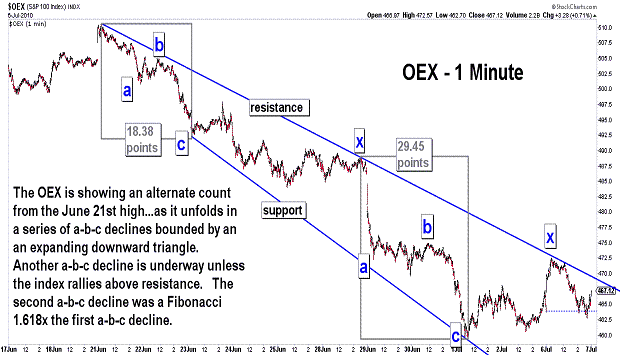
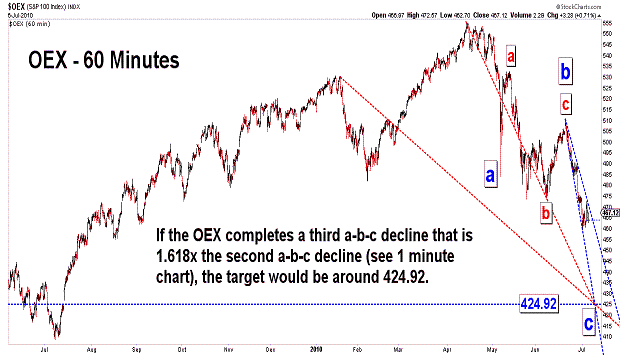
| July 6, 2010 update...The market opened strongly this morning following the holiday weekend, but the market was mixed by session's close. On Friday, I gave some reasons why a I thought that a short term bounce was near...but, I also thought it would start from a lower level. If today's bounce was NOT the start of a short term countertrend rally (and I still think that is likely to be the case), then today's high must not be broken before last Friday's low is exceeded. As you can see in the two OEX charts above, an interesting pattern is developing (or, if complete, developed). From the June 21st high, the index has declined in a series of two a-b-c patterns. Interestingly, the length of the second a-b-c pattern was a Fibonacci 1.618x the length of the first. If a third a-b-c decline has begun from today's high and is 1.618x the length of the second a-b-c pattern, then the next target for a low in the OEX is around 424.92. We'll see. |
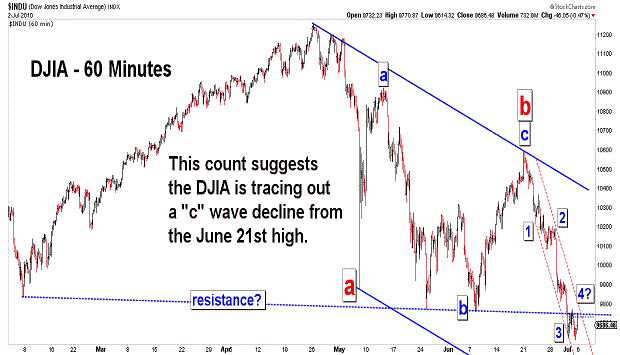
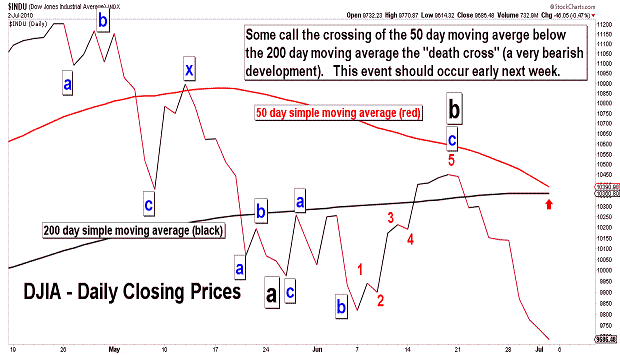
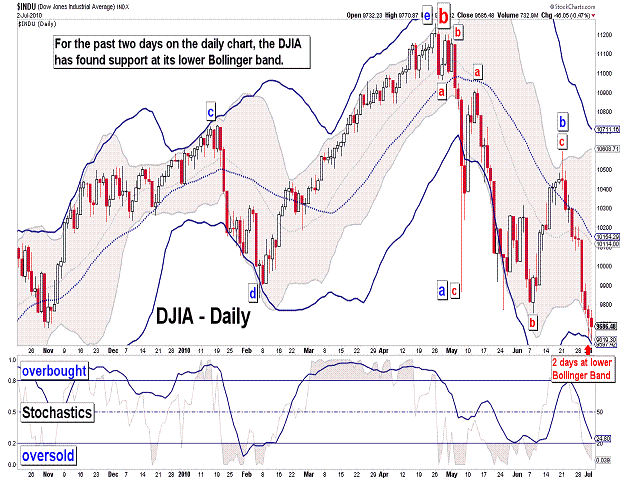
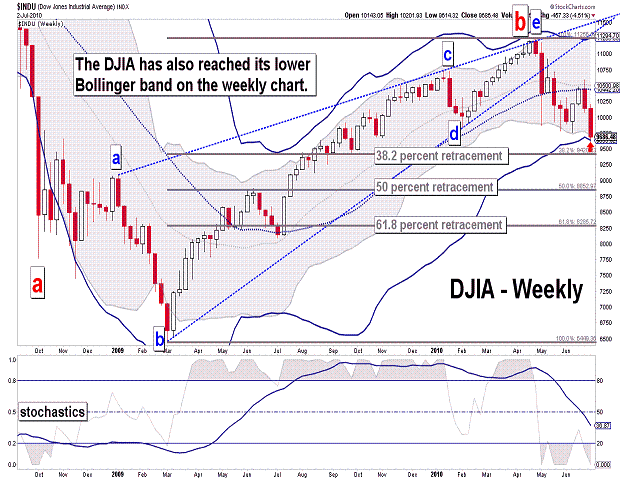
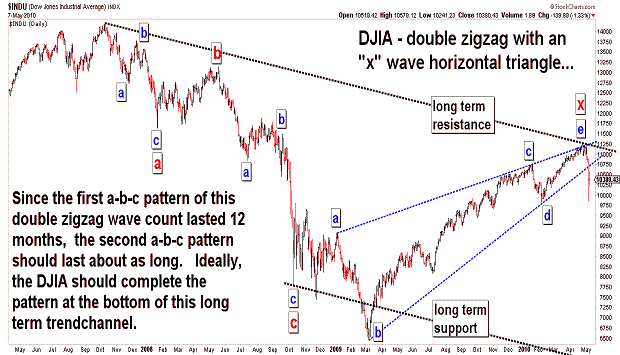
| July 2, 2010 update...This week the market's losses accelerated...the DJIA declined about 4 1/2 percent and the NASDAQ declined about 6 percent. When the market topped out on April 26th, I suggested that the next "bear market" would last 12 months or so. We are "bearly" past the 2 month marker...and, the DJIA has already declined 13 1/2 percent from the high. How does this compare to the first phase of the decline from the October 2007 high? That decline was 15 1/2 percent...but, it took 50 percent more time to accomplish the additional 2 percent loss (48 trading days vs. 71 trading days). I think the present decline is likely to far exceed that one by the time we get to the 23rd trading day from now. Technically, the market is oversold on both the hourly and daily charts, and it has reached the lower Bollinger band on both the daily and weekly charts. So, . It is not yet clear, however, how low the market goes before that happens. I have mentioned the 8700 to 9400 area previously. We'll see! In the meantime, enjoy the July 4th holiday. |
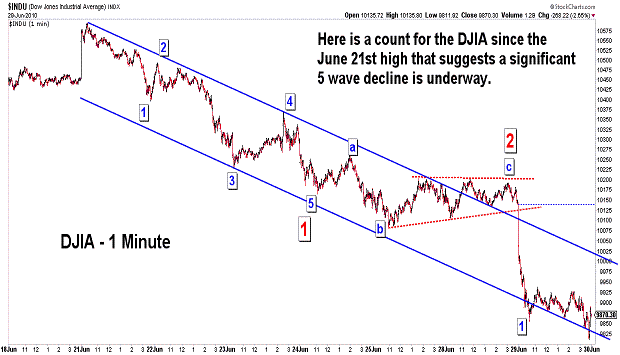
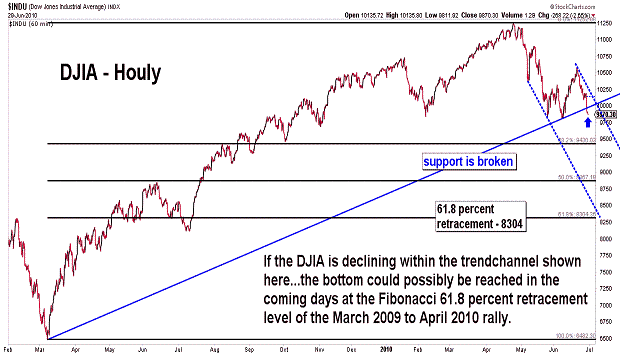
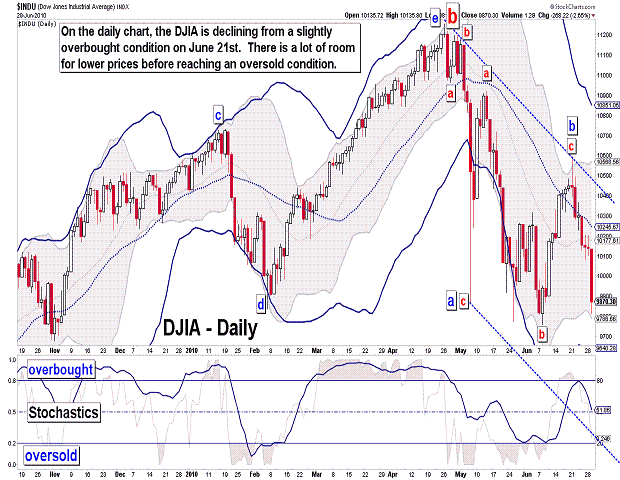
| June 29, 2010 update...A number of broad market indices made new lows for the year today (i.e., NASDAQ Composite, OEX, SPX, XII). Others should follow in short order. Assuming the DJIA is declining in a "c" wave pattern as I have labeled it in the charts above, the current decline should take the average to the 8700 - 9400 target that I have discussed in recent updates. As the hourly chart above indicates, it is even possible for the present decline to reach the 8300 level...i.e., the 61.8 percent retracement point of the March 2009 to April 2010 advance. We'll see! In any event, the current market decline, as the fifth chart shows, has only reached neutral territory and can decline substantially more before reaching oversold territory (on a daily basis). |
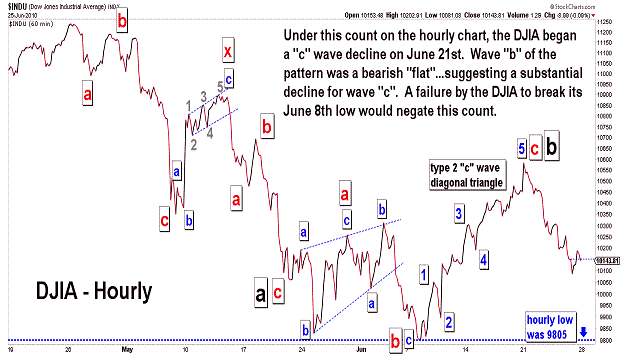
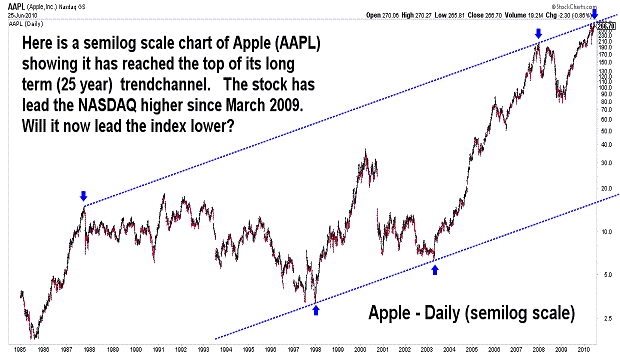
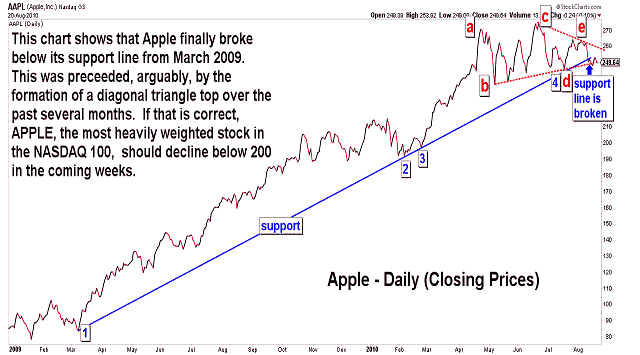
| June 25, 2010 update...The DJIA lost about 3 percent this week...the NASDAQ about 4 percent. Both declines engulfed last week's gains on their respective weekly candlestick charts. For candlestick chartists, an engulfing pattern is very bearish. What else is bearish? Interestingly, except for Apple (until this week - see AAPL chart), most of the top 10 NASDAQ 100 stocks. Looking over their individual stock charts, they look very weak (See APPLE - 16.50%, MICROSOFT - 4.91%, QUALCOMM - 4.73%, GOOGLE - 4.67%, ORACLE - 2.98%, CISCO - 2.96%, TEVA - 2.58%, INTEL - 2.39%, RIMM - 2.29%, GILEAD - 2.24%). As suggested by the AAPL chart above, a reversal in that stock (the most heavily weighted stock in the NASDAQ 100 index) should provide the impetus for more (accelerated) downside action. We'll see! In terms of the DJIA, the key level is still the June 8th low of 9757. Once that level is breached the next phase of the intermediate term decline will be confirmed. |
| June 22, 2010 update...I am leaving shortly to attend my daughter's high school graduation...so tonight's update will be abbreviated. On Friday, I indicated that yesterday was the 55th Fibonacci day from the April 26th top...and that it just might coincide with a high and a reversal in trend. In fact, yesterday's key reversal day was followed today by a nice 1 1/2 percent decline in the DJIA. Assuming wave "c" is now underway, a MAJOR decline has just begun. The key level to watch now is the June 8th low of 9757. The DJIA has to slice right through that level in the coming days...or more boring sideways corrective action will follow. |
| June 18, 2010 update...On Tuesday, I thought a downside reversal was imminent. Instead, the final wave of the rally from the June 8th low subdivided and extended into today's action. As you can see in the first chart above, the pattern of that 8 day rally can now be counted as complete...in two different ways. With (1) the completion of three alternate wave counts (see second, third and fourth charts)...and with (2) a number of short term technical indicators diverging at today's high...and with (3) the DJIA near its upper Bollinger band on the daily chart, a reversal to the downside next week should be a done deal. Anything other than that means a more complex wave pattern is unfolding...with several more wave subdivisions to come before a top. As I mentioned in recent updates, Monday is the 55th Fibonacci day since the April 26th top. A few weeks ago I thought it would be a low...maybe now it will turn out to be a high. We'll see. |
| June 15, 2010 update...Last Friday, I offered three possible wave counts for the DJIA given the form of the rally from the June 8th low. After the action of the past two days, one count now seems to be best...and it suggests that a major reversal to the downside is imminent. Assuming the DJIA turns lower tomorrow and quickly declines below yesterday's low of 10186, it becomes very likely that a wave "c" decline to 8700 to 9400 is underway. There are, I must admit, a few wave count possibilities that delay the beginning of the wave "c" decline...but, even so, the current rally is probably nearly complete. If wave "c" does not begin, we are likely to see more sideways action for the next few weeks...with a more complex wave "b" pattern unfolding. |
| June 11, 2010 update...On
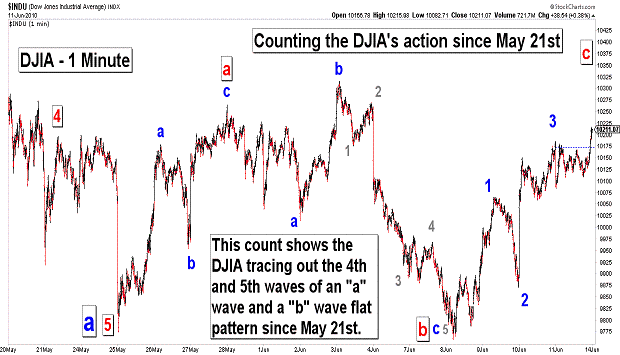
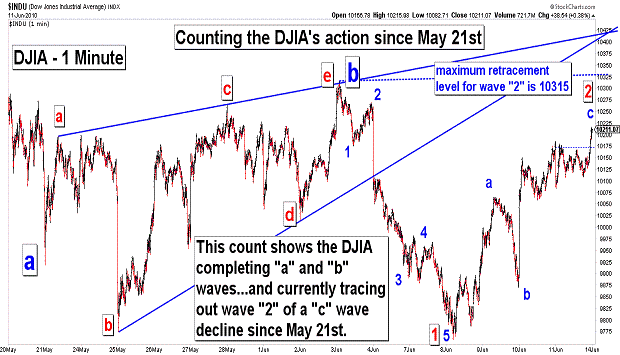
Tuesday, I suggested that the DJIA was tracing out the second wave of a "c" wave decline that began on June 3rd. That may still be the case...however, there are several other possible wave counts that may also develop over the next few days. The first three charts above show the primary wave count alternatives. The main difference between the three counts lies in the extent of the rally since June 8th. One count does not permit a rally above 10315...the other two counts do. The bottom line, however, is that they all eventually resolve on the downside. I am sticking to my target of 8700 to 9400 for now. Given the pace of the pattern since the June 3rd high, I am starting to have reservations about the likelihood of a bottom by June 21st (see the past two updates for details). But, we shall see! |
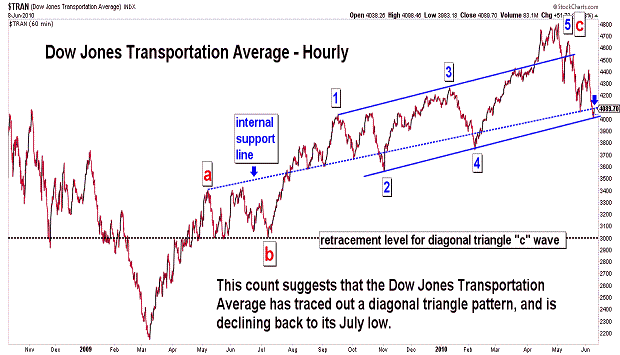
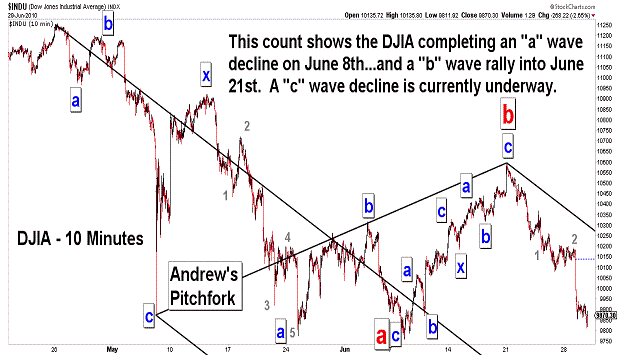
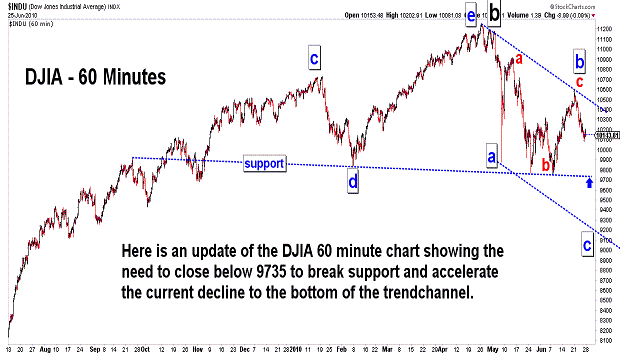
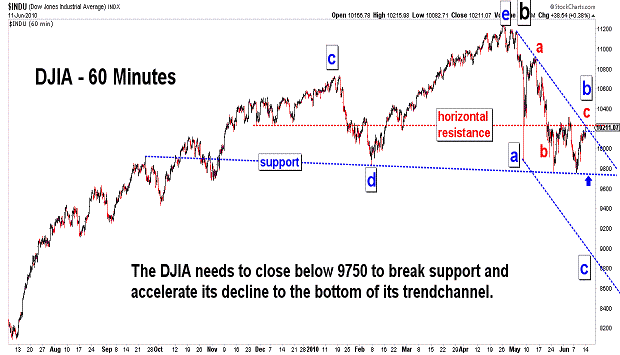
| June 8, 2010 update...The market has continued to follow the 1990 pattern that I discussed in the May 11th update (see last two charts above). The pattern currently suggests that the DJIA is tracing out a "c" wave decline...which should take it to the bottom of its declining trend channel in the coming days (in 5 waves). Today's rally appears to be wave 2 of "c". Once complete, a significant wave "3" decline should follow. Last Friday, I mentioned June 21st as a likely Fibonacci reversal date (55 Fibonacci days from the April 26th high). Let's see if that date coincides with a final 5th wave decline for wave "c". |
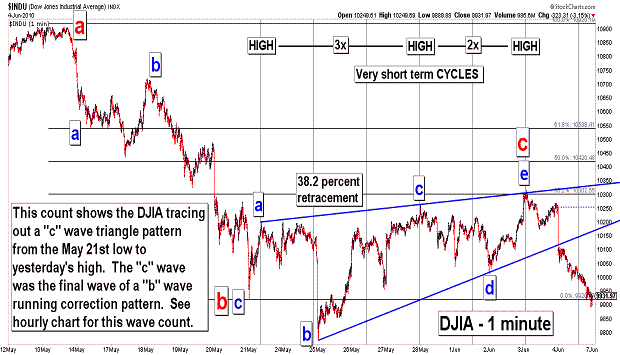
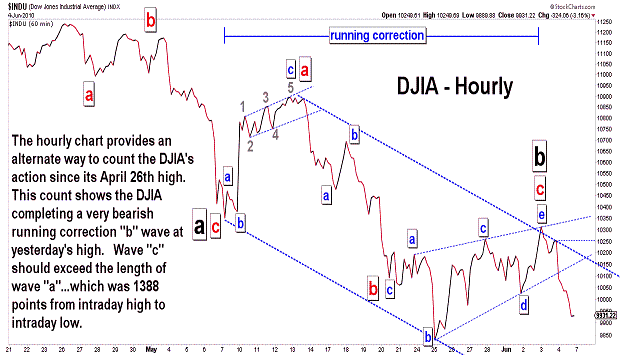
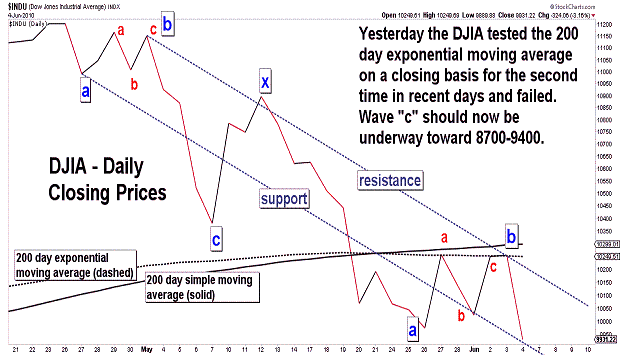
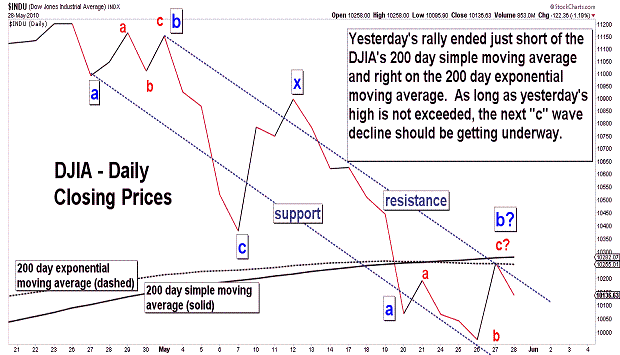
| June 4, 2010 update...I had thought, as you can read in Tueday's update, that a wave "c" decline had begun last Friday...after the DJIA had tested its 200 day moving average. Instead, following Tueday's decline, the market reversed to the upside and the DJIA retested its 200 day moving average yesterday. A major decline followed today...and (again) I think that wave "c" is finally underway toward 8700 to 9400. In the charts above, I offer two slightly different wave counts. They both, however, suggest the same bearish outcome...a substantial decline in the coming days. I noted in the last chart the date June 21st. That day is the 55th Fibonacci day from the April 26th high. During 1987, it took exactly 55 Fibonacci days to go from the August high to October crash low. The pace of the market's decline since April 26th would seem to suggest that a low (although not a final low IMO) around June 21st is quite possible. |
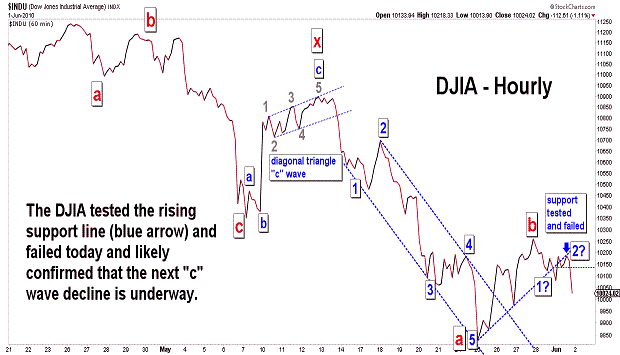
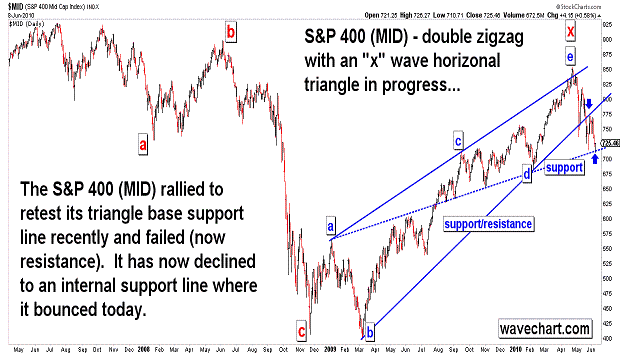
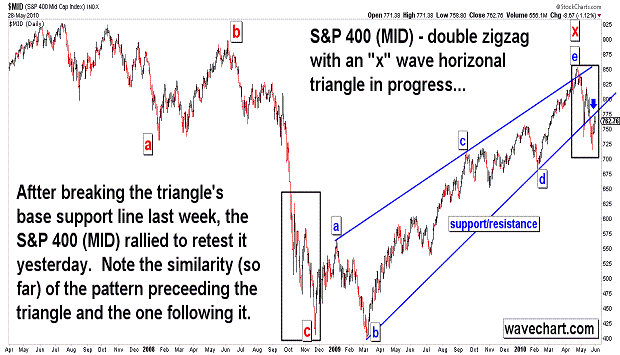
| June 1, 2010 update...Because of yesterday's holiday, I only posted one chart tonight. The DJIA opened weakly this morning...down almost 100 points. It then rallied to its high of the day around 1:30 pm...up about 82 points. From there, the market weakened and ended near its lows...down 112 points. As the chart above shows, the DJIA failed and reversed at its near term support line...confirming (I believe) that the next wave "c" decline is underway. How far wave "c" takes the DJIA will depend on a test and reaction (assuming it, in fact, comes) by the average of its recent low of 9774. The DJIA's initial "a" wave from the April 26th high was small relative to the large "c" wave that followed. The recent second "a" wave was also large (comparable to the preceeding "c" wave)...so, one possibility is that the current "c" wave will be small...and hold not too far below 9774. If that happens, the DJIA will complete a double zigzag pattern and a sizeable rally will follow. The other possibility is that the DJIA will trace out a much more significant decline below 9774 (to the 8700-9400 area)...and confirm that a more substantial intermediate term decline is unfolding. A rally above 10264 would negate both possibilities. I think the action over the next few days will be important in discerning the correct wave count. |
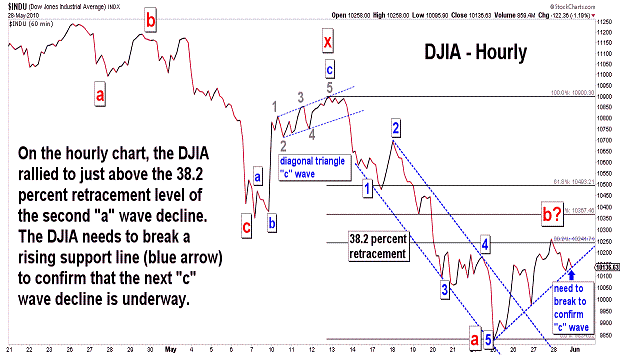
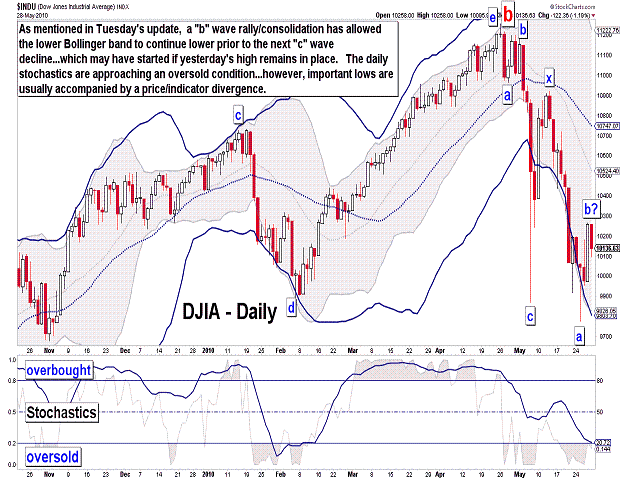
| May 28, 2010 update...It was a mixed week for the market indices. On Tuesday, I suggested that the DJIA completed the second "a" wave of "a series of a-b-c corrective patterns" from the April 26th high. I said that a "b" wave was likely in progress...and showed several possible targets in Tuesday's charts. One was the 200 day moving average...another was the 38.2 percent retracement level of the decline from March 13th (wave "a"). Yesterday, the DJIA closed right between them...within 10 points of the first and 30 points of the second. So, there is a high probabilty that wave "b" is complete and wave "c" is underway. Today's decline provided some good support for that case...but, further confirmation is required next week. A reversal back to the upside would obviously negate that wave "c" has started. As I said in recent updates, my target for the end of wave "c" is 8700 to 9400. We'll see what happens next week. In the meantime, enjoy the Memorial Day holiday. |
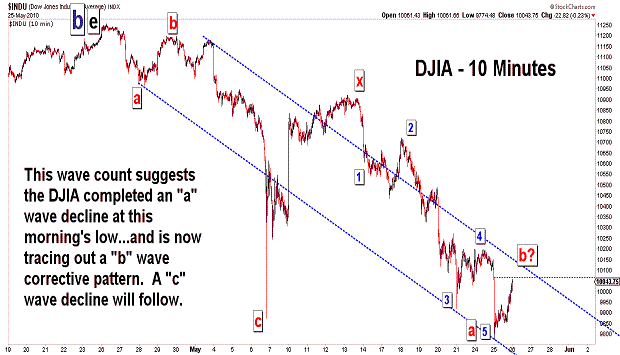
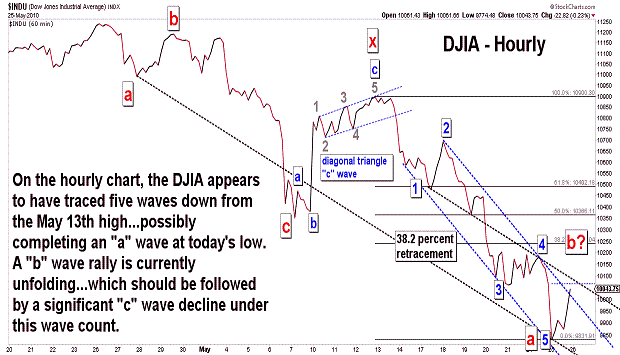
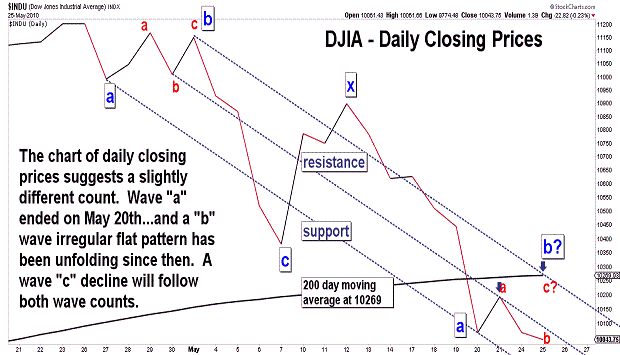
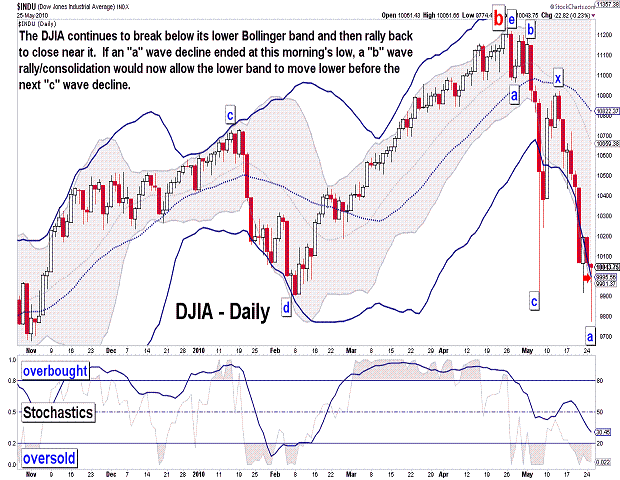
| May 25, 2010 update...On Friday, I suggested the DJIA "in the coming days" would follow other stock indices in breaking its May 6th low. The DJIA did so today. While the DJIA and other indices today closed well off their lows, they continue to decline (so far) in accordance with my preferred wave count. To reiterate, that wave count suggests the DJIA is declining from its April 26th high in a series of a-b-c corrective patterns. At this morning's low, the DJIA either completed the second "a" wave of the pattern....or, alternatively, completed a subwave of a "b" wave corrective pattern that began on May 21st. In either case, a "b" wave is likely now in progress. Over the past several days, it appears that the market is weakest at the open in the morning, but reverses and rallies back in the afternoon. Technically, the indices have a hard time staying for any length of time below their lower bollinger band. They quickly snap back to it or slightly above it. A "b" wave consolidation would allow the lower band to move lower before the next "c" wave decline begins. I don't think we will have to wait too long before that decline gets started (my target remains 8700 to 9400)! |
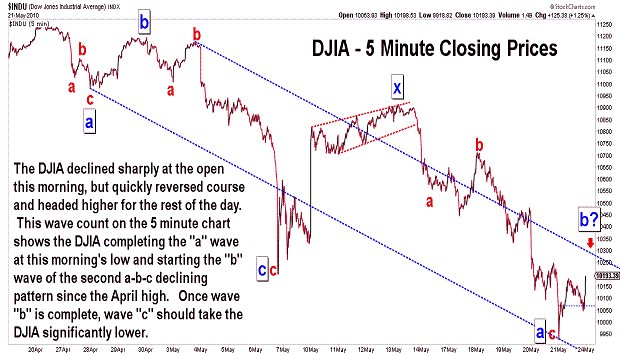
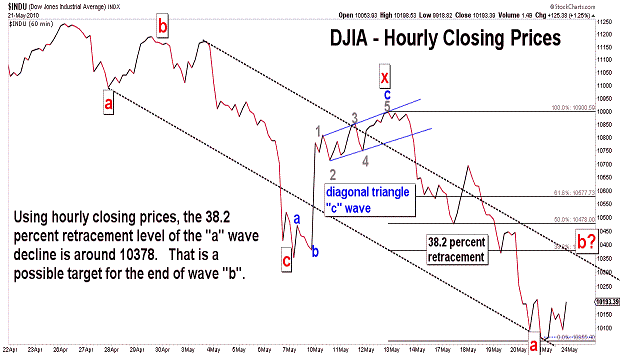
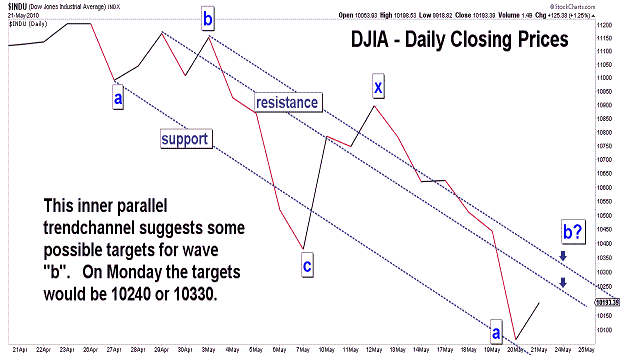
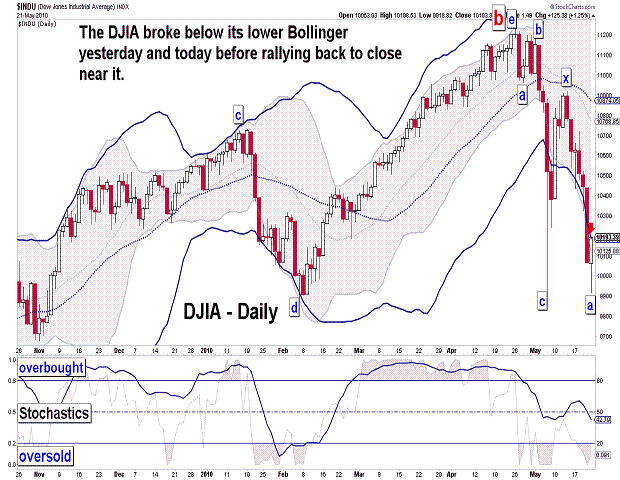
| May 21, 2010 update...The DJIA lost about 4 percent this week. While the DJIA has not yet broken below its recent May 6th low, a number of other broad stock indices have, i.e., SPX, OEX, NYA, RUT, MID, XII. If my preferred wave count is correct, the DJIA will follow suit in the coming days. That wave count suggests the DJIA is declining from its April 26th high in a series of a-b-c corrective patterns. At this morning's low, the DJIA completed the second "a" wave of the pattern. On the hourly chart, that low occurred at 10060 (today's actual intraday low was 9918.82). In Tuesday's update I suggested "...that a wave "b" corrective pattern is likely to occur in the 10000 to 10200 area." That turned out to be a pretty good guess on both an hourly and daily closing basis (I was slightly off on an intraday basis). In any event, wave "b" is likely to continue unfolding for a period of time next week (keep an eye on the 200 day moving average - currently at 10262)...before wave "c" begins and takes the DJIA significantly lower (8700 to 9400 is my current expectation). While it would not be fatal to my count, a rally above 10500 would probably make me rethink the timing and overall pattern of the current intermediate term decline. |
| May 18, 2010 update...Sorry about the lateness of today's update. I was out of town most of the day and away from the action of market. There really is not much to add to the comments of the past few updates. The DJIA continues to unfold in line with my preferred view that another a-b-c pattern is unfolding following the completion of an "x" wave last Thursday. As you can see in the second chart, the DJIA has declined back to test its lower Bollinger band...after moving below and above it during the past week and 1/2. The lower Bollinger band could provide some temporary support or slow down the current decline. But, once it starts to bend sharply downward, the DJIA should work its way lower right with it...especially during the next wave "c" decline. My best guess (and it is just that) is that a wave "b" corrective pattern is likely to occur in the 10000 to 10200 area. We'll see. |
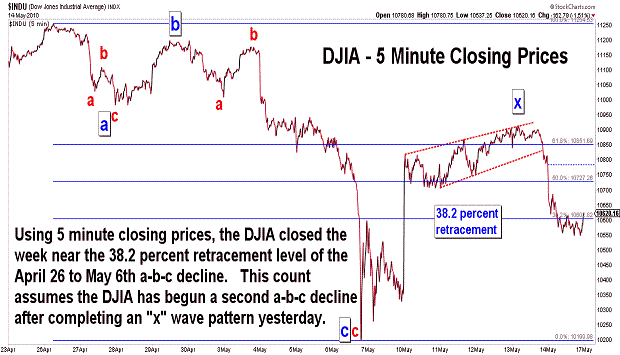
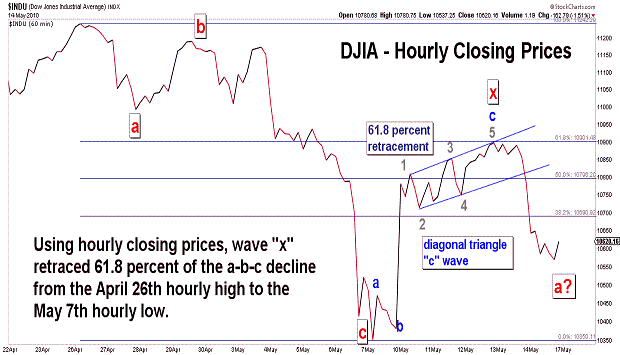
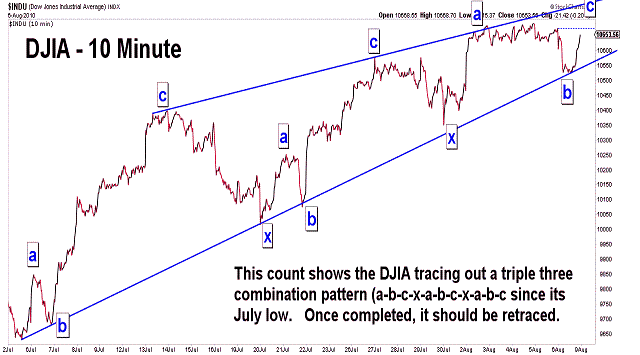
| May 14, 2010 update...The DJIA ended with triple digit moves four out of 5 days this week. Despite the strong gains on Monday and Wednesday, the DJIA closed today BELOW the midpoint of this week's trading range. I suggested in Tuesday's update that the DJIA was likely tracing out the first "x" wave of a multi-three combination corrective pattern (a-b-c-x-a-b-c or a-b-c-x-a-b-c-x-a-b-c). The "c" wave of that "x" wave appears to have completed a diagonal triangle pattern yesterday. That lead to the large selloff yesterday afternoon and today. While the "x" wave could trace out a more complex pattern, it is more likely (in my opinion) that the next "a" wave in the declining pattern from April 26th is underway. This "a" wave does not have to decline below last week's low of 9869 before a countertrend "b" wave begins (although it could). That "b" wave cannot, however, exceed 10920 or something else is going on, i.e. a complex wave "x" is still unfolding. Once wave "b" is complete, wave "c" should take the DJIA to or below 9000...possibly the July 2009 lows. We'll see. |
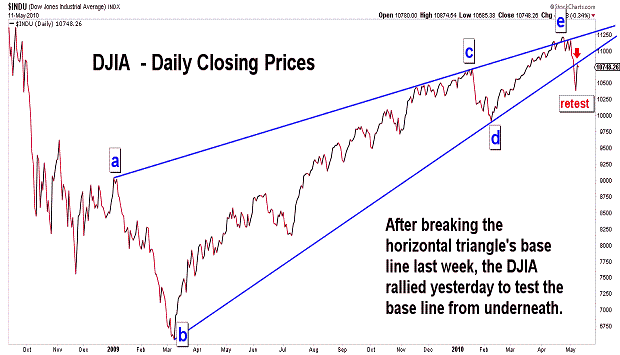
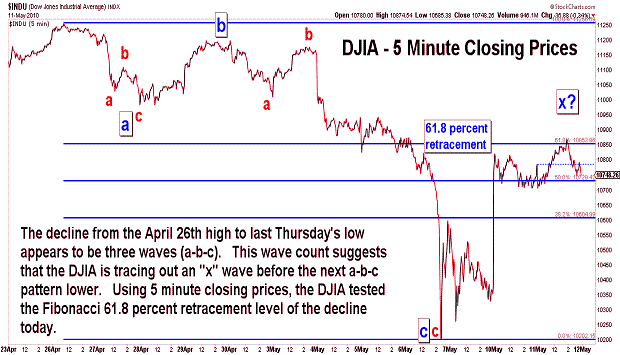
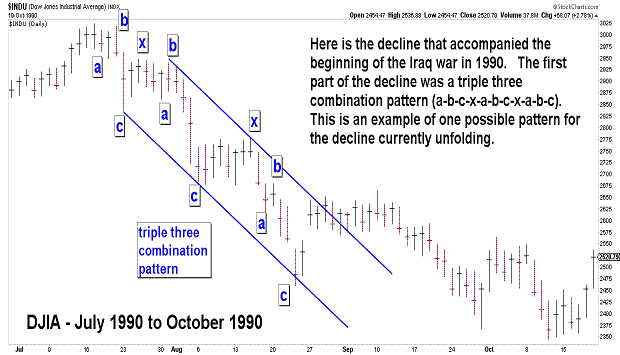
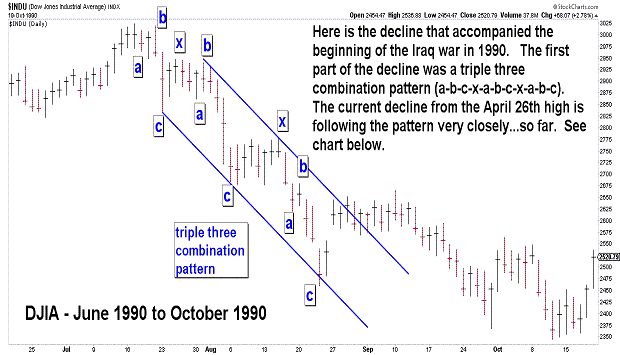
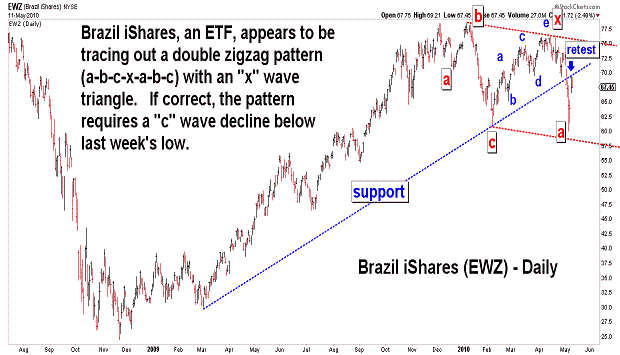
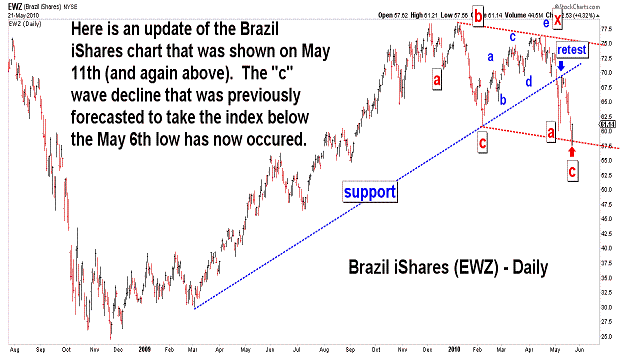
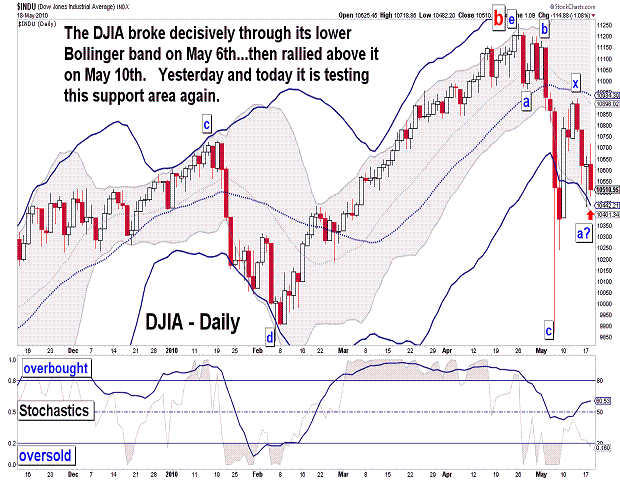
| May 11, 2010 update...In last Tuesday's update I said: "I expect to see more downside action in the coming days and weeks followed by brief rallies that retest support lines (emphasis added) that are broken along the way down." Well, yesterday the DJIA did rally back to test its previous support line which was broken decisively last week (see first chart). In last Friday's update I said: "The pattern from the April 26th high is only 9 days old and its structure can take various forms in the coming days and weeks." Yesterday's strong rally helped to eliminate a few of the possible wave counts from the April 26th high. Clearly, the decline from that high to last Thursday's low was three waves (a-b-c). As long as the April 26th high remains intact, the best count (in my opinion) for this week's rally is an "x" wave (see second chart). I put up a chart of the DJIA during 1990 (see third chart) to illustrate the type of pattern that may be unfolding. That pattern in 1990 was a triple three combination pattern (a-b-c-x-a-b-c-x-a-b-c). We are only in the first phase of that pattern if it is indeed unfolding. We'll see how long the current pattern mimics that one...I'll let you know if and when the current action deviates from the pattern. Finally, last Friday I pointed out that one indice (XMI) declined below its February 5th low...confirming in my mind that the rally from the February low was complete and that an important top was in place. Today, I noticed that the DJIA on a theoretical basis also declined below its February 5th low. So, that makes two (at least). |
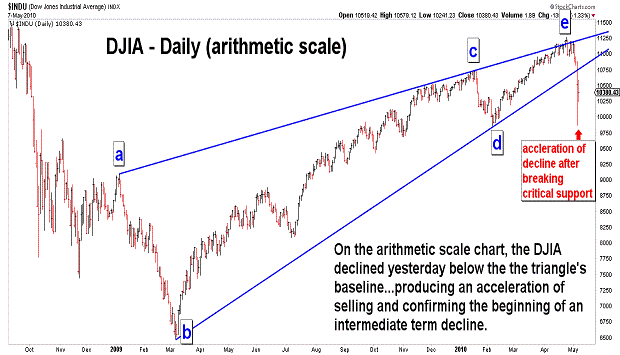
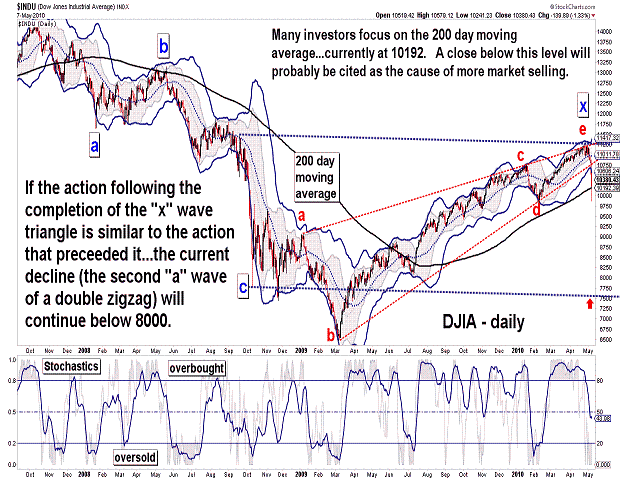
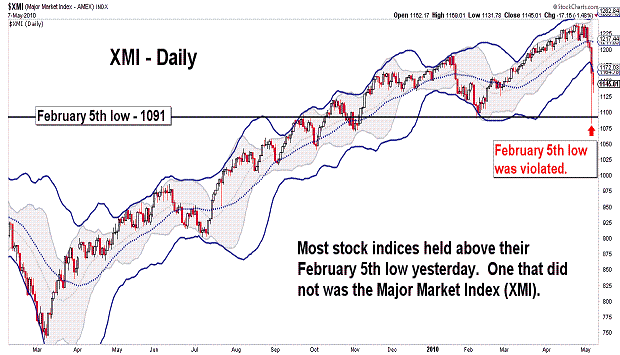
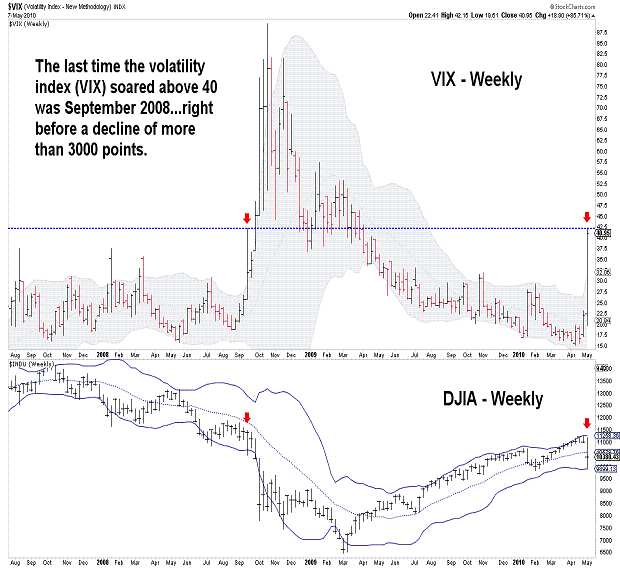
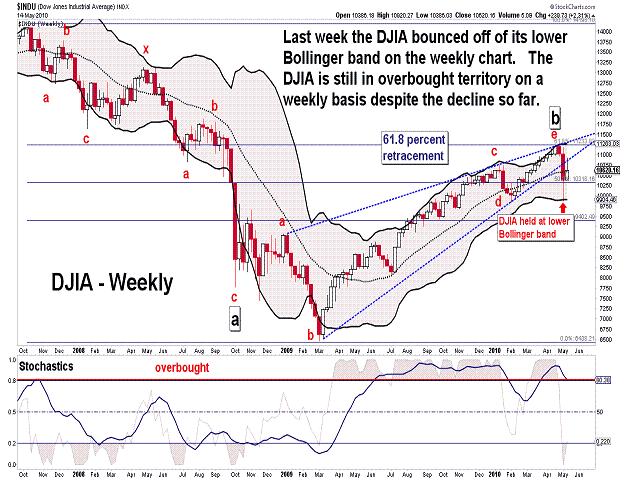
| May 7, 2010 update...An intermediate/long term decline is underway. The DJIA lost almost 6 percent this week; the NASDAQ lost almost 8 percent. If my wave count is correct, the markets should decline well into 2011...and the low of 2009 should be broken. During yesterday's roller coaster ride, most of the broad stock indices managed to hold above their February 5th lows...however, one major indice did not - the Major Market Index (XMI). In my mind, that price violation eliminates any possibility that the rally from February is incomplete. The April 26th "e" wave overthrow and reversal (as described in recent updates) was ideal in terms of my preferred wave count. The pattern from the April 26th high is only 9 days old and its structure can take various forms in the coming days and weeks. For example, today the DJIA could have been tracing out a 4th wave since yesterday's low with a 5th wave to come next week...or it could be the "x" of a more complex declining corrective pattern. We'll see. As you can see in the VIX chart (last chart above), market volatility has soared...and intraday action (in the DJIA) is now in the hundreds of point. So, while it is possible for the DJIA to close up over 100 points on any given day in the near term, I expect to see much lower prices in the coming weeks...especially after the DJIA's 200 day moving average (10192) is broken on a closing basis (see third chart above). |
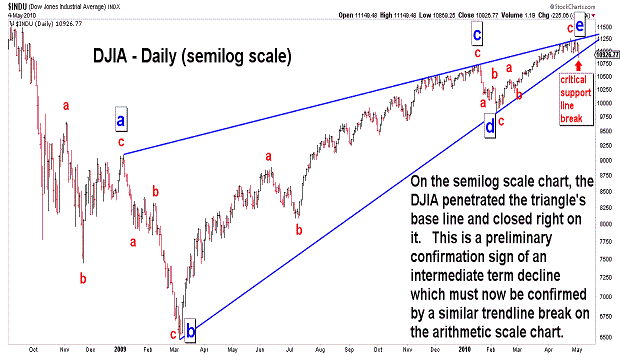
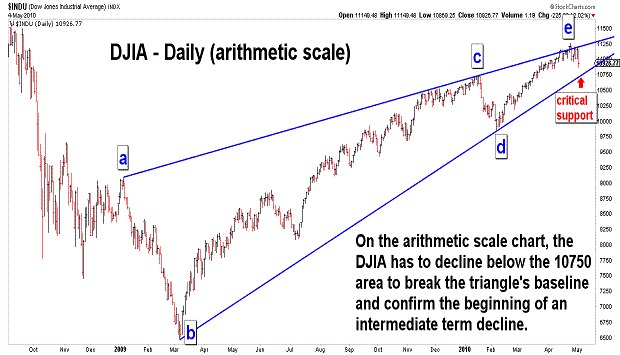
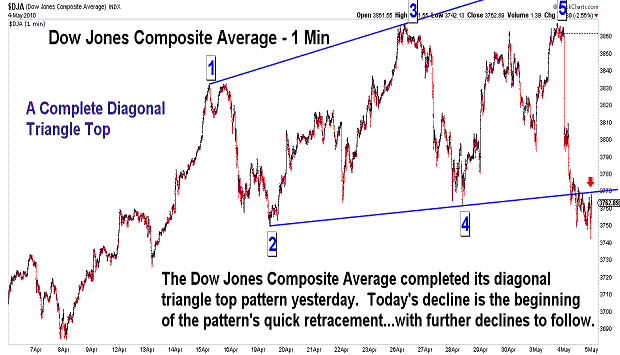
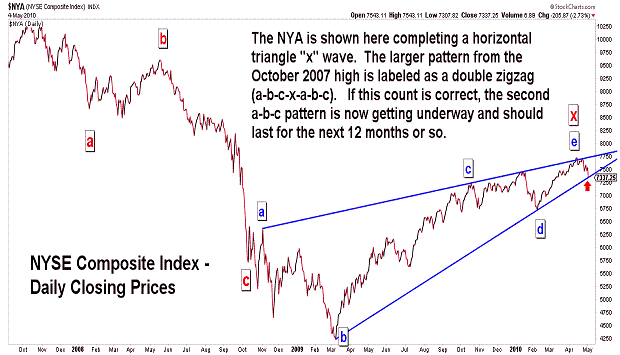
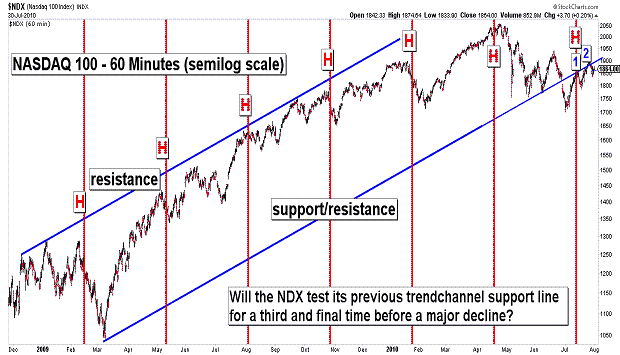
| May 4, 2010 update...Three days ago I said..."if my "b" wave horizontal triangle analysis is valid, we should see a break of the triangle's baseline in the coming days." The triangle's baseline WAS broken today on a semilog scale basis (see first chart)...providing the first step of a confirmation process for an intermediate term decline. Step 2 of the process will occur when support is penetrated on the arithmetic scale chart...currently around 10750 (see second chart). Please note on the fourth chart that the NYSE Composite today became the fist indice on an arithmetic scale to close on its (triangle baseline) support line. While the Dow Jones Industrial Average made its recent high 8 days ago, the Dow Jones Composite Average made its high yesterday...completing a diagonal triangle pattern (see third chart). Today's action was fully in line with the type of action that should follow the completion of this type of topping pattern. I expect to see more downside action in the coming days and weeks followed by brief rallies that retest support lines that are broken along the way down. |
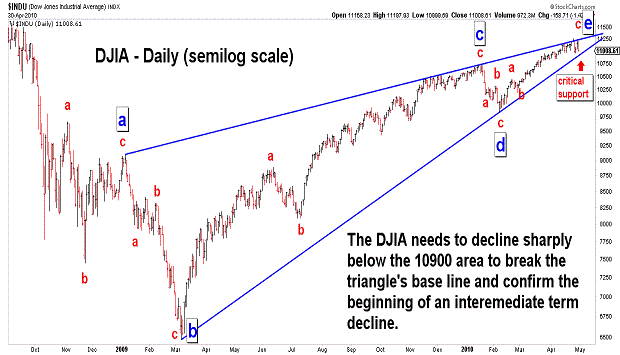
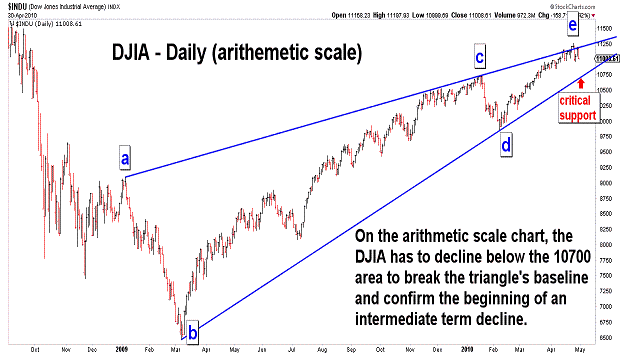
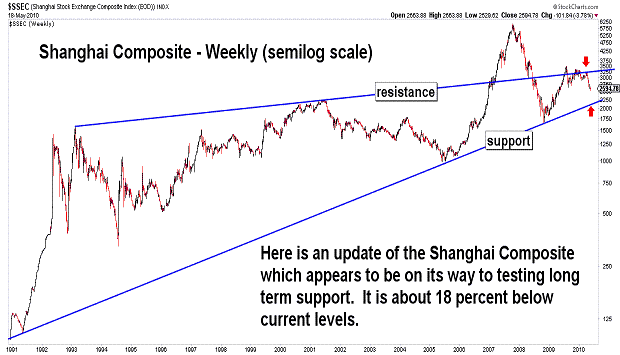
| May 1, 2010 update...Here are some charts updated through yesterday's close. Key support on the DJIA semilog scale chart is the 10900 area...key support on the DJIA arithmetic scale chart is the 10700 area. If my "b" wave horizontal triangle analysis is valid, we should see a break of the triangle's baseline in the coming days and then a retest. A much sharper decline would follow the retest. Take a look at the third chart which shows the Greece stock index. It may be providing a roadmap of market action to come. |
| April 28, 2010 update...I am home following surgery on Monday morning. I was knocked out while the market was making a top that day...and I really do hope that it was THE top. The rally since the beginning of February has been painful to those of us who are long term bears...and the painkillers I am now taking do not provide any relief from that. I said last Friday that the "b" wave horizonal triangle pattern "...would look even better with a final throwover above the upper boundary line and then a quick reversal below it." Well, I got my wish. You can see Monday's tiny throwover and yesterday's nice reversal lower on the frist chart above. Now there has to be persistent follow through on the downside in the coming weeks. Another rally above Monday's high will diminish the likelihood of my wave count. Let's see what happens. I'll also keep you posted on any developments regarding my health and the near term schedule of updates. |
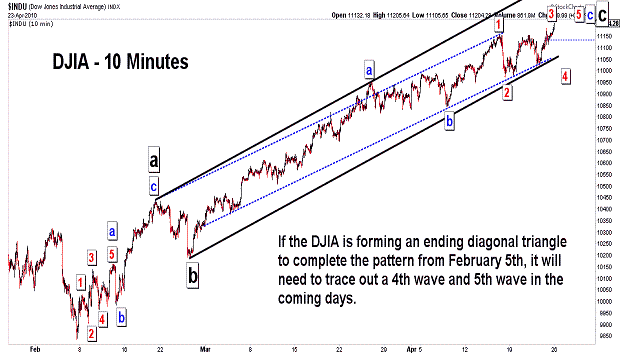

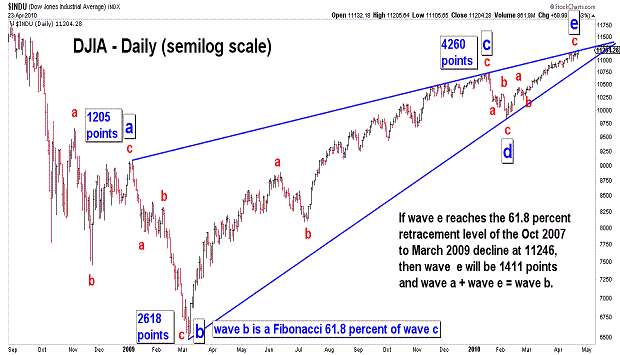
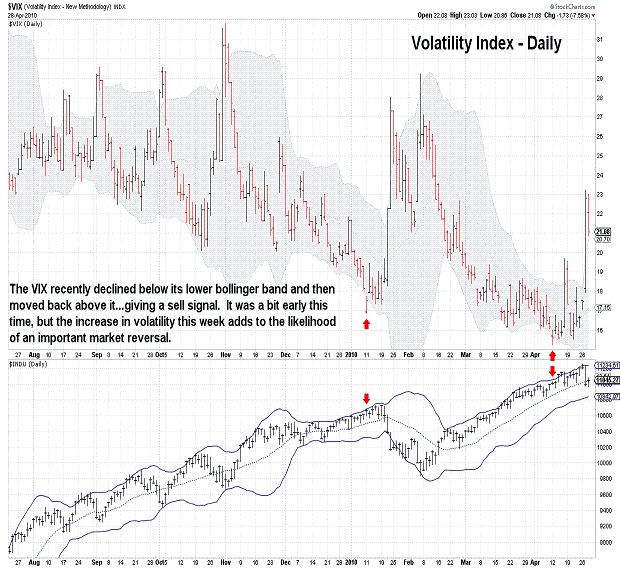
| April 23, 2010 update...While the DJIA did not top out Wednesday or Thursday as suggested by some Fibonacci time relationships, it still appears to be in the latter stages of a topping pattern. The Fibonacci 61.8 percent retracement point of the October 2007 to March 2009 decline is now only 42 points away from today's close. So, a top in that area seems like a good possibility. I would consider today's close of 11204 to already be close enough to be deemed a valid test of that retracement level...but, we may get even closer next week. In fact, the DJIA's pattern would look best (to me), if we get a wave 4 pullback...and a final wave 5 rally to complete an ending diagonal triangle. There is no requirement that the rally pattern from the February 5th low end with a diagonal triangle...but, each of the previous rally patterns since March 2009 has ended that way. So, why not one more time? As I have discussed in recent updates, my preferred long term wave count is that of a horizontal triangle pattern since October 2008. I think it now looks best on a semilog scale chart...and it would look even better with a final throwover above the upper boundary line and then a quick reversal below it. That is what I will be watching for next week. A final note: I will be having surgery Monday morning...a parotidectomy. I should be home by Tuesday...and, if well enough, I will post the next update on Wednesday. If I am unable to do so, I'll try to post a message. |
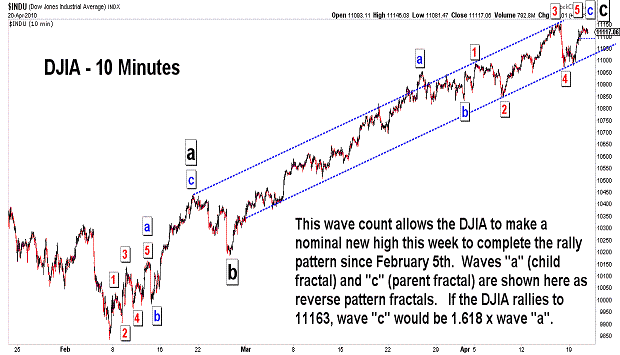
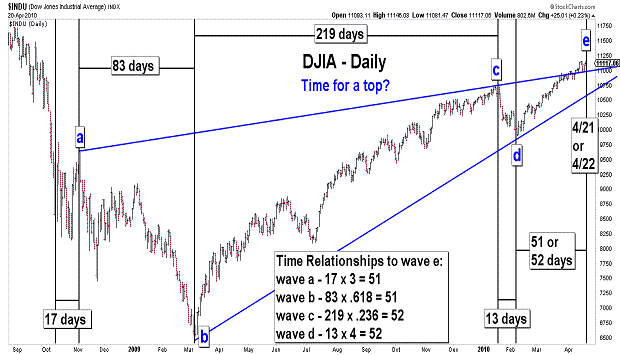
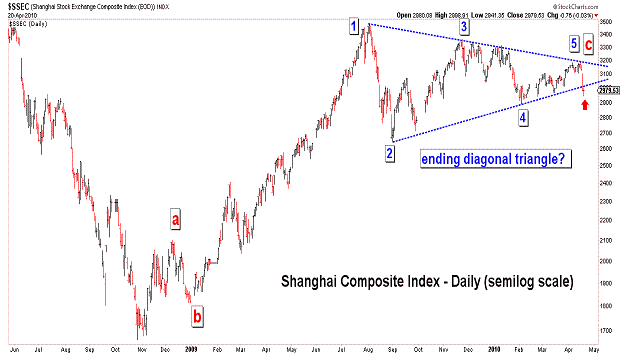
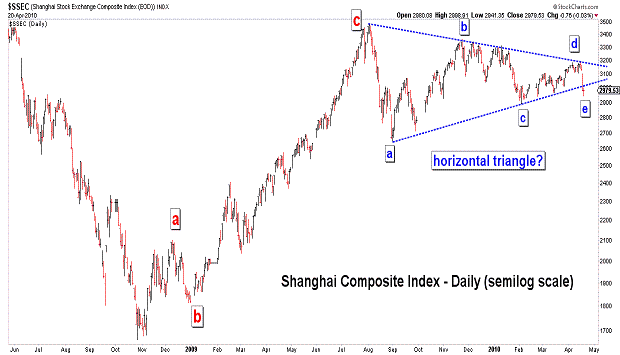
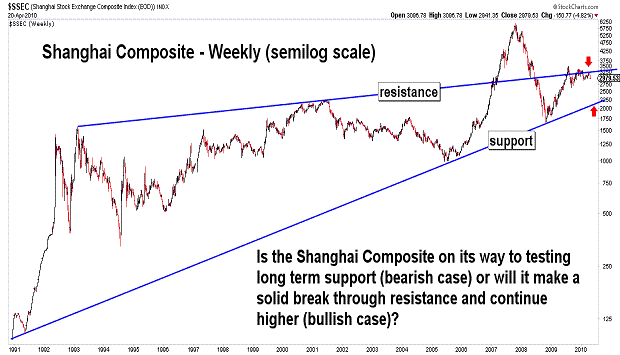
| April 20, 2010 update...The DJIA failed to follow through with more selling yesterday and today after Friday's sharp decline. I indicated on Friday that the DJIA would have to decline below 10850 to confirm that a top was in place...and it did not. So, with the DJIA only 37 points away from last Thursday's intraday high, it is likely that a new high will be achieved. If my wave analysis is correct that the DJIA has traced out a horizontal triangle since October 2008, Fibonacci time relationships suggest that the high will occur tomorrow or Thursday. In addition, price and pattern relationships would be ideal if the DJIA tops out around 11163...but, that is not absolutely required. The previously discussed 11246 level is also a possibility. Finally, keep your eye on the Shanghai Composite in the coming days for a clue about our markets. The Shanghai index has traced out a triangle pattern and is on the verge of a sharp move. Which way depends on whether the triangle is an ending "diagonal triangle" (bearish case) or "horizontal triangle" (bullish case). It should become quickly evident in the coming days. |
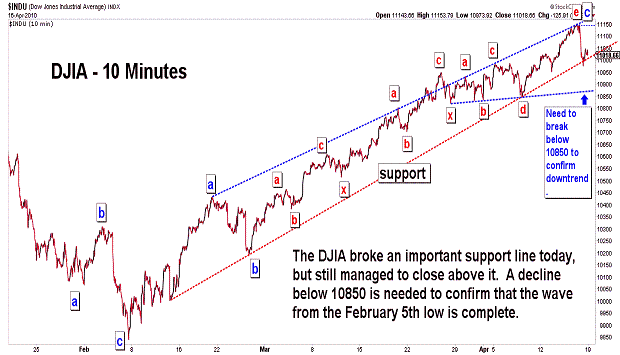
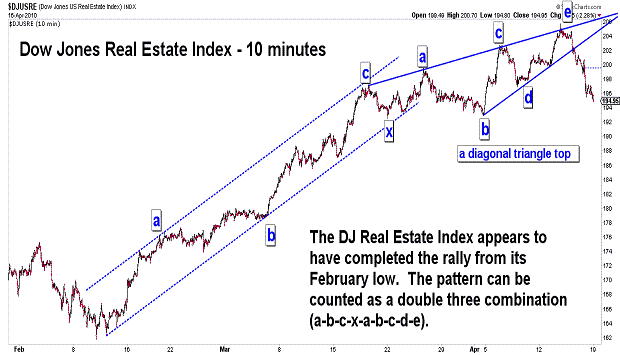
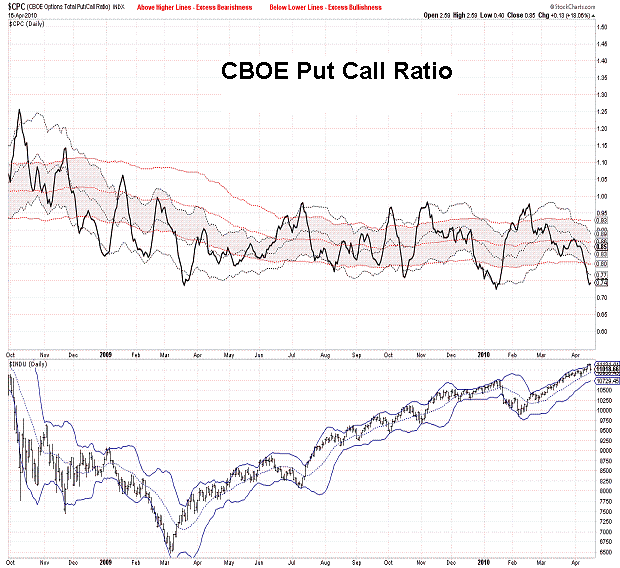
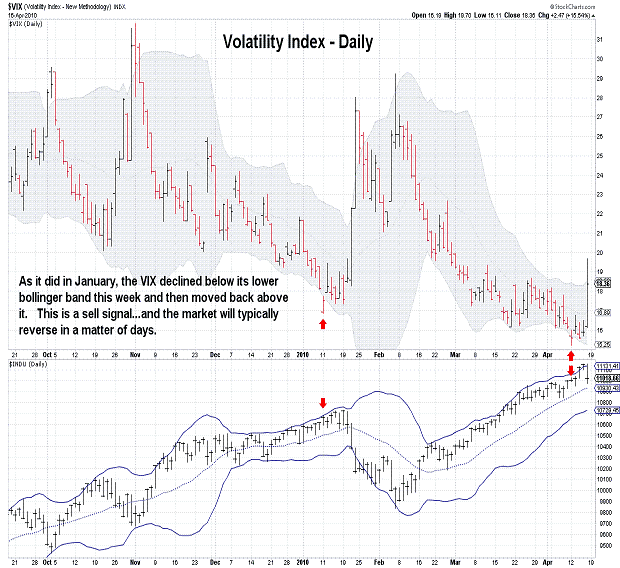
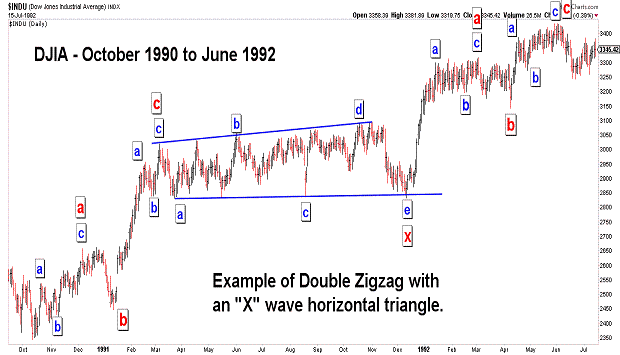
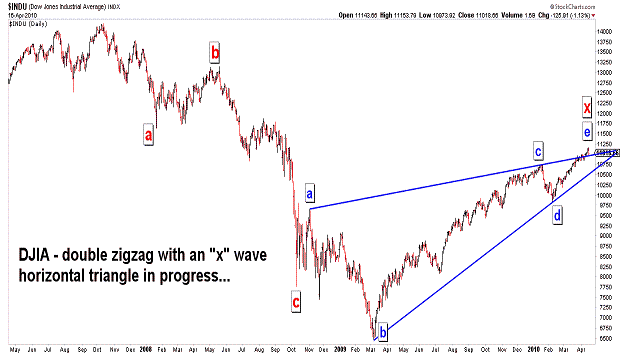
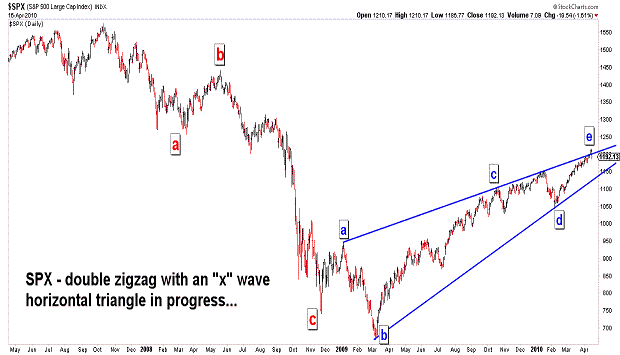
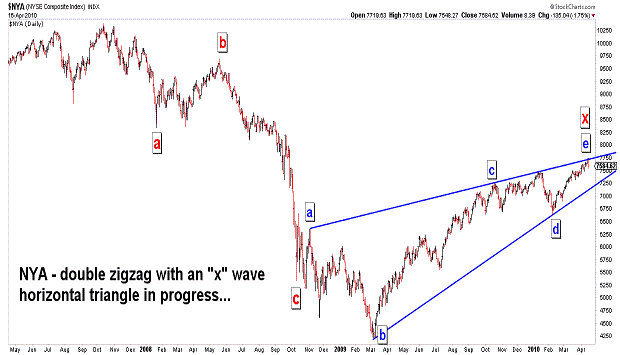
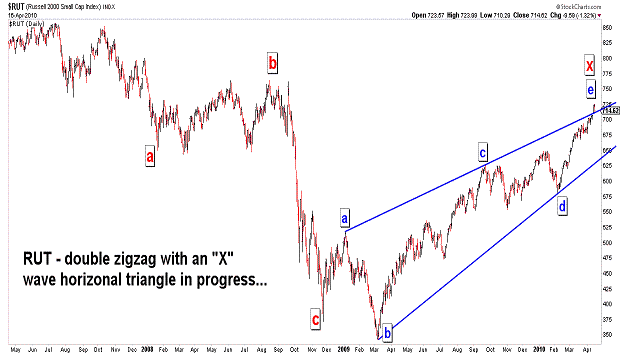
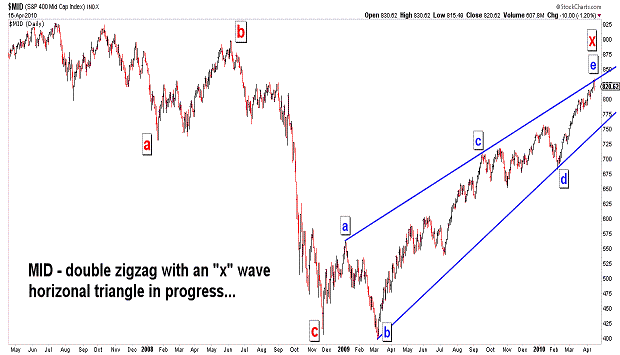
| April 16, 2010 update...The DJIA took back its gains of the past two days and closed just below Tuesday's closing level. Today's decline was the largest since February 4th...49 trading sessions ago and one day before the February 5th low. The DJIA and NDX closed the week slightly higher. But, several indices...i.e., NYA, OEX, SPX, XII...ended the week on the downside forming key reversal patterns on their weekly charts. While a final top for the rally since February 5th has not yet been confirmed, today's strong decline was a good first sign. On Wednesday, I said: "...a reversal must begin tomorrow, or the triangle analysis will be invalidated." The reversal did begin yesterday about 3:00 pm and accelerated today. My recent analysis that the rally was concluding with an ending diagonal triangle will remain valid as long as yesterday's high remains in place. Speaking of triangles, I can now see complete (or nearly so) "x" wave horizontal triangles on most of the broad stock indice charts. Some may disagree with this long term wave count (Prechter told me yesterday that he thinks this count breaks Elliott rules), but I think it does work and does conform to all of Elliott's rules. I will admit, however, that the formation is very steep and contrasts with the more typical horizontal triangle sideways pattern (see example above from 1990-1992). Assuming it is valid, and the triangle is the "x" wave of a "double zigzag" pattern as I have suggested on the charts above...the next decline should be similar in size and character to the decline that preceeded the triangle's formation. Remember September/Octber 2008? If we do, in fact, get that kind of action, I will know what to expect for the next year. |
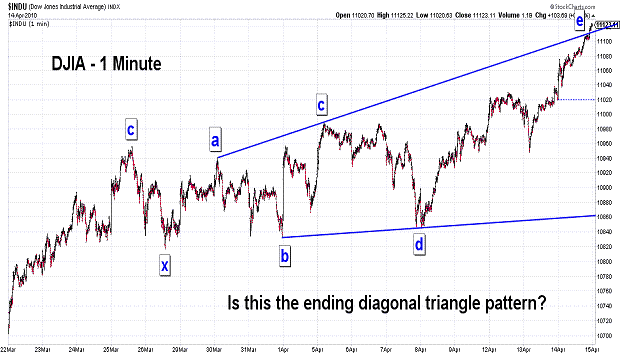
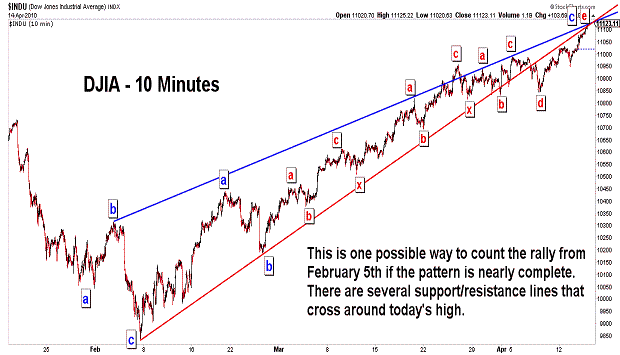
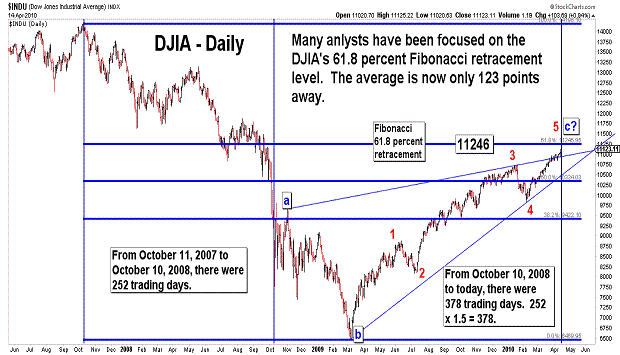
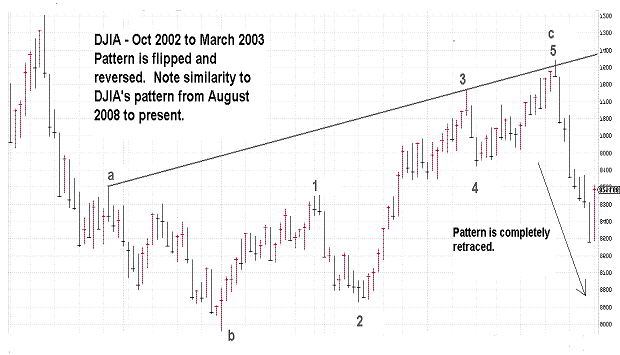
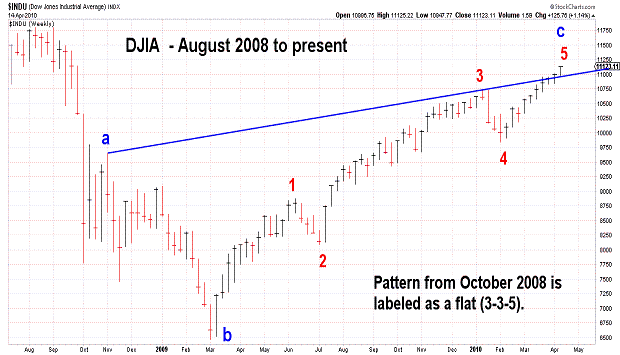
| April 14, 2010 update...Today's strong rally threw a monkey wrench into my recent view of an ending diagonal triangle top for the DJIA. An ending triangle pattern, however, can still be counted into today's high, if the first wave of the triangle begins on March 30th, rather than March 25th. The upper boundary line of the triangle is thus much steeper than I originally thought it would be. But, the fact of the matter is this: a reversal must begin tomorrow, or the triangle analysis will be invalidated. Technical analysis has been useless for weeks now as the market's momentum has carried it steadily higher. Maybe the 61.8 percent retracement level of 11246 that has been a known Fibonacci target for months now will draw the market to it. Usually, however, when there is such an overwhelming focus on a particular number, it is either exceeded or not reached at all. We'll see. For some time now I had been trying to remember when I had last seen a pattern that was similar to the DJIA's pattern since 2008. I finally found it...it's the fourth chart above. It keeps the long term bearish view alive. |
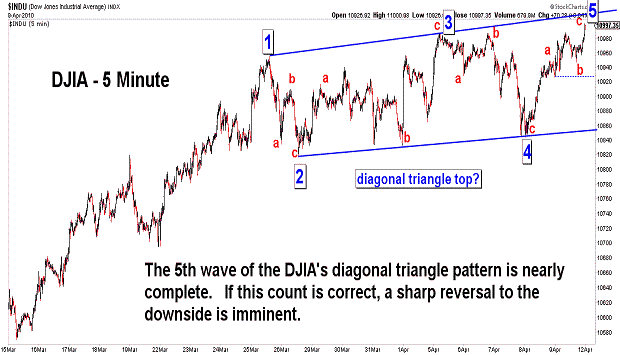
| April 9, 2010 update...As I suggested in Tuesday's update, the DJIA has now traced out the 4th and 5th waves of a diagonal triangle top. If the pattern is correctly labeled, a major reversal is imminent...and will begin once the 5th wave of the triangle is complete. Take a look at the diagonal triangle that ended on January 19th. It should serve as a good illustration of what the reversal should look like when it does begin. Anything other than that will cast doubt on the validity of the triangle analysis. As for the DJIA's longer term pattern, there are a number of possible ways to count it. Lately, I have grown partial to the "b" wave contracting triangle count because of the many mathematical price and time relationships that it provides between the various waves. If the count is valid, the (c) wave of the pattern from the October 2007 high is about to begin...and it should take the form of a double zigzag...just like wave (a) of the pattern. It should also last about 12 months...just like wave (a). Will it also decline by 6300 points like wave (a)? We'll see. |
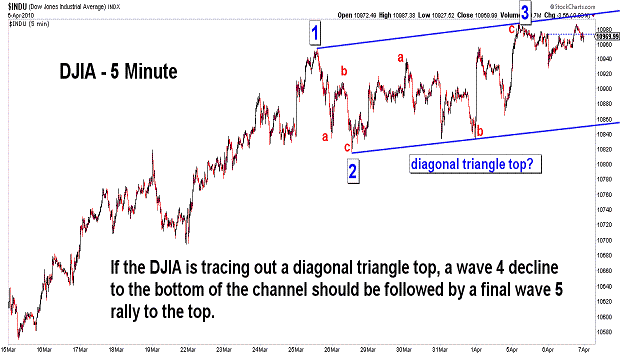
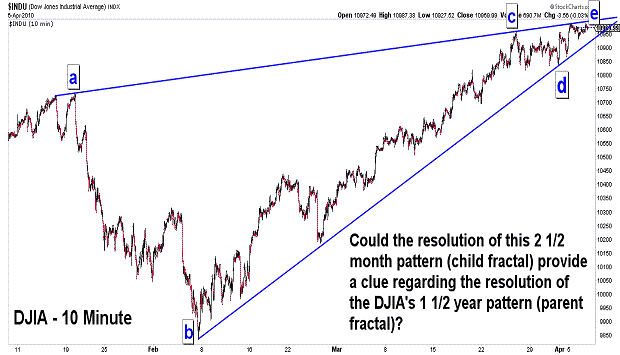
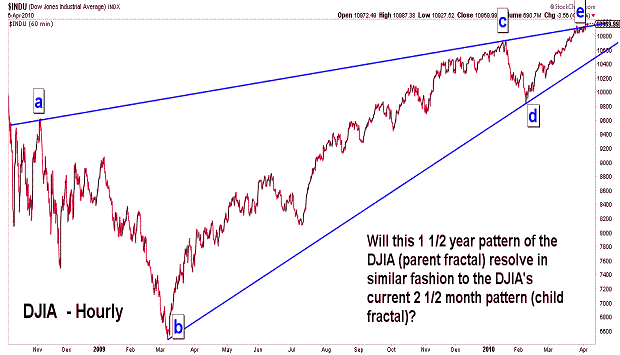
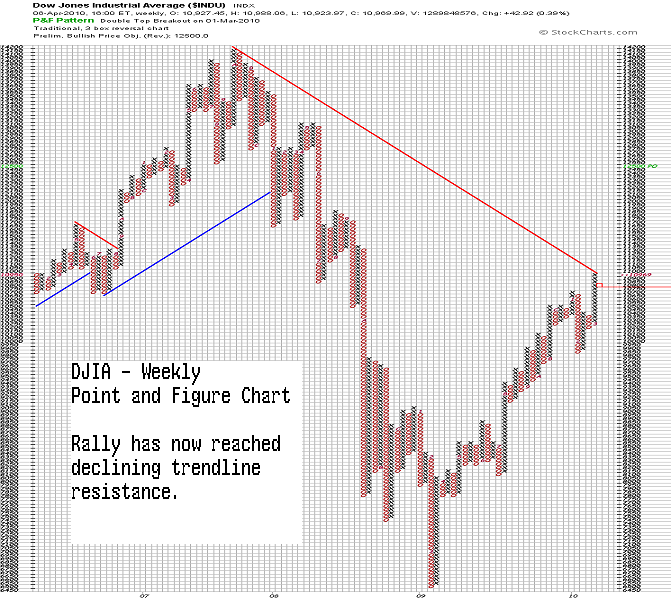
| April 6, 2010 update...If the DJIA is tracing out a diagonal triangle top, as I described and illustrated in the last update, a wave 4 decline to the bottom of the trendchannel should be next. That would be followed by a final 5th wave rally back to the top of the trendchannel to complete the entire rally from the February 5th low. Should the pattern, in fact, develop in this manner...the longer term rally from the March 2009 low and its encompassing wave pattern (of one larger degree) would also be countable as complete. A major decline would be next...the extent of which would depend upon the correct labeling of the waves since the October 2007 high. While there are a number of wave count possibilites at this point, I am currently leaning to the most bearish of them all. The character and strength of the next decline should, however, provide some clues. A decline in the next day or two significantly below 10800 would likely suggest a top is already in place...and eliminate the diagonal triangle top scenario. |
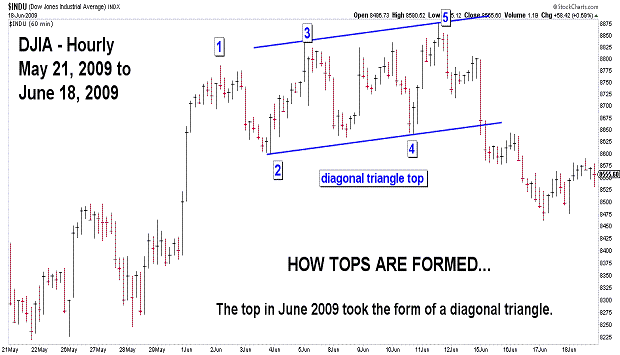
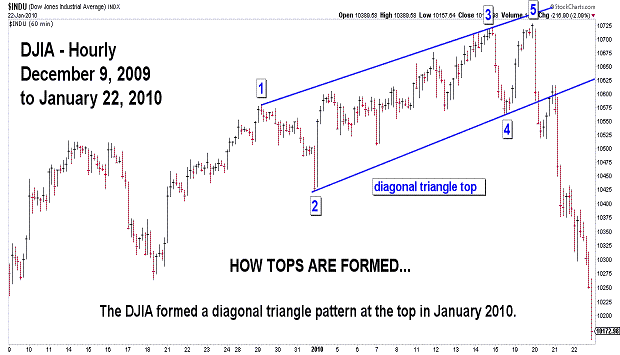
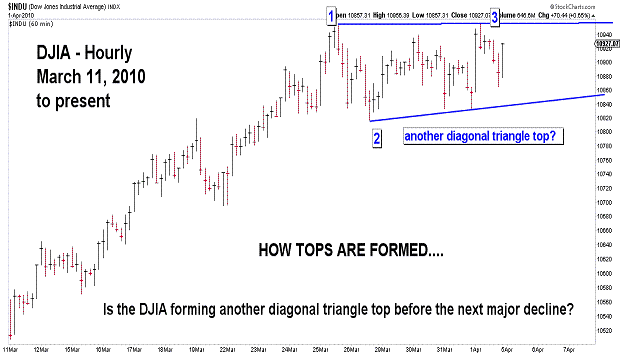
| April 3, 2010 (holiday) update...Since the March 2009 low, the DJIA has had only two signficant declines...each of around 8 to 9 percent. Both were preceeded by diagonal triangle topping patterns (see first two charts above). With that in mind, it is likely to expect the next top to be formed in the same fashion (see third chart). We'll see. Finally, I noted something last week which may or may not be important, but I thought it was interesting. At the January 14th to January 19th top, the DJIA made a new actual intraday high on the 19th...but, it did not do so on a theoretical basis. The same thing happened last week. The DJIA made a new intraday high on Thursday that exceeded the March 25th intraday high by one point. It did not, however, make a new high on a theoretical basis. |
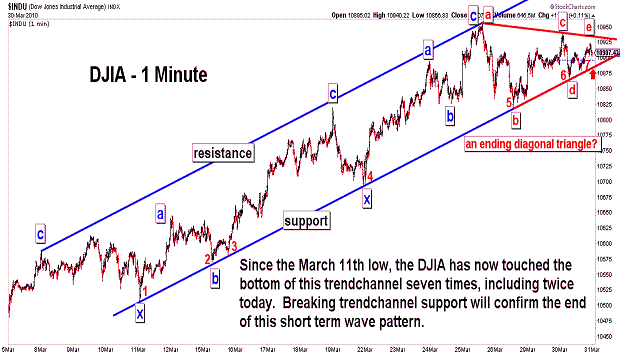
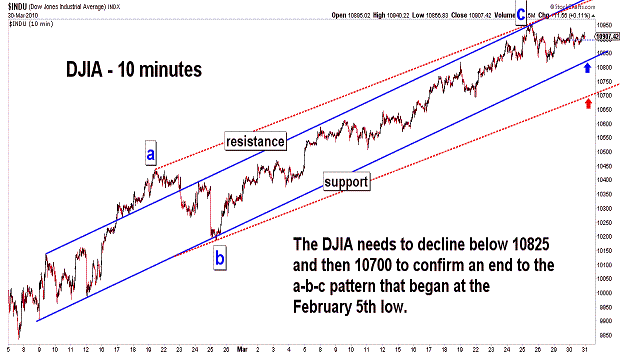
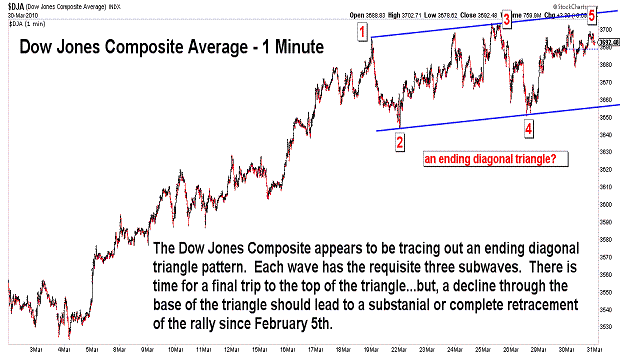
| March 30, 2010 update...There is little to add to Friday's comments. The stock market indices have moved in very narrow ranges so far this week. The DJIA has bounced several times at the bottom of its short term trendchannel (see first chart)...but, has failed to rally above last Thursday's intraday high at 10955. Several indices, like the Dow Jones Composite Average (see third chart), appear to be tracing out ending diagonal triangle pattens. If that interpretation is correct, there should be a resolution of it within the next day or two...which should lead to a signficant, if not complete, retracement of the rally since February 5th. The other possibility I see is a continuation of the topping process with a larger ending diagonal triangle pattern still unfolding. We'll see. |

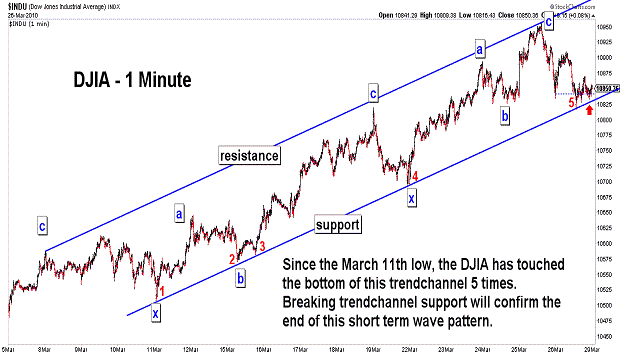
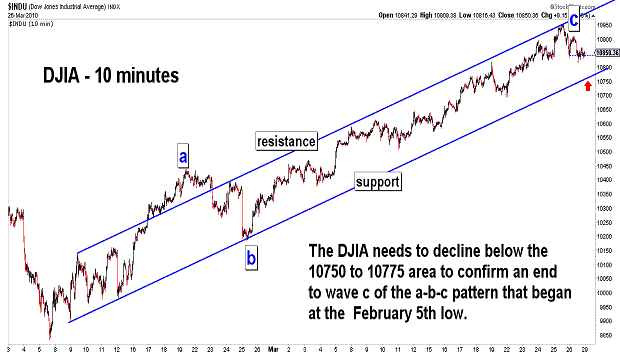
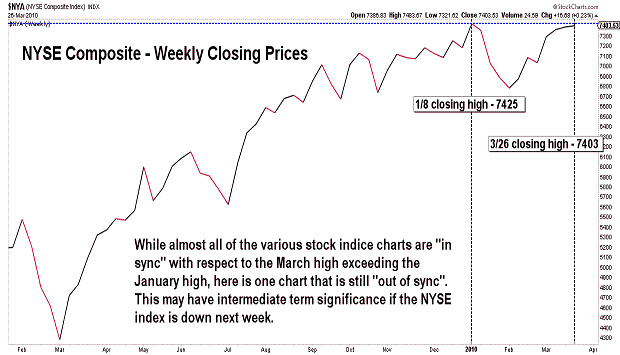
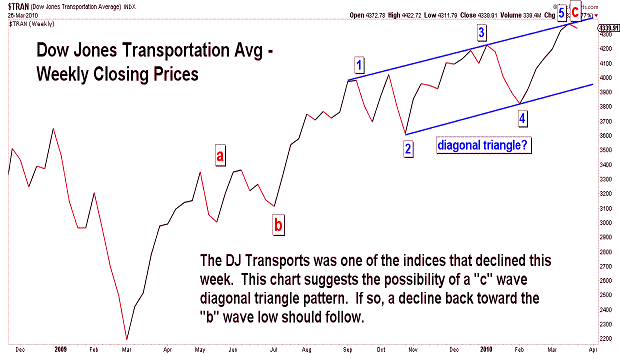
| March 26, 2010 update...On a very long term basis, this week's rally took the DJIA back to the top of a multi-decade trendchannel. IF the DJIA is tracing out a SUPERCYCLE degree Bear Market, an important top should now be forming. That top could develop in the form of a diagonal triangle pattern...in similar fashion to the "drawn out" tops that occurred last June and January. The market's action over the next few days should provide the best clue. Anything short of an immediate powerful impulse to the downside would suggest (to me) that the DJIA is likely tracing out a complex diagonal triangle top. One interesting sign of a topping pattern can be seen in the NYSE Composite Index. While most indices rallied to new intraday highs yesterday, the NYA failed to exceed its March 17th high. Also, the weekly NYA chart of closing prices has yet to exceed its January high (see fourth chart above). This is the only instance I can find of a failure to make a new high this month among the various broad stock indices. |
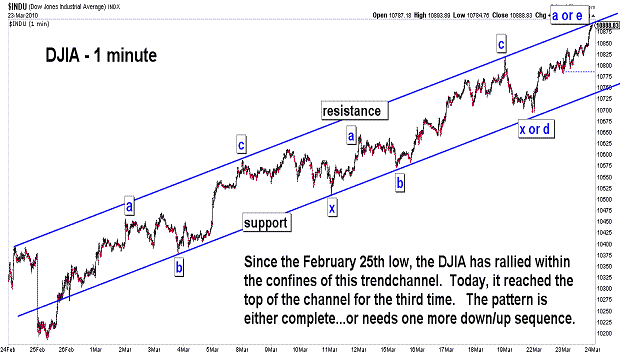
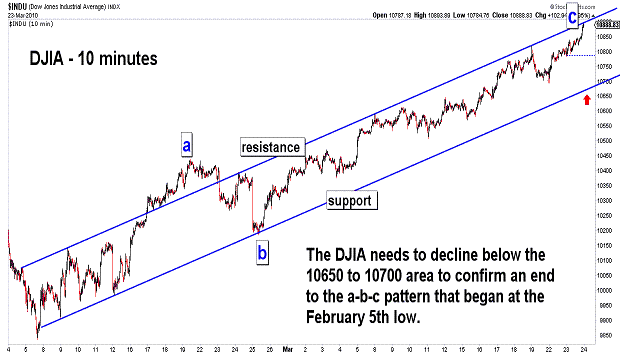
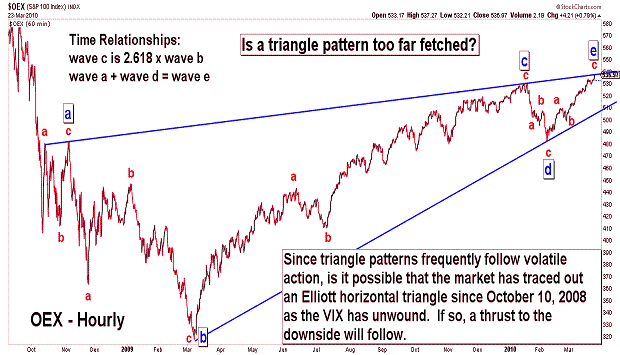
| March 22, 2010 update...As you can see in the first two charts above, the DJIA spent the first two days of this week climbing higher within its narrow rising trendchannel. At the close today, it reached the top of that trendchannel. A pullback (or pause at the least) is likely over the next day or two. I think a final top for the pattern would look best with the formation of a diagonal triangle. A trip back to the bottom of the trendchannel would be the most likely first step in getting the pattern started. I find the strength of the market this week surprising given the excessively bullish sentiment (see fourth chart) and very overbought technical condition. But, this type of action does occur near important turning points...when the market goes beyond one's rational expectations. Like a stretched rubber band, the market at some point does snap back. And belive it or not, there is one Elliott wave pattern that provides this very action, i.e., a thrust. The third chart illustrates what may be a far fetched view of the OEX's pattern since October 10, 2008...an Elliott horizontal triangle. Although a few of the waves are small relative to the others, each of them does subdivide into a requisite three wave corrective pattern. At the conclusion of the triangle pattern, there is a thrust equal to the width of the triangle in the opposite direction (down in this case). Anything other than this would invalidate the triangle analysis. We'll see. |
March 19, 2010 update...4 days UP in the DJIA this week...1 day DOWN. Today's key reversal day finally ended the DJIA' s eight day winning streak...but, it hardly made a dent in the chart's overbought condition. Wednesday's rally to a new recovery intraday high (as well as closing high) did allow the charts to once again "synch up" as I discussed last Friday. That situation, however, left many Elliott wave analysts, including myself, with an apparent wave count dilemma. The DJIA (and some other indices) now seem to have charts with 5 wave advancing patterns from the March 2009 low. This would seem to be at odds with the view that the rally from last year's lows was corrective in nature. Let me explain why it is not! Clearly, each of the rally subwaves since March 2009 has produced an Elliott wave corrective pattern, i.e., my count suggests that they were double three combination patterns (a-b-c-x-a-b-c). The easiest way to correct the apparent problem is to label the rally from March 2009 as the "c" wave of an "inverted flat" that began October 10, 2008. I think that this is not only a valid count, but a likely count as well. Whether or not it is, in fact, the correct count will depend on the market's action in the coming months. All the Elliott wave and technical factors that I look at are extremely bearish...and that is certainly consistent with the ramifications of an "inverted flat" wave count (extremely bearish).
The stock averages actually gained less this week than it seemed. In fact, one index - the Russell 2000 - lost ground. So, was today THE top or, possibly, the beginning of a top? Too early to say, but the signs of an important top continue to accumulate. |
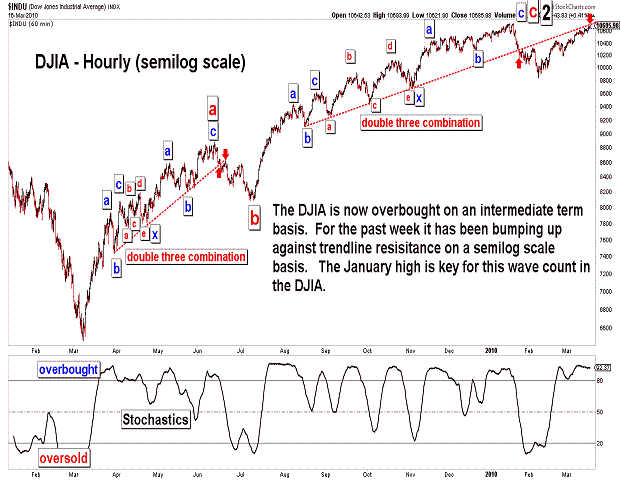
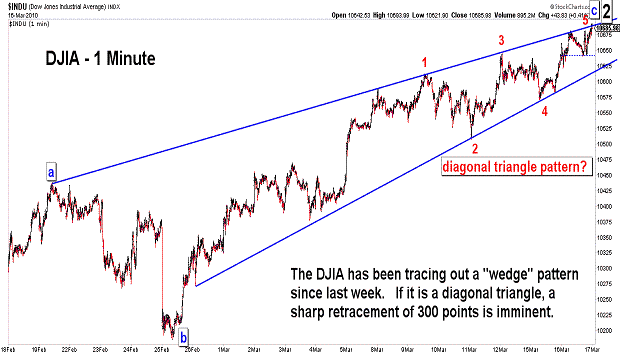
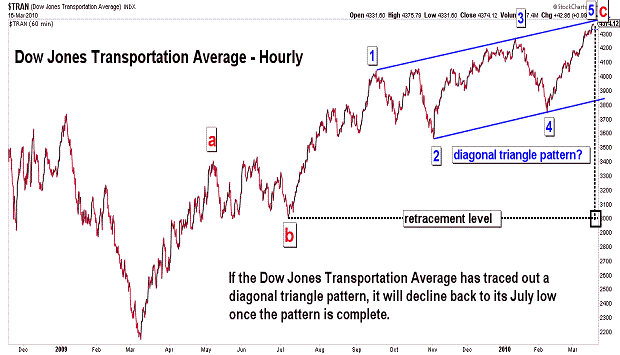
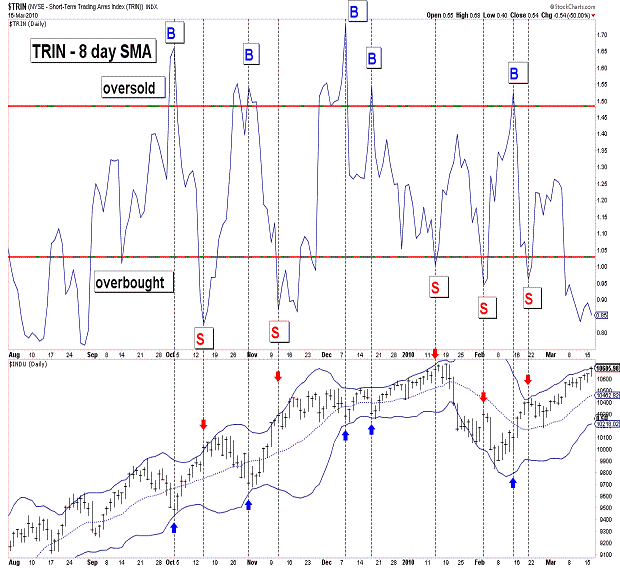
| March 16, 2010 update...The DJIA has grinded out about 60 points this week...and is now only 44 points away from its January 19th intraday high. I remain bearish because all of the rally patterns since last year's low have been corrective in nature. The rally from the February 5th low is no exception (see DJIA charts above). Even if the rally does exceed the January 19th high, this fact will not change. It might change the longer term count somewhat...but, the July 2009 low remains my target for the intermediate term. The most bearish wave counts out there suggest that this could happen rather quickly. Others allow for a more gradual decline. The strength of the next decline will provide the best clue. Let's see what happens when the DJIA breaks critical support around today's low, i.e., 10621. |
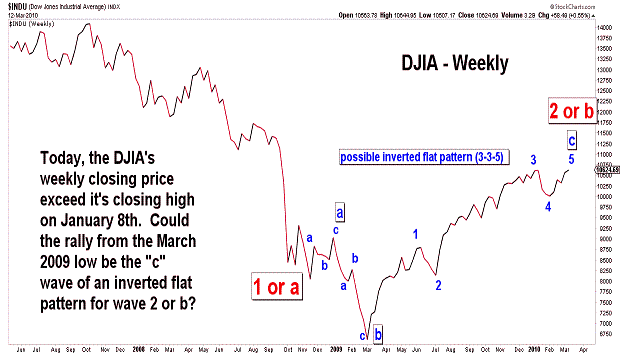
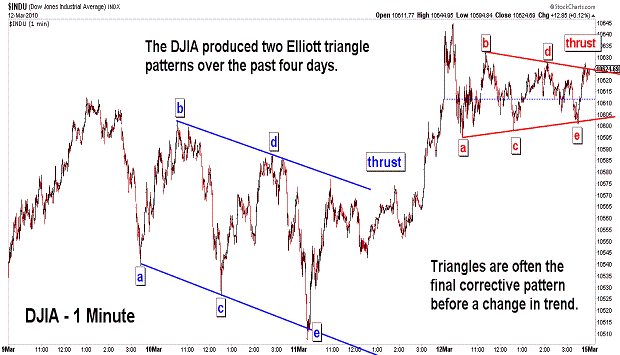
| March 12, 2010 update...The DJIA rallied only about 1/2 percent this week...but, it did close the week 6 points above its January 8th weekly closing high of 10618. The weekly closing chart is now out of sync with charts of shorter time durations. In most cases, these charts will eventually "sync up" with the weekly chart...which means that the DJIA will exceed its January 19th high of 10729. There are, of course, exceptions (see May 18, 2001 - this divergence lead to a 29 percent decline). As pointed out in the last two updates, the market has been trading at an extremely overextended level on a technical basis...and it is even more so today. Sentiment has finally joined other indicators pointing to an important top (see fourth chart above). The market can certainly hold up for a short time...possibly tracing out a diagonal triangle topping pattern. Major turns often occur near the spring equinox...so, a reversal is possible anytime (see March 2007, 2008 and 2009). The best indication of the reversal will be a sharp increase in the volatility index (VIX). Obviously, this would be caused by a sharp market decline. |
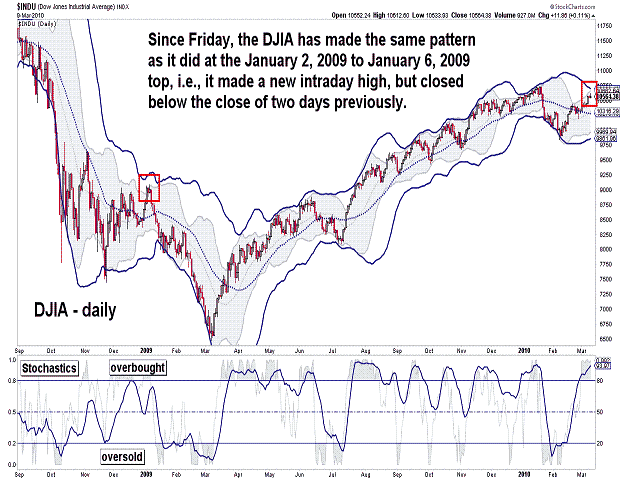
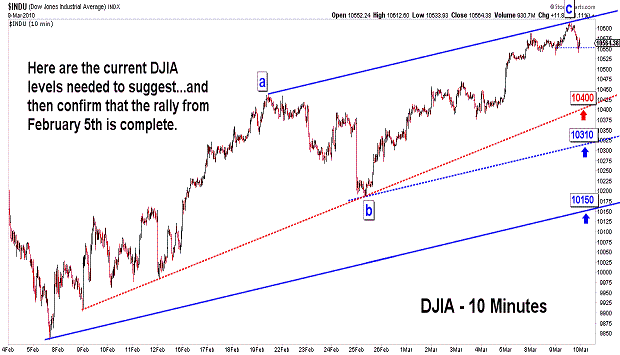
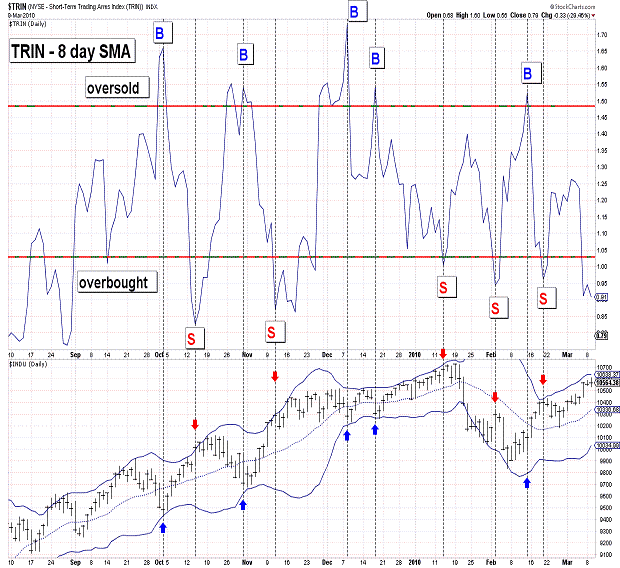
| March 9, 2010 update...Depite today's higher close, there were more technical signs of a top for the rally since February 5th. Today was an outside day for the DJIA, i.e., today's high was higher than yesterday's high and today's low was lower than yesterday's low. In general, on such days, it is a positive sign if the market closes in the upper half of its range...and negative if it closes in the lower half. Today, the DJIA closed in the lower half of its range. Not only did the DJIA close below the midpoint of its daily range, it closed below its Friday close. This same pattern occurred at the top in early January 2009 (see second chart above). One other similarity between early January 2009 and now was the occurence of the 42 day CYCLE turn date (see first chart). Same pattern...same CYCLE...I find that very interesting! On Friday, I said that "the fly in the ointment...is sentiment, i.e., the CBOE put call ratio is in neutral territory." The (equity) put call action this week is finally moving towards an excessively bullish level, i.e., a top (see fourth chart). All of the other Elliott wave and techncial reasons for a top mentioned on Friday still apply. We'll see if the market gets the message! |
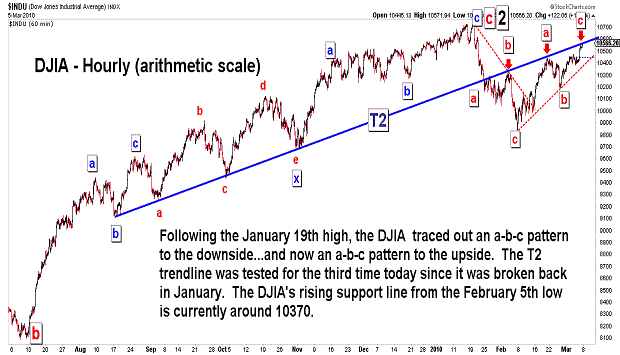
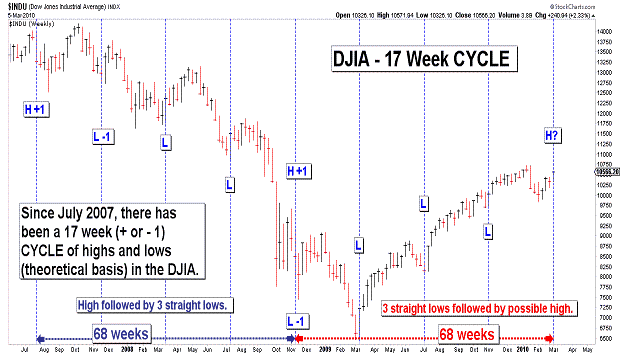
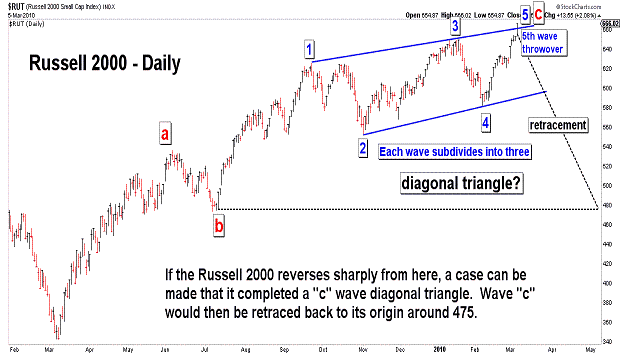
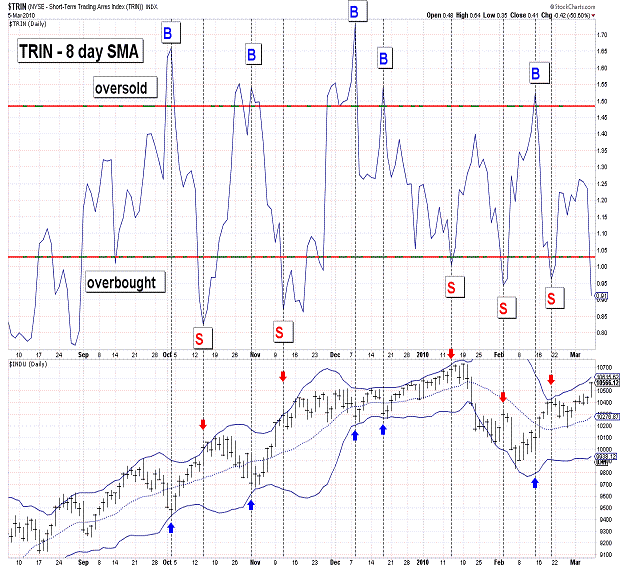
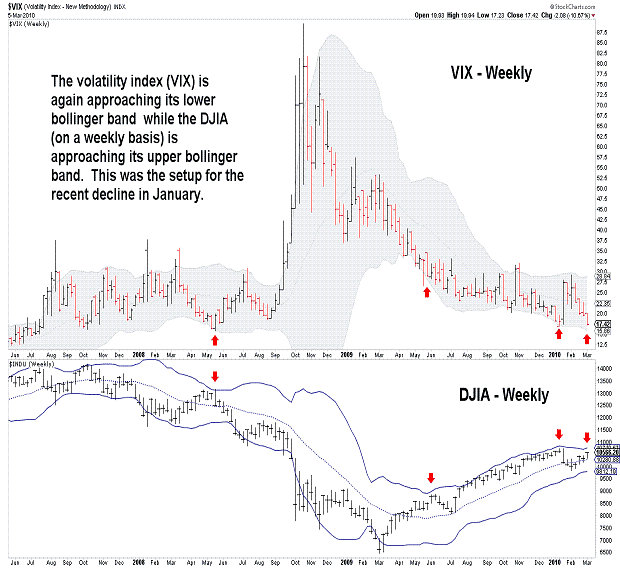
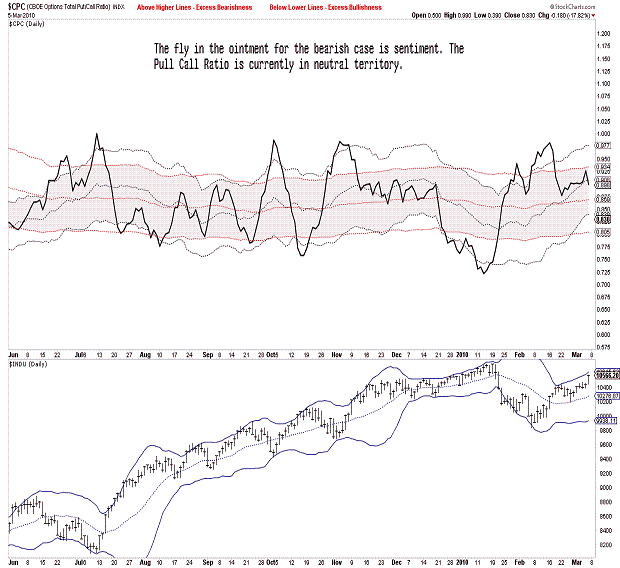
| March 5, 2010 update...Today's rally brought the market to a critical juncture. Either it turns down early next week...or it continues higher breaking major resistance barriers and casting doubt on the completion of wave 2 in January. Most of the technical indicators that I rely on support a major decline from here. See the first 5 charts above: stock market indices have reached their upper bollinger bands; they are overbought on a short term and intermediate term basis; TRIN is short term overbought; trendline resistance has been reached on a number of charts; VIX is approaching its lower bollinger band (a sell signal after a reversal); the 17 week CYCLE is suggesting a trend change is at hand. The fly in the ointment right now is sentiment, i.e., the CBOE put call ratio is in neutral territory (see last chart). As I mentioned in Tuesday's update, "it is...possible to see a diagonal triangle top forming in the RUT." Well, that top is now formed...IF the indice immediately reverses lower. As I also said on Tuesday, "the rules of Elliott wave analysis indicate a quick retracement back to the July 2009 lows" once the pattern is complete. If, on the other hand, the rally continues...the pattern is negated and something else is going on. Next week should be interesting! |
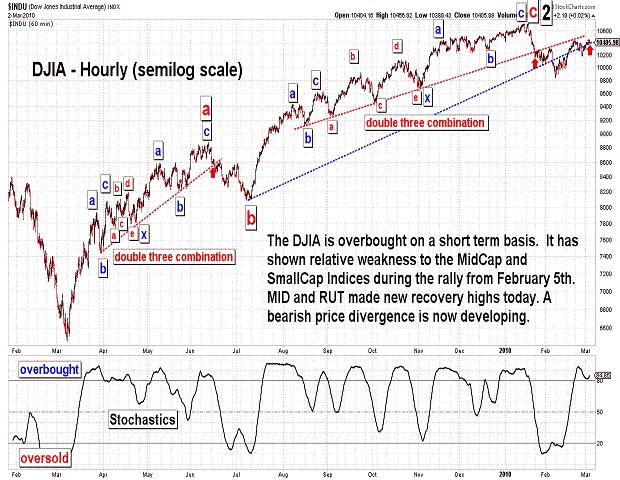
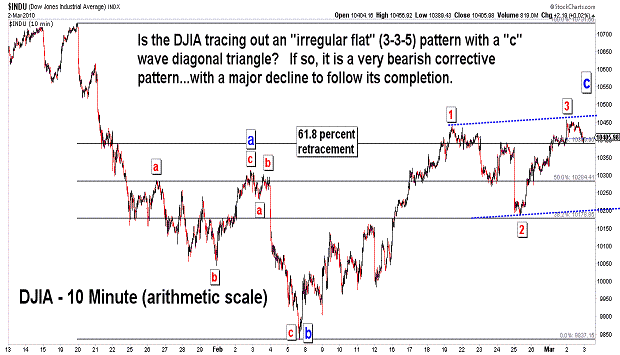
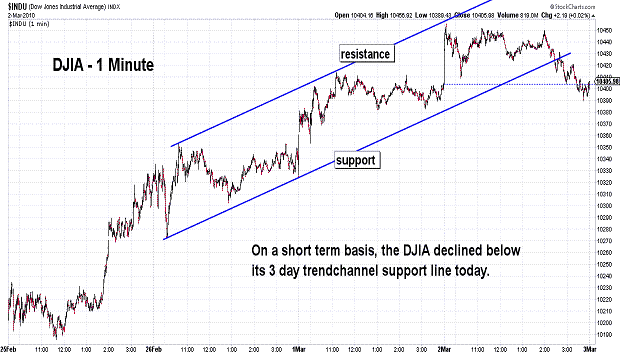
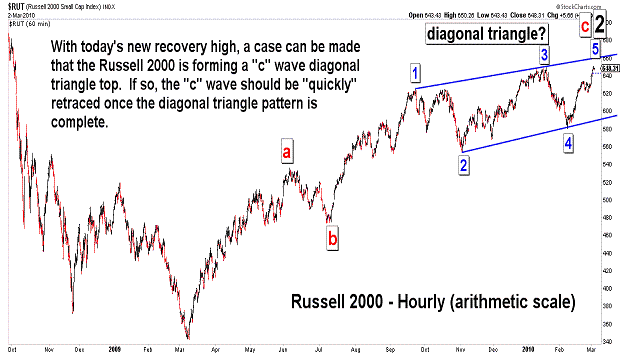
| March 2, 2010 update...Two stock market indices that I follow, the Russell 2000 and S&P 400 Midcap, made new recovery highs today...while most other stock indices were still well below their January highs. Technically, we now have a price divergence in place between market indices...which is a common occurence at major market turning points. Patternwise, it is now possible to see a diagonal triangle top forming in the RUT and MID indices (see fourth chart). It does not yet look complete...but once it is, the rules of Elliott wave analysis indicate a quick retracement back to the July 2009 lows should occur. As for the DJIA's pattern (see second chart), one possibility is an "irregular flat" corrective pattern...with a "c" wave diagonal triangle in progress. If so, a 4th wave decline is next. That would be followed by a final 5th wave rally to complete the a-b-c (3-3-5) correction from January 22nd. We'll see. |
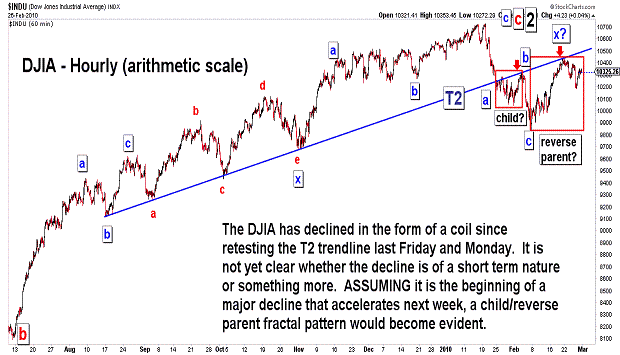
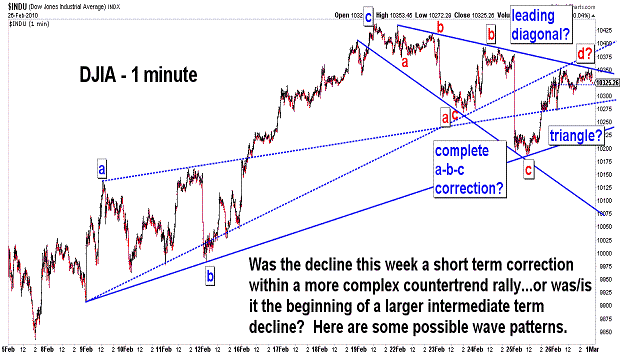
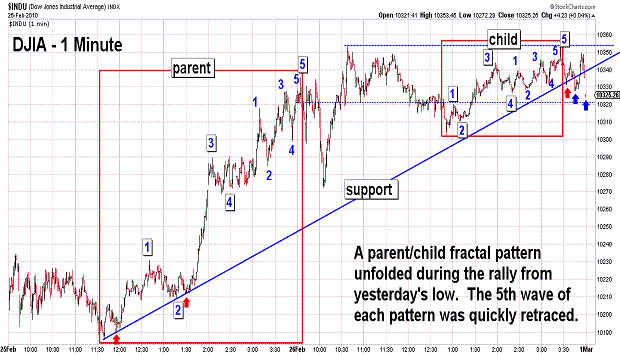
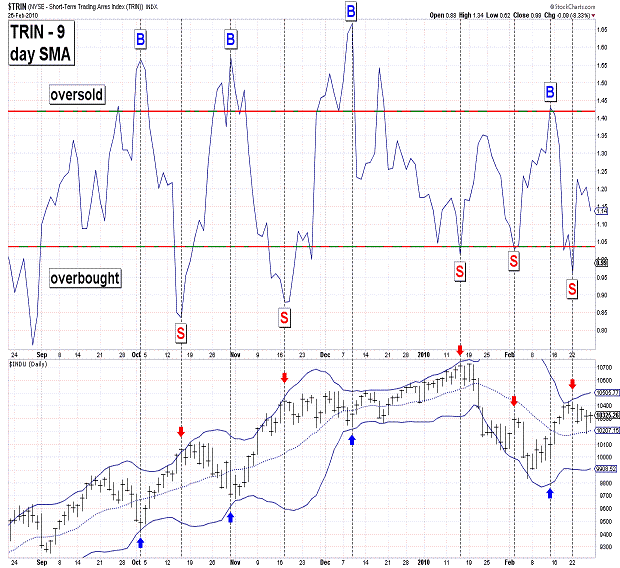
| February 26, 2010 update...The stock market declined this week...but, not very much. On Tuesday, I suggested that "...(i)f the market...holds in (the 10150-10250) area, move corrective action will likely follow." Yesterday, the DJIA declined to 10185...held...and today rallied back to the declining resistance line from last week's high. That line is now critical to the market's action next week. If the DJIA breaks through it on the upside, the countertrend rally from the February 5th low will continue to subdivide and unfold in a more complex manner. If the line holds, and the DJIA retreats below 10185, I can see two immediate wave count possibilities. The first is a triangle pattern if the DJIA declines (in three waves) to the area of its declining support line (from last week's high)...holds...and reverses sharply to the upside (a thrust). The second is a leading diagonal pattern that leads to an accelerated decline. This would be the next "a" wave of an unfolding double or triple three combination pattern (double: a-b-c-x-a-b-c, or triple: a-b-c-x-a-b-c-x-a-b-c). There may be alternate ways to count this pattern as well, including a "c" wave or "3rd" wave...but, that depends on the internal wave structure of the next pattern to the downside. Note in the last chart that the TRIN gave a sell signal at the recent high...and has not yet suggested that a reversal is imminent by giving a buy signal. |
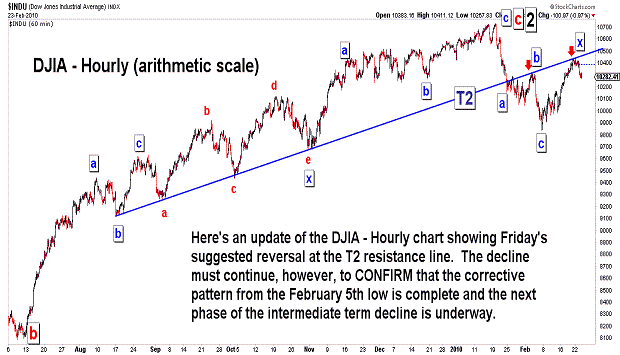
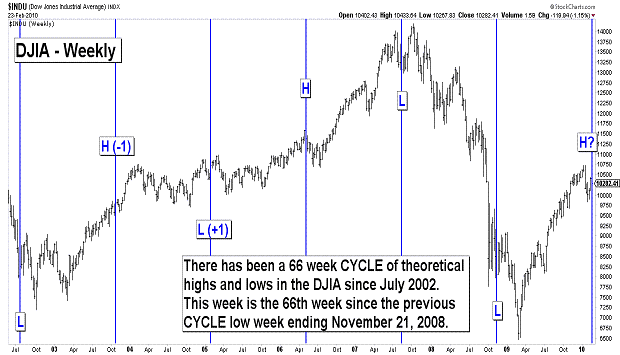
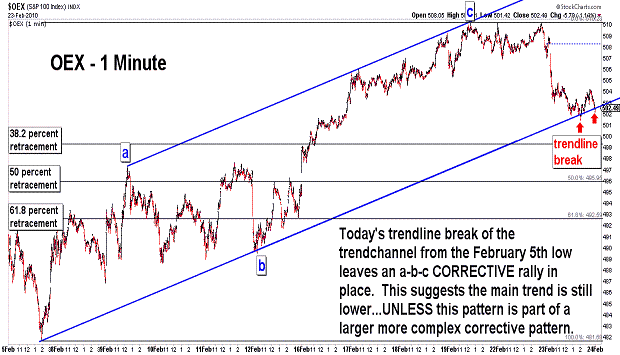
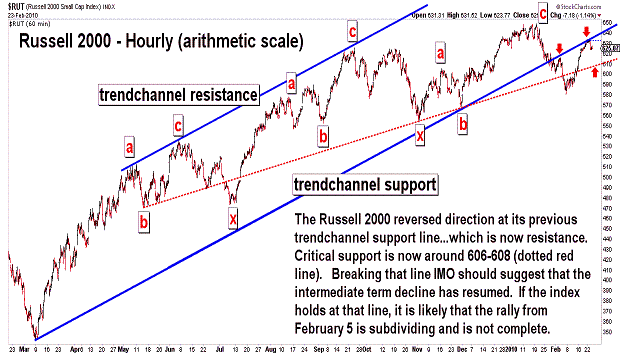
| February 23, 2010 update...On Friday I pointed out that the DJIA and other stock indices "had reached important resistance levels in terms of both trendlines and Bollinger bands." I suggested a reversal was likely...but, I was not sure if the reversal would be the beginning of the next phase of the intermediate term decline, or whether it would be just short term in nature. The decline did, in fact, begin yesterday...but it has not yet been large enough to clear up the intermediate term vs short term dilemma. If the 66 week CYCLE is still in effect (see chart above), there is a high probability that the current decline will be quite substantial. That CYCLE has worked since 2002...but, many other long term cycles have failed to work this year. So, I won't overemphasize its importance at this point. Sentiment is neutral right here...and not helpful. The action of the market itself should provide the best guidance. A quick decline below 10150-10250 would suggest to me that the next wave lower is underway. If the market instead holds in that area, move corrective action will likely follow. |
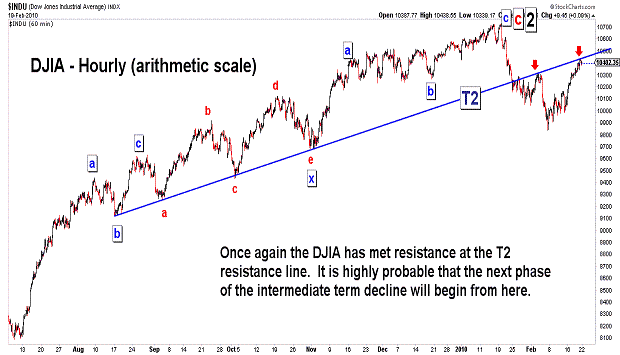
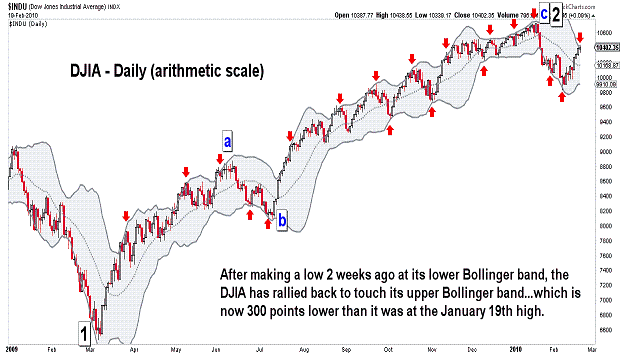
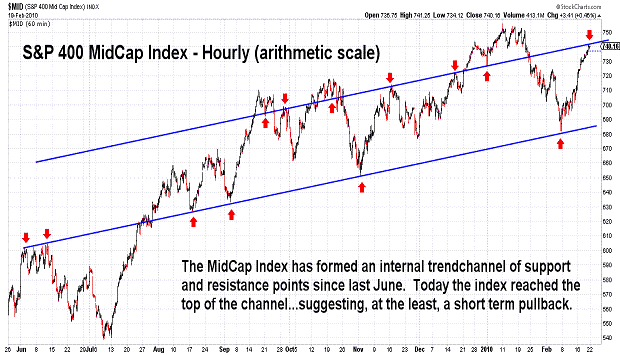
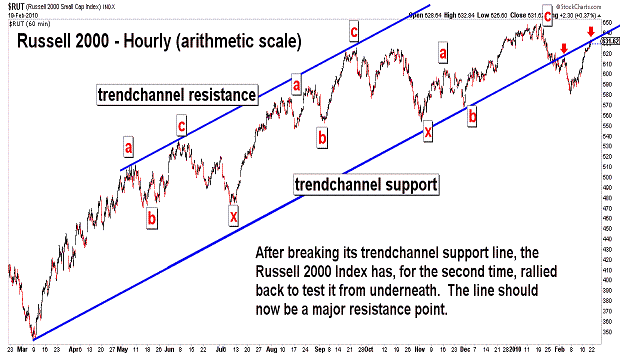
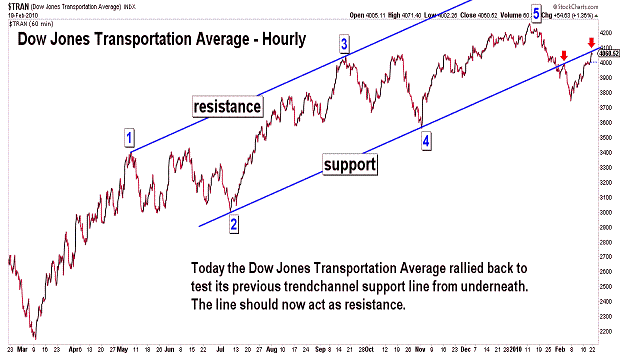
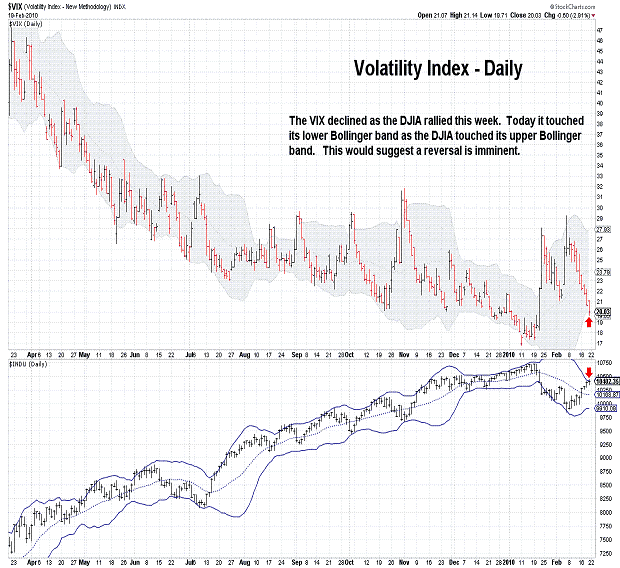
| February 19, 2010 update...In Tuesday's update, I indicated that a continuation of the rally would likely result in the DJIA testing the Fibonacci 61.8 percent retracement level of its decline from the January 19th high. It did...and today it closed about 14 points above that level. As you can see in the charts above, the DJIA (and other indices) today reached important resistance levels in terms of both trendlines and Bollinger bands. If I am right that the current rally was countertrend action to the decline that began at the January 19th high, then the market should reverse from here. If this countertrend action is, in fact, not complete...and requires further subdivisions and complexity, a short term decline back toward 10000 should follow, at the very least. We'll see. |
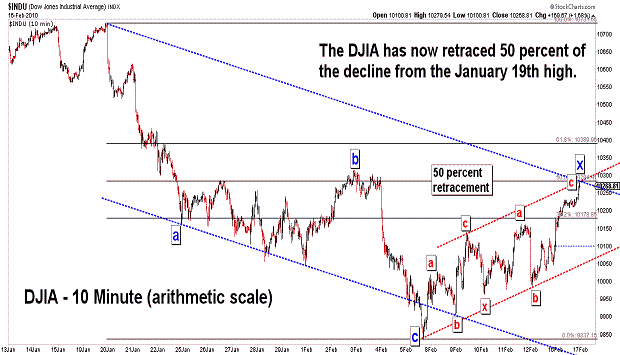
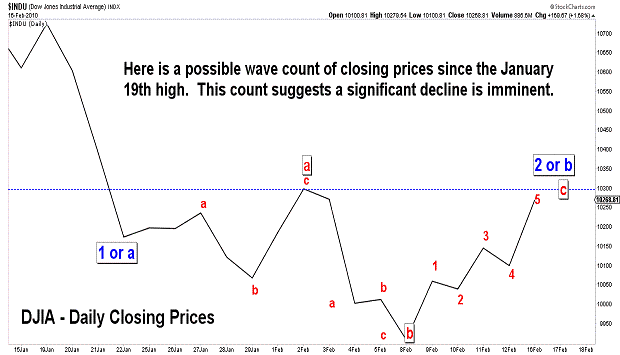
| February 16, 2010 update...Today's strong rally took the DJIA to the 50 percent retracement point of the decline from the January 19th high. On the intraday charts, the pattern from the February 5th low looks like a a double three combination pattern (a-b-c-x-a-b-c) (an "x" wave). On the daily closing chart, it looks like a five wave "c" wave pattern (the final part of a 3-3-5 flat pattern). In either case, if the rally is complete, a signficant decline is next. Should the rally continue, however, a test of the Fibonacci 61.8 percent retracement level at 10388 would become likely. |
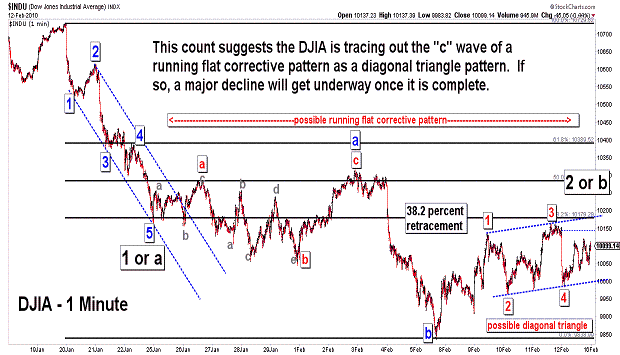
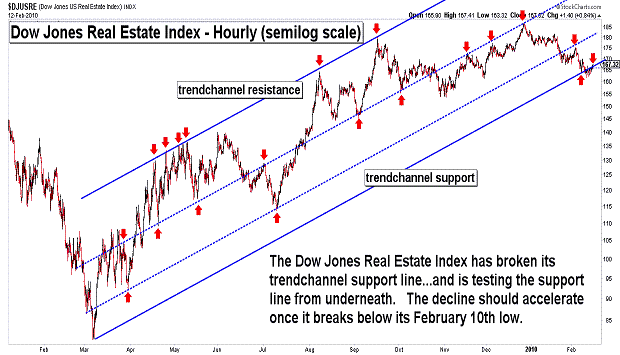
| February 12, 2010 update...On Tuesday, I posted a weekly chart of the DJIA showing a four week pattern of declines that has unfolded since the October 2007 high. The pattern suggested the likelyhood of a higher close for the DJIA this week...and that is exactly what occurred. The DJIA gained almost 1 percent for the week. As I currently see it, the DJIA has been tracing out a running flat corrective pattern since the end of January. If this wave count is correct, the final wave of the pattern (a possible diagonal triangle "c" wave) appears to be nearly complete. Once complete, the next phase of the current intermediate term decline should begin...and it should be much stronger (pricewise) and longer (timewise) than the initial decline from the January 19th top. It has been several months since I last posted the DJIA's long term chart. As you can see, the January high occurred right at the top of an important trendchannel dating back to 1932. If the DJIA now declines to the bottom of the trendchannel, all of the gains since 1995 will be erased! We'll see. |
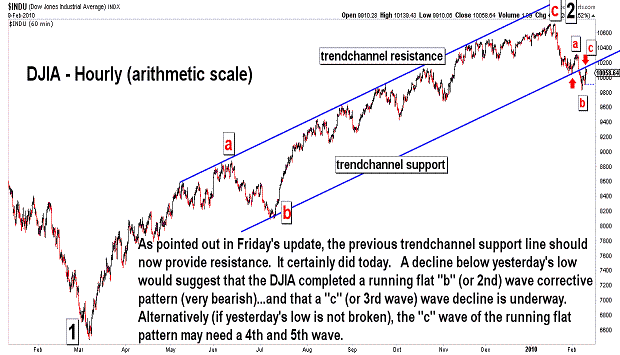
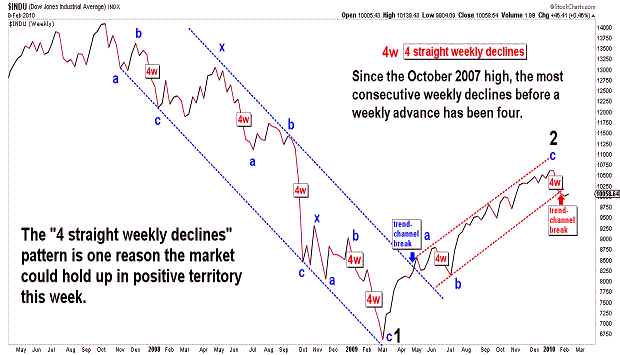
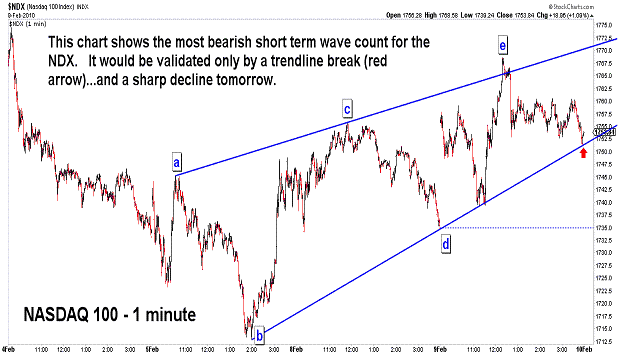
| February 9, 2010 update...On Friday, I suggested that the DJIA could be tracing out a "running flat" corrective pattern before the next phase of the current intermediate term decline begins. As part of the pattern, I said "...(i)deally, the DJIA will close lower on Monday and form an a-b-c pattern on a closing basis." It did. Today's rally was part of the "c" wave rally of the "running flat" pattern and took the DJIA back to test its previous trendchannel support line (see first chart above). Yesterday's low is now the key. If the DJIA breaks that level the "running flat" can be counted as complete...and a signficant decline will be underway. If that level is not broken, the "c" wave of the "running flat" is still unfolding...with a possible 4th and 5th wave yet to come. One reason to believe that this latter outcome is likely is the probability that this week as a whole will turn out to be a net positive for the DJIA (see second chart above). We'll see. |
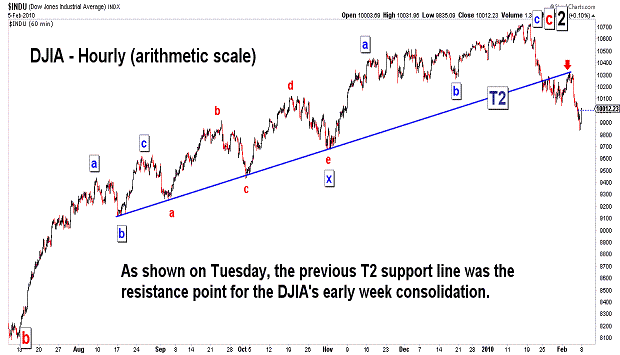
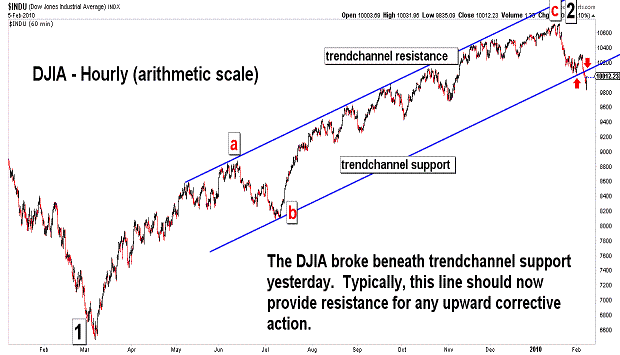
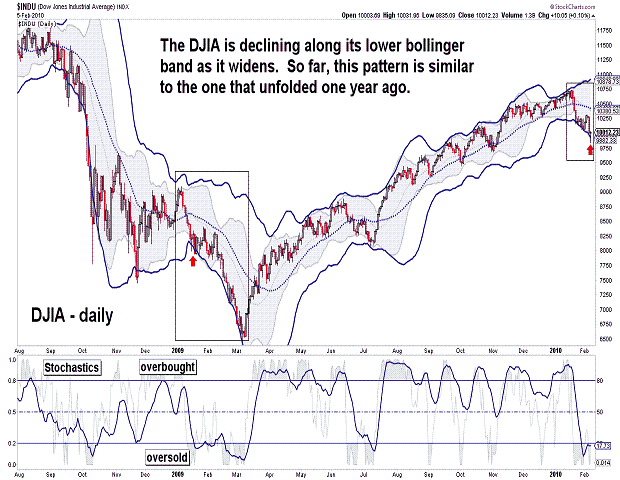
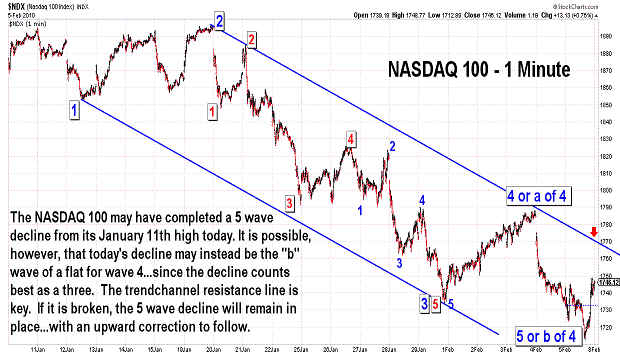
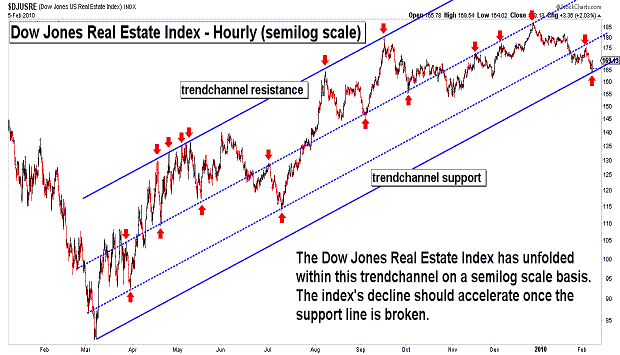
| February 5, 2010 update...For the week, the DJIA was down about 1/2 percent. Other stock indices were slightly higher or lower than that. Overall, it was a consolidation week with a downward bias, i.e., a higher Monday and Tuesday, then a lower Wednesday through mid afternoon today, with a final 2 hour pop. A case can be made that a 5 wave decline was completed today (see NDX chart)...with an upward corrective pattern to follow next week. However, it appears to me that the decline from Tuesday's high (Wednesday in the NDX) counts best as three waves, i.e., a "b" wave. This would suggest that a larger corrective pattern is underway from last week...and that a "c" wave rally has now begun which should, in the case of the DJIA, take it back for a retest of its previous trendchannel support line (see second DJIA chart above). (Ideally, the DJIA will close lower on Monday and form an a-b-c pattern on a closing basis...but this is not necessary.) Once the correction (a possible running flat pattern in the DJIA) is complete, the next phase of the current intermediate term decline should begin. |
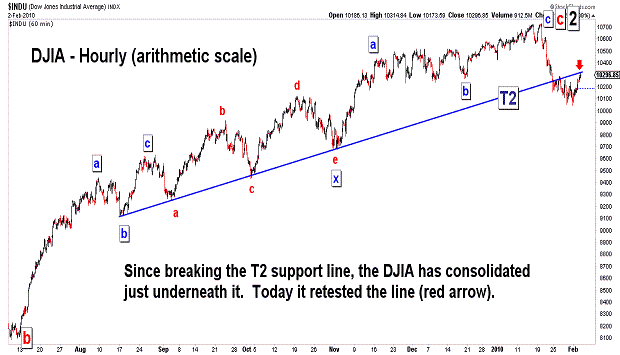
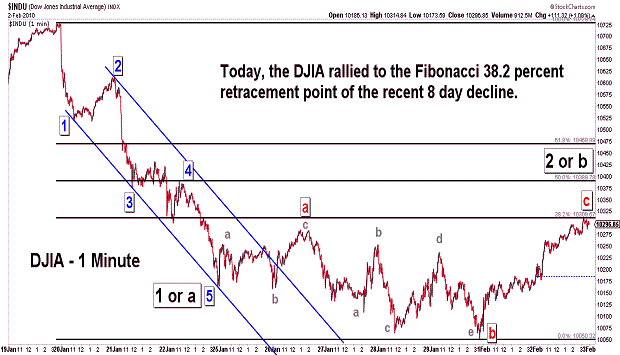
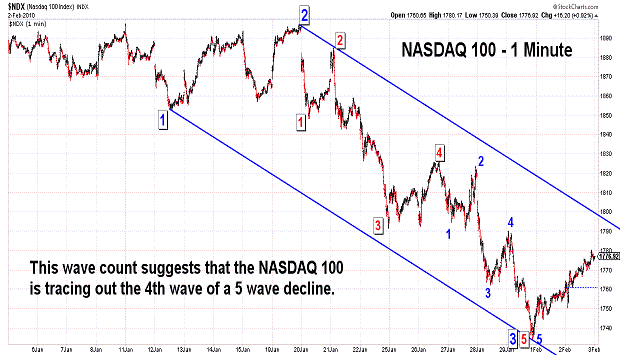
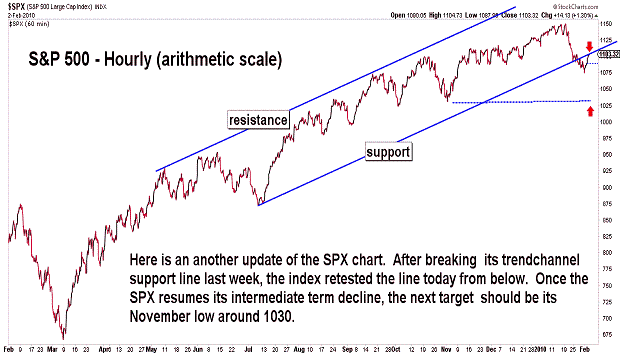
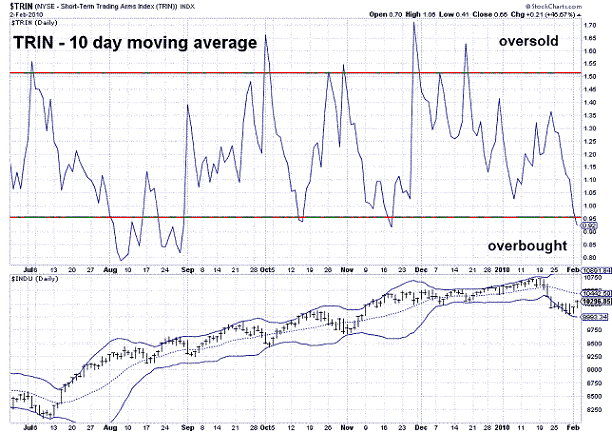
| February 2, 2010 update...On Friday, I suggested that there was a strengthing "case for a short term bounce or consolidation". I thought the "clearest case (could) be seen in the...NDX chart which show(ed) the index (potentially) in a 5th of a 5th wave (of 3) from the January 19th high." And so, a 4th wave (one possible count in the NDX) consolidation has unfolded so far this week. Today's rally in the DJIA took it to the Fibonacci 38.2 percent retracement point of the recent decline...which is one possible stopping point for the rally. While the indices are approaching a short term overbought condition, further consolidation is still possible. Given that some indices (see DJIA and SPX charts above) are retesting previously broken support lines...which should now provide resistance...it is likely that a continuation of the current consolidation pattern (if it does occur) would be more sideways in terms of price action than higher. We'll see. |
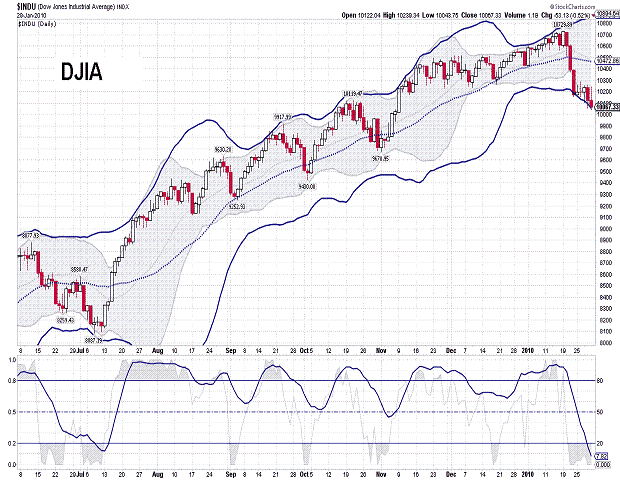
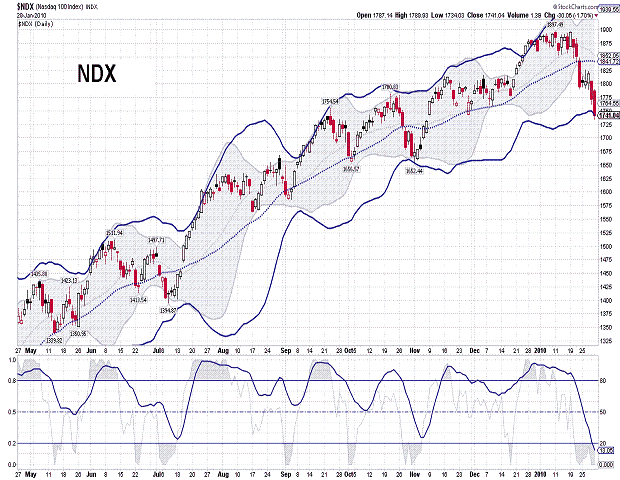
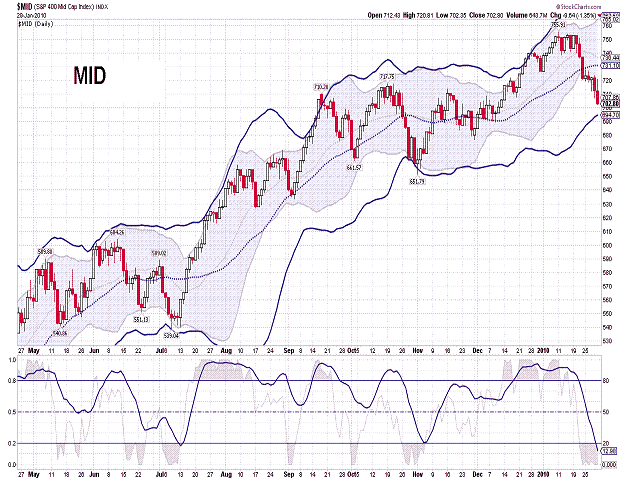
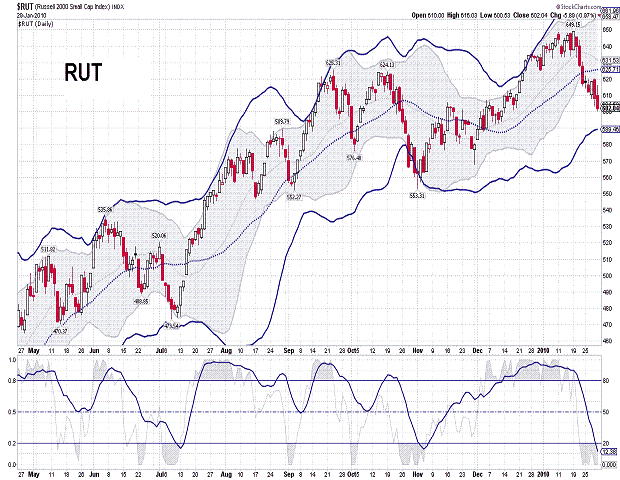
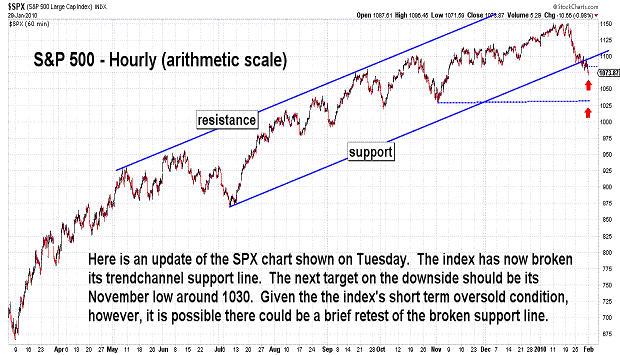
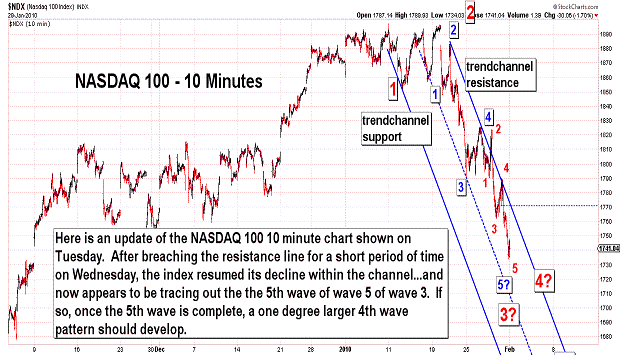
| January 29, 2010 update...The DJIA lost another 1 percent this week...the NASDAQ 100 lost even more - 3 percent. For the month of January, the DJIA declined about 3 1/2 percent...and this is a negative omen for the rest of the year. In an email I received today it was pointed out that "...Yale Hirsch of the The Stock Traders Almanac suggests that since 1950, every down January in the S&P500 preceded a new or extended bear market, or in some cases, a flat market. They go on to further suggest that down January's are followed by substantial declines averaging -13%." My own analysis suggest that this year's decline will be substantially more than 13 percent. Shorter term, the various market indices are giving slightly different indications where the next bounce or temporary low is likely to occur. The four daily charts above - DJIA, NDX, MID, RUT - show the indices at different points relative to their lower bollinger bands...the DJIA is currently sliding down its band...the NDX touched its band today...and the MID and RUT are still above but declining toward their bands. So, there is room for further declines early next week...but, the case for a short term bounce or consolidation is gaining strength. I think the clearest case can be seen in the 10 minute NDX chart which shows the index (potentially) in a 5th of a 5th wave (of 3) from the January 19th high. This suggests that a 4th wave consolidation is likely once the index turns higher. We'll see. |
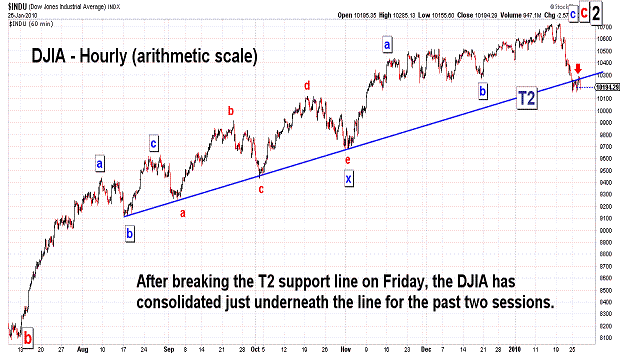
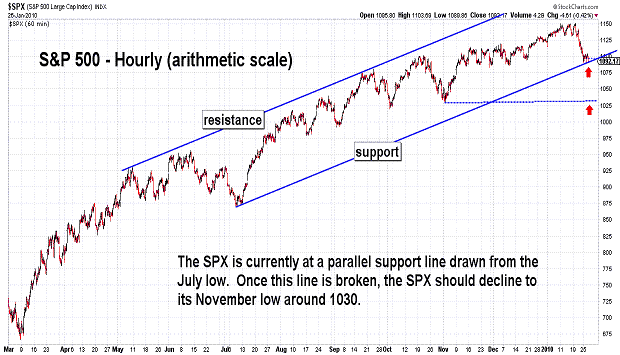
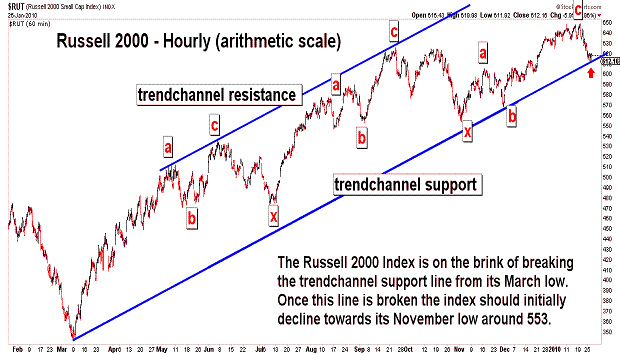
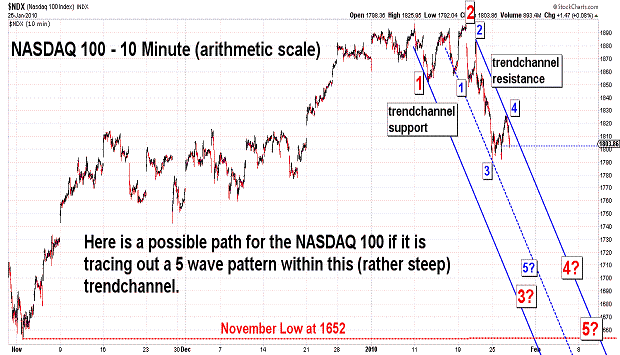
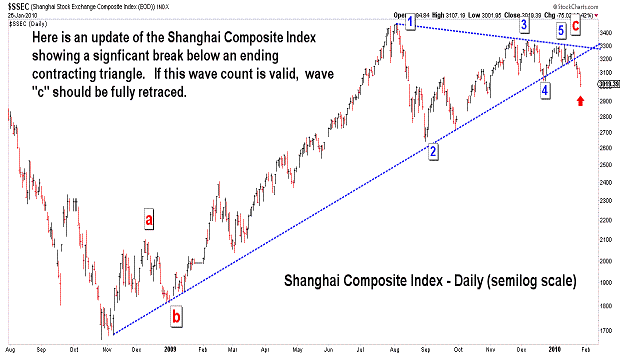
| January 26, 2010 update...On Friday, I said that the T2 trendline (see first chart above) was a likely "pivot point during any consolidation that occurs at the conclusion of the current decline." During the first two trading sessions this week, it was! If the current consolidation continues through tomorrow, the T2 trendline is likely to continue to provide resistance. However, any significant decline below today's low should suggest that the next phase of the intermediate term decline is underway...which should take the DJIA toward its next target...the November low around 9700. |
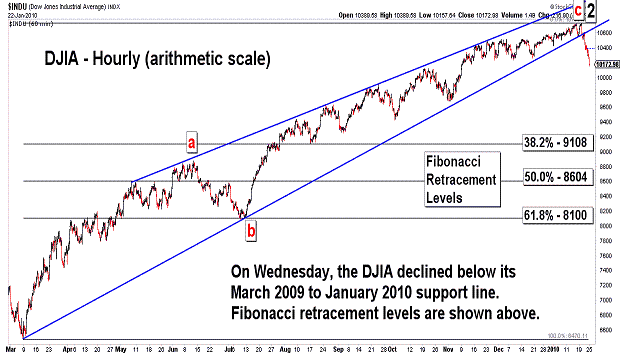
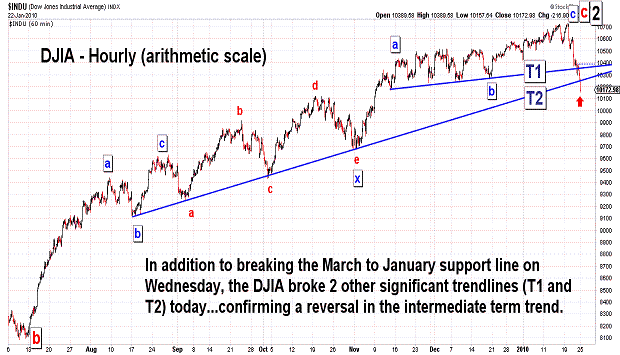
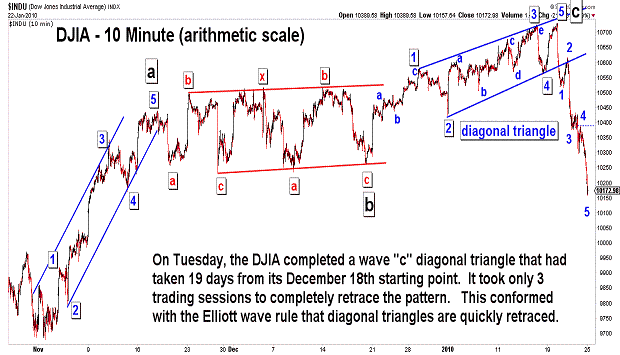
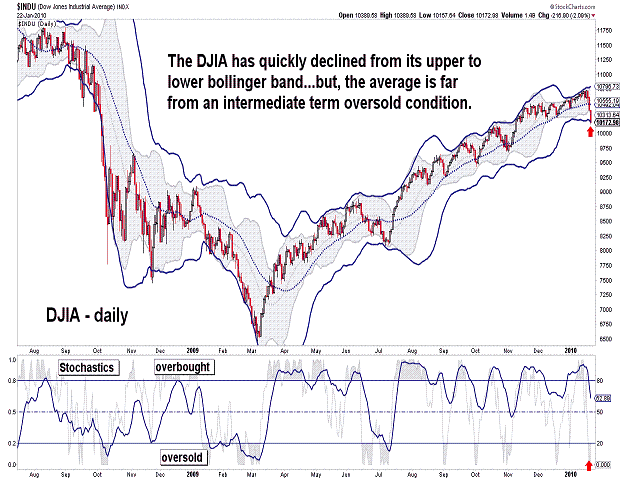
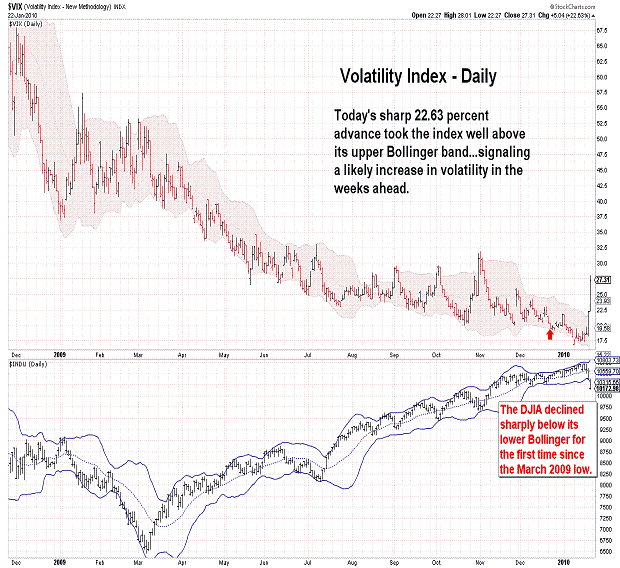
| January 22, 2010 update...On Tuesday, I suggested that an intermediate term decline would be confirmed before this update. It was! This week's 436.67 point decline was the largest weekly point loss since the (low) week of March 6, 2009 (435.99 points). Three significant trendlines were broken during the week (see the first two charts above)...one on Wednesday and two today. Most importantly, the decline from Monday's high looks impulsive, i.e., 5 waves...suggesting that the main trend of the market is now downward. The intermediate term (countertrend) rally from the March low (wave 2) lasted 10 months...so, it is reasonable to expect that the current intermediate term decline (wave 3) will last at least as long or longer. Timewise, wave 2 lasted almost a perfect Fibonacci 62 percent of the time of wave 1 (October 2007 to March 2009 decline)...and waves "a" and "c" of wave 2 were related to each other by an exact 1:2 ratio (see first chart from January 16th's update - DJIA theoretical high occurred on January 14th). Given the Fibonacci relationships that have occurred between the waves since the October 2007 high, it is likely that additional Fibonacci time relationships will develop with and within wave 3 as well. We'll see! Shorter term, watch the T2 trendline (see second chart above) as a pivot point during any consolidation that occurs at the conclusion of the current decline. |
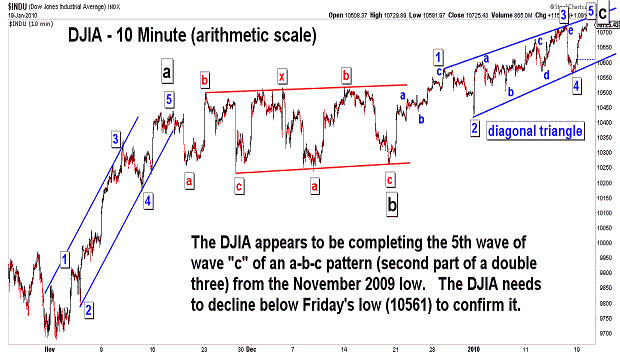
| January 19, 2010 update...Today's update will be brief because of yesterday's holiday. In the last update, I said that "...the DJIA and other market indices (would) have to continue to decline below (Friday's) low (10561)" to confirm that a top was in place. That certainly did not occur today. Instead, Thursday's top was negated by today's strong rally to a new intraday high. (Note: Today's theoretical high did not exceed last Thursday's theoretical high...so the Fibonacci day time cycle remains in place.) From an Elliott wave perspective, however, today's new high helped to clarify the wave pattern from the December 18th low of 10263. The pattern now has a definitive Elliott wave look...as an ending diagonal triangle pattern. The 5th wave of the pattern began Friday afternoon and continued into today's close. If this count is correct, a sharp decline should follow the completion of wave 5 and take the DJIA below 10561. As I previously suggested: "...(if) and when that happens, more significant trendlines going back as far as the March low will also be broken. This will confirm, in my opinion, that the March 2009 to January 2010 countertrend rally is over...and that an intermediate term decline is underway." It is highly likely IMO that this will occur before the next update. |
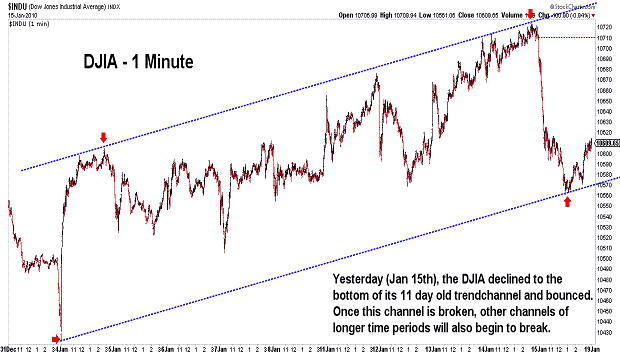
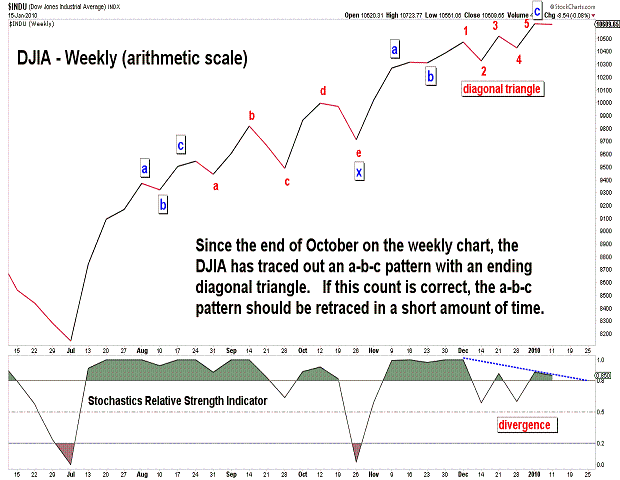
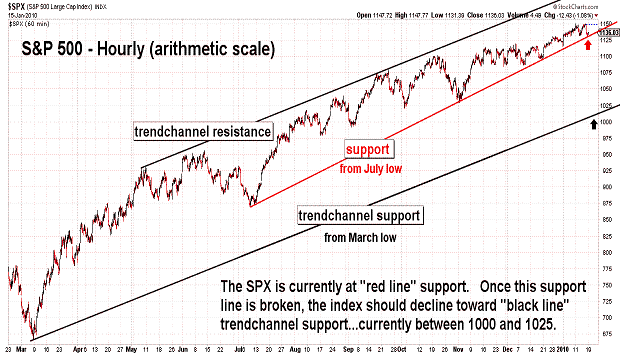
| January 16, 2010 update...In this past Tuesday's update, I pointed out that "Elliott wave patterns sometimes increase in complexity during (option expiration) periods." What looked like a possible top last Monday (in conjuction with a time cycle on the daily chart - see last Friday's update) was erased and replaced with a slightly higher top on Thursday (in conjuction with a time cycle on the Fibonacci daily chart - see chart above). Yesterday's decline was the sharpest of the new year and broke some short term trendlines. Despite a late session bounce, it produced a key reversal pattern on the weekly chart. So, if a top is now finally in place, the DJIA and other market indices will have to continue to decline below yesterday's low (10561). If and when that happens, more significant trendlines going back as far as the March low will also be broken. This will confirm, in my opinion, that the March 2009 to January 2010 countertrend rally is over...and that an intermediate term decline is underway. How low we eventually go will be addressed in future updates. |
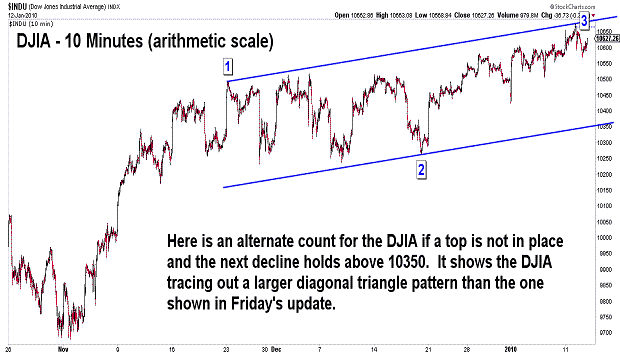
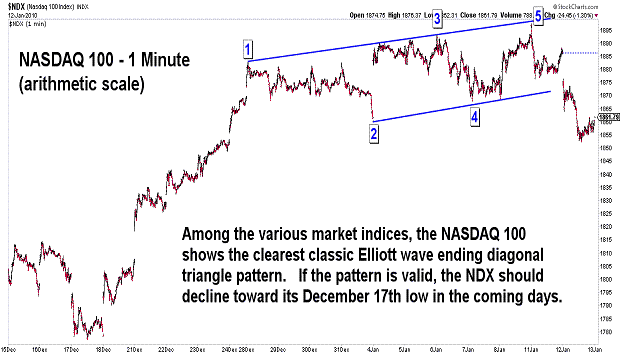
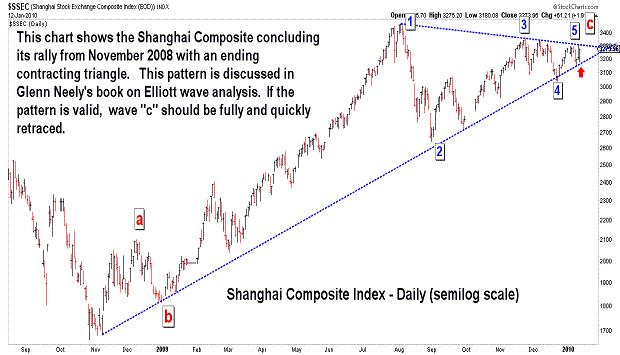
| January 12, 2010 update...The DJIA reversed course today in line with a Fibonacci time cycle that called for a closing high yesterday. (See chart in Friday's update). In terms of the DJIA's short term pattern, however, it is not yet clear whether the FINAL high of the March to January rally is in place. The decline in the DJIA today was weak relative to most of the other market indices. One of the indices that did decline substantially today and does show a clear Elliott wave pattern is the NASDAQ 100...which shows the completion of a diagonal triangle pattern yesterday...and a decline below the triangle's support line today. If the pattern is valid, the NDX will retrace its rally from December 17th in the coming days. Should that decline occur, the rest of the market will certainly follow...and that should confirm that the rally from March is over...and an intermediate term decline is finally underway. Anything short of that development...and numerous other possible topping patterns come into play (see DJIA 10 minute chart for an example). One thing to keep in mind this week is option expiration. Elliott wave patterns sometimes increase in complexity during these periods. Let's see what happens over the next three days. |
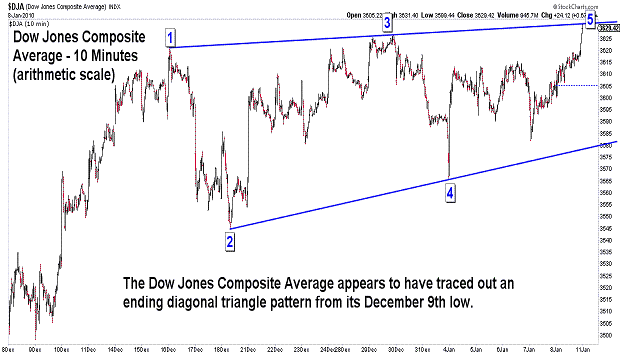
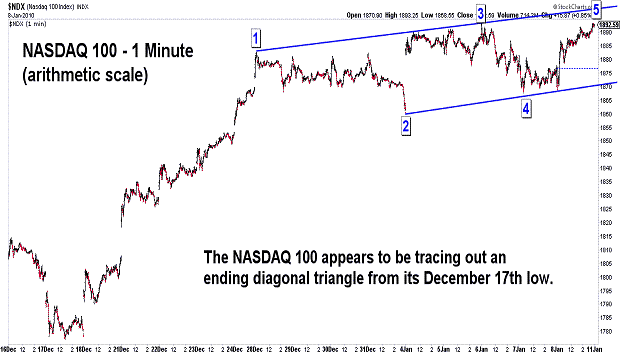
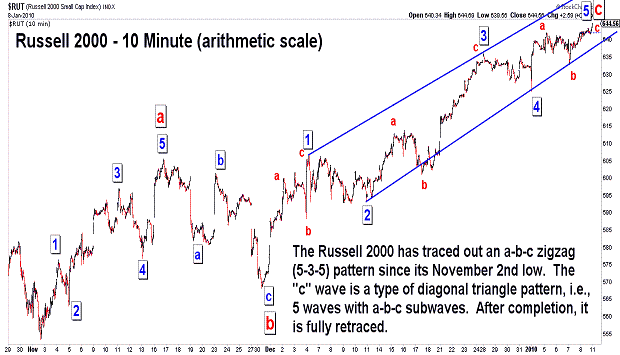
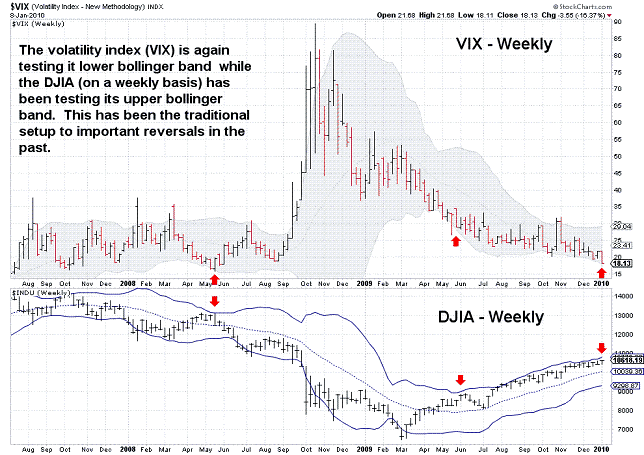
| January 8, 2010 update...In Tuesday's update, I suggested that "a more complex topping process (was) possible over the next few days", but I continued to emphasize that an intermediate term top was imminent. Well, the "complex topping process" has, in fact, occurred...in the form, I believe, of a diagonal triangle pattern (see charts above of DJIA, DJA, NDX and RUT). If my labeling of the waves is correct, once the pattern is complete, a quick retracement should occur. When (and if) this does happen, important support trendlines will be broken (see chart examples in recent updates)...and this will confirm that an intermediate term decline is finally underway. If you are interested in what other Elliott wave stock market forecasters have to say right now, there seems to be a consensus that a major decline is coming. The only difference is one of degree. Prechter's Elliott Wave International organization is predicting a decline well below the 2009 low. Glenn Neely in his NeoWave service forecasts a test of the November 2008 low. He is currently suggesting that the DJIA may be tracing out a multiyear triangle pattern...something I suggested as a possibility back in 2008. Time will tell who is correct. Politics aside, much (I think) now depends on the action of the Federal government. If they continue to squeeze out the private sector in favor of more government spending, increased regulation, etc. we may, in fact, be in for a bigger and longer bear market than I expected several years ago. For the worst case scenario, see the long term chart in the November 20th update. If that chart is accurately labeled, we are following the 1937-1938 pattern (on a larger scale)...which would be, to say the least, a frightening prospect. One final note: years ending in "0" are historically negative (see last chart). |
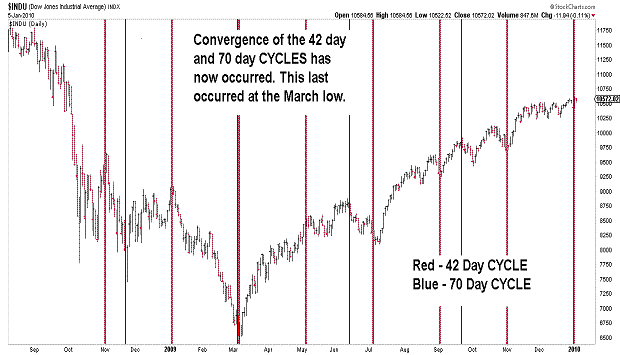
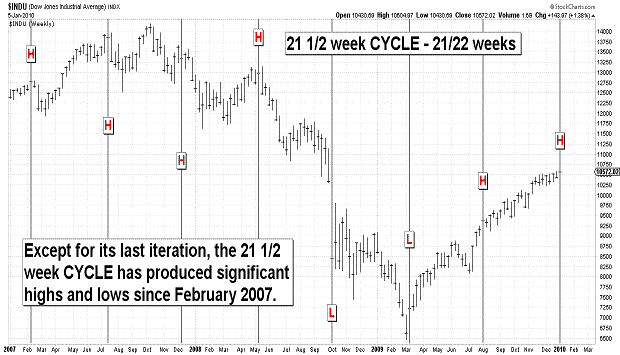
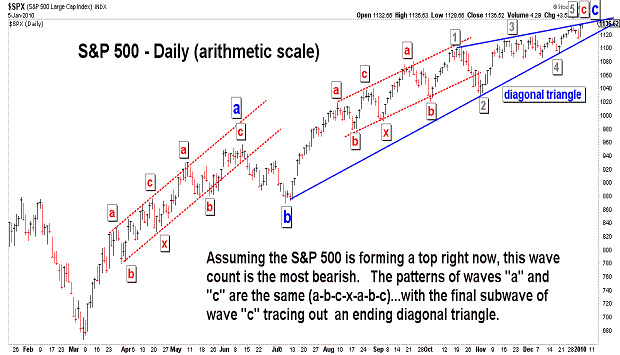
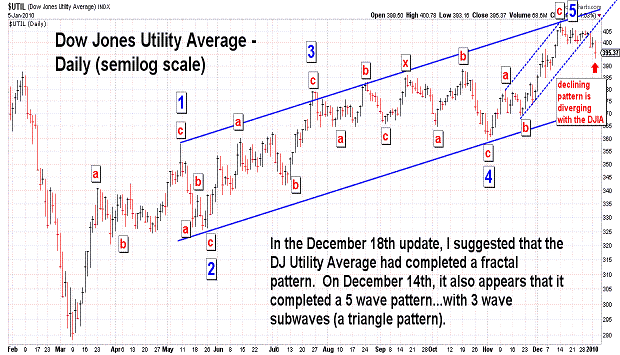
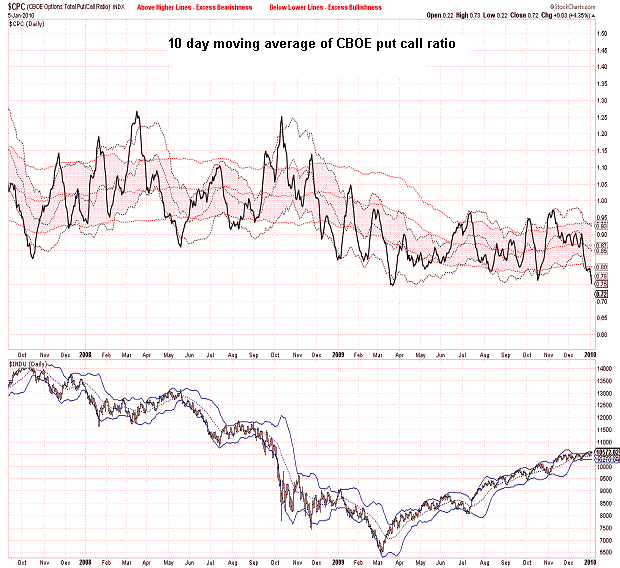
| January 5, 2010 update...Happy 2010! If I am right about the stock market, however, it will not be a happy year for investors who own stocks. As each trading day passes, the technical condition of the market grows weaker. The market's own momentum has allowed it to struggle higher...but, it has only gained 4 1/2 percent since its October high. Last week's low is now, I believe, the critical support level for the market. On the DJIA, it was 10428. Last week's low occurred right on an important support line for a variety of indices. While a more complex topping process is possible over the next few days, the next significant decline which takes us below last week's low will, in my opinion, suggest that a top is in place...and an intermediate term decline is underway. As I said in the last update "...market technicals, cycles and sentiment are again aligned to suggest that a reversal is imminent." I think the charts above support that proposition. Of course, the market itself always has the last word! |
Important: Information and chart access provided herein is limited to current subscribers only and shall not be forwarded or retransmitted without written authorization. It is educational in nature and shall not, directly or indirectly, be construed as investment advice. No guarantees are made with respect to the accuracy of the information, opinions, predictions,etc. offered here in. The username/password provided to a subscriber is unique and it is the sole responsibility of the subscriber to protect the confidentiality of said username/password and to further protect it from any unauthorized use.
Copyright © 1997 - 2010. The Elliott Wave Chart Blog. All rights reserved. Email
|