|
Charts
Index Funds
Direxion - ProFunds - Rydex
Sector Funds
Direxion (Benchmarks/ETFs)
ProFunds (Benchmarks)
Rydex (Benchmarks/ETFs)
ETFs
Foreign
Currencies
IMPORTANT: Chart buy/sell signals are helpful in determining market support and resistance levels...and probable turning points. However, they are only useful if the analyst has a handle on the larger trend. Experience and judgment play a vital role in that determination ...as does Elliott wave analysis. Charts will generally appear when you use Internet Explorer or Firefox. Do not use Google Chrome to view charts.
If a chart does not not appear when you click on the link, you may need to (1) enable javascript, and/or (2) disable pop up blocking for this site, or (3) right click on your mouse and open the link in a new tab or window.
If you have a suggestion for an ETF or sector index that you would like us to consider for addition to the list of charts of above, please send an email to info@wavechart.com.
Please contact us at info@wavechart.com if you encounter a problem with the site. |
|
Elliott Wave Updates
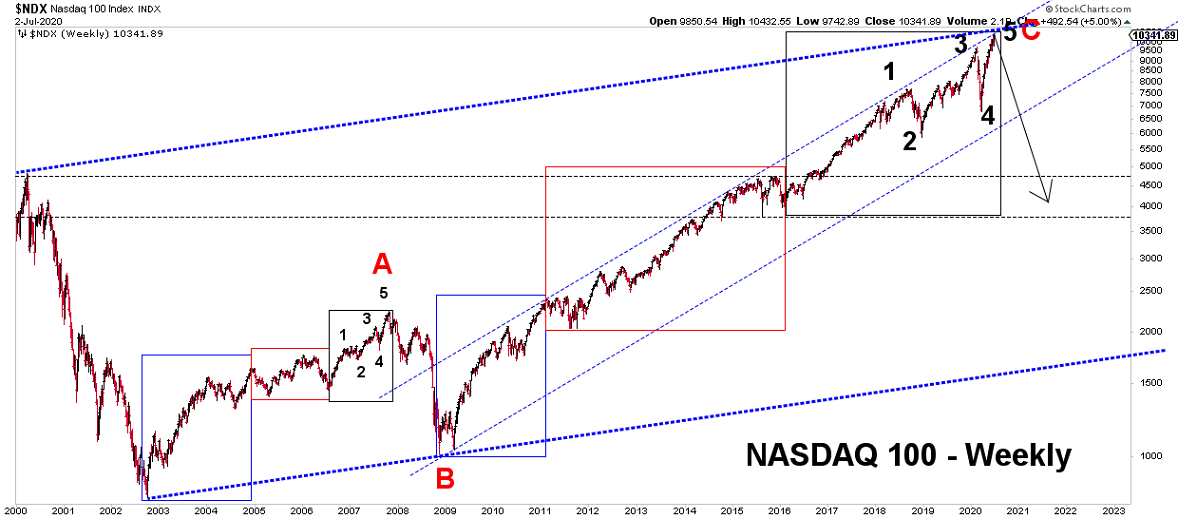
| July 2, 2020 update...The 18 year A-B-C "Bull Market" pattern in the NDX should now be ending. Each of the subwaves within Wave A (i.e., blue, red and black) from 2002 to 2007, closely match the subwave patterns within Wave C from 2008 to now. The final pattern (i.e., black) of each wave is a diagonal triangle (1-2-3-4-5). If my analysis is correct, a "rapid" return to the beginning of this wave is next. | |
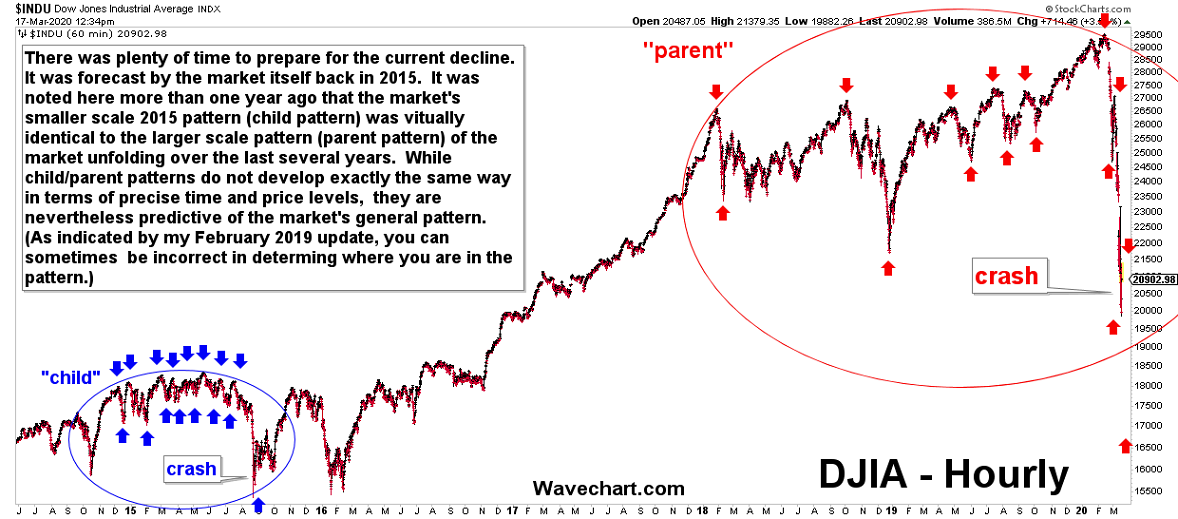
| March 17, 2020 update...Were you prepared for the market's currently unfolding crash pattern? Believe it or not, it was forecast by the market itself in 2015. This child/parent pattern was pointed out here in the February 2019 update below. If you can find it and correctly analyze it, the market almost always telegraphs its future movement. However, the reason for that movement is typically something completely unexpected. | |
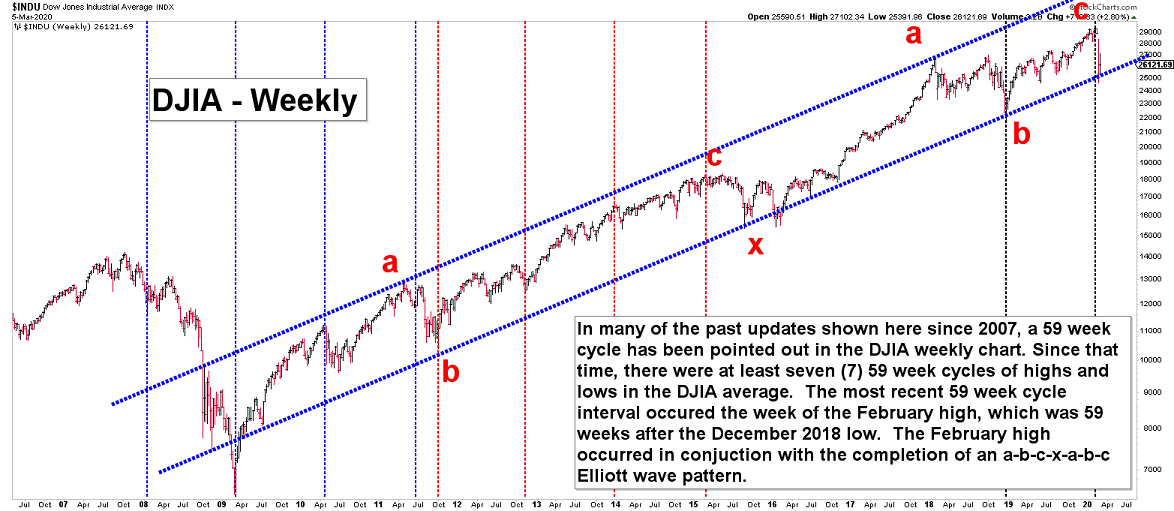
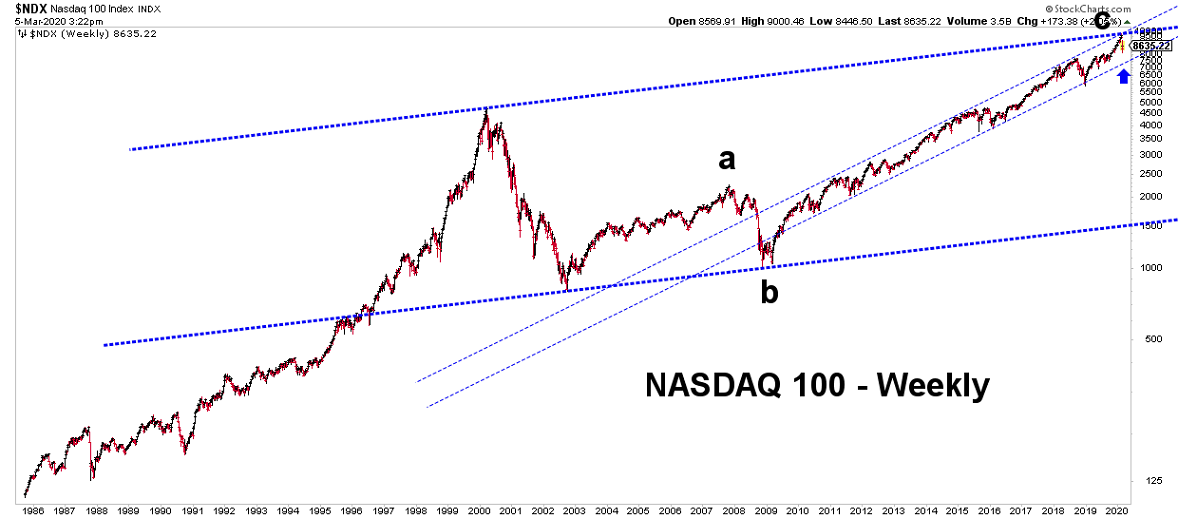
| March 5, 2020 update...The February high 3 weeks ago coincided with the completion of a 59 week cycle from the December 2018 low. This cycle pattern has been pointed out in the the charts below since the beginning of the bull market in 2009. The February high also coincided with the completion of an a-b-c-x-a-b-c Elliott wave pattern since 2009. The multi-decade Elliott wave pattern since 1932, which is also an a-b-c-x-a-b-c pattern, may also be complete even though my long term Fibonacci target of 30,800 was not quite achieved. A decline through the bottom of the NDX long term channel will confirm the beginning of a multi-year corrective pattern, which should eventually erase all (or substantially all) of the market gains since 2009. | |
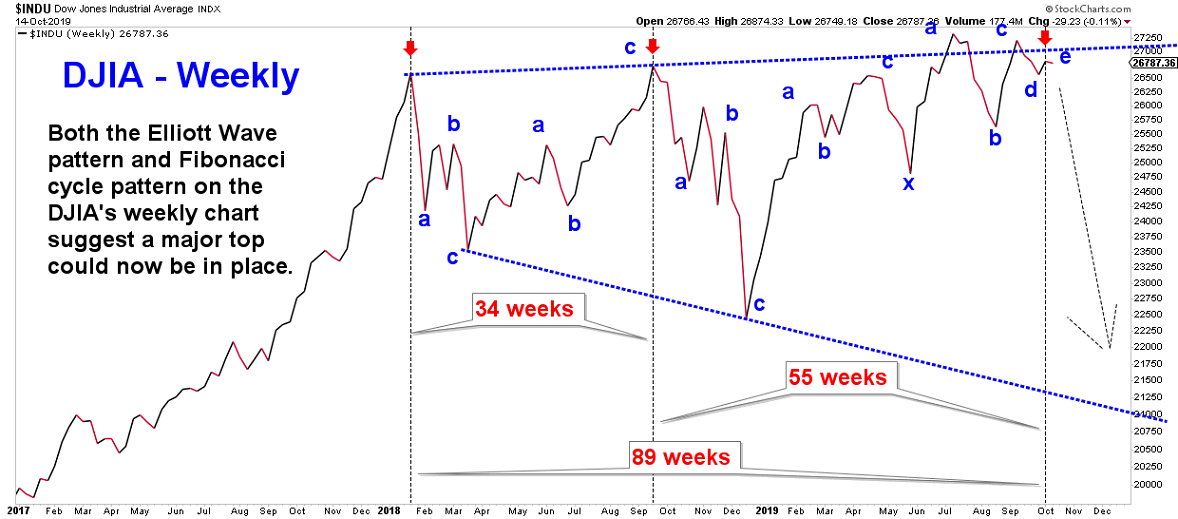
| October 14, 2019 update...If last Friday's close is not exceeded on a weekly closing basis, there is a very high probability that an important high is now in place. We'll see! | |
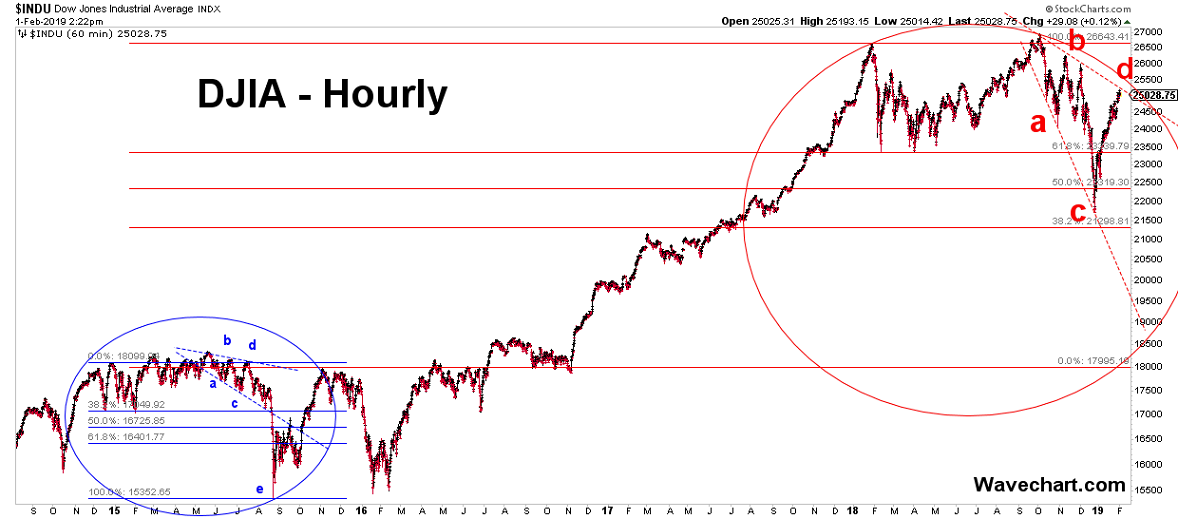
| February 1, 2019 update...If the DJIA's 2015 pattern continues to unfold from here as an expanding triangle, a Wave e crash pattern lies dead ahead. From the October high (beginning of wave a), there are a Fibonacci 5 weeks to the end of wave b. From the end of wave a to the end of wave c, there are a Fibonacci 8 weeks. From the end of wave a to the end of wave d, there are a Fibonacci 13 weeks. From the end of wave c to the end of wave d, there are a Fibonacci 5 weeks. If wave e is a Fibonacci 21 weeks from the end of wave a, it would last a Fibonacci 8 weeks. We'll see! | |
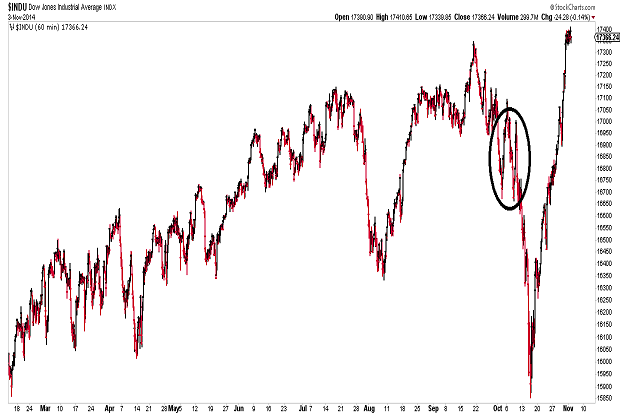 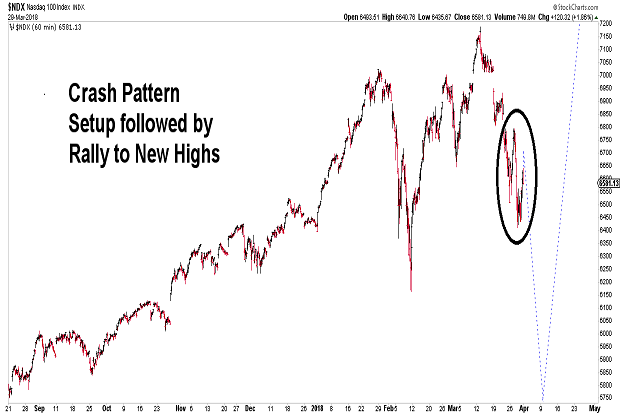
| March 31, 2018 update...Note the similarity in patterns. If the 2014 pattern continues to unfold, the market should crash in the coming days then rally to a new high. A high later this year around 31056 would be a target I mentioned on this blog back in 2009. | |
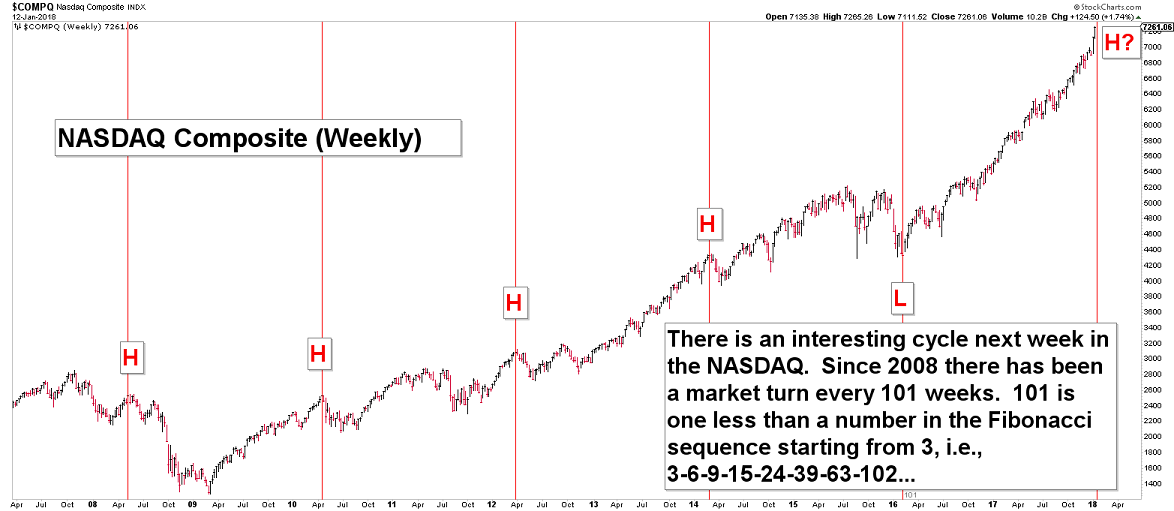
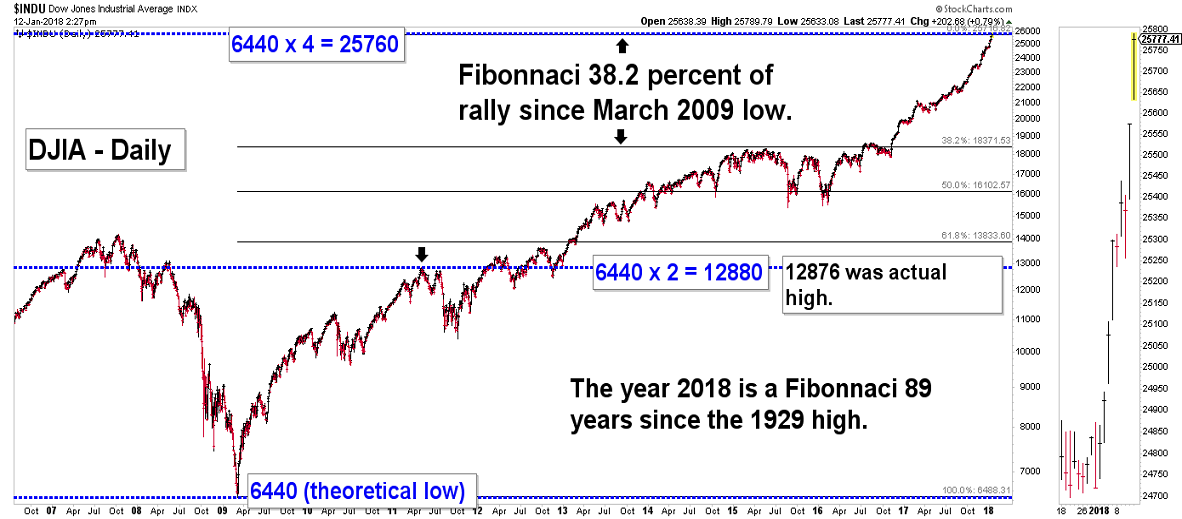
| January 12, 2018 update...Market sentiment has risen to extreme levels, but momentum has pushed the indices higher each week...to the point of looking parabolic. There is reason to suspect, however, that we are finally reaching a level where a high of some importance is likely: (1) There is a 101 week cycle occuring next week in the NASDAQ. (2) The DJIA has quadrupled the DJIA's theoretical low of 2009. The market sold off in 2011 when it doubled. Will it do so again when it has doubled a second time? | |
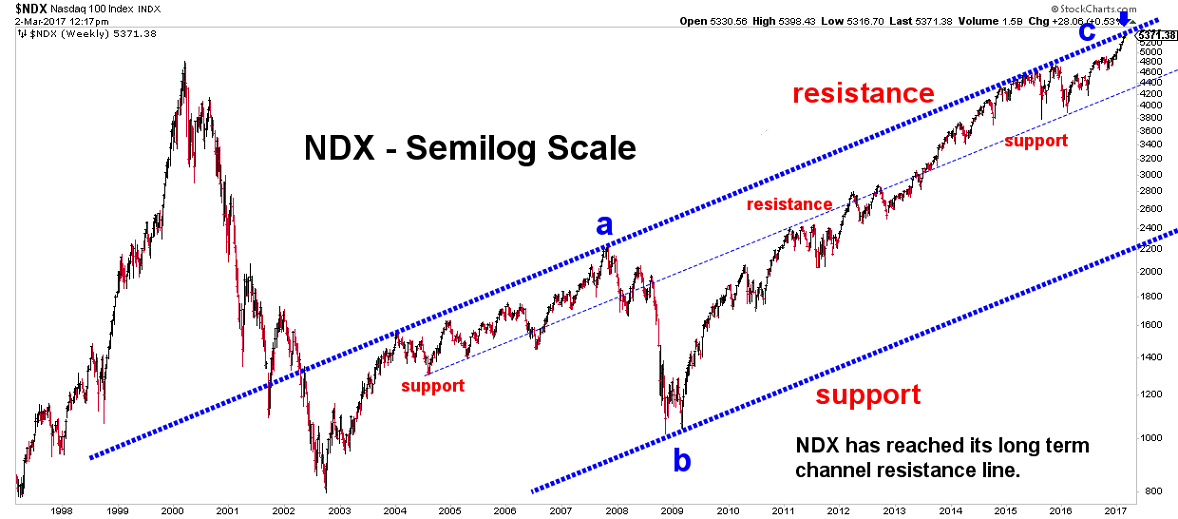
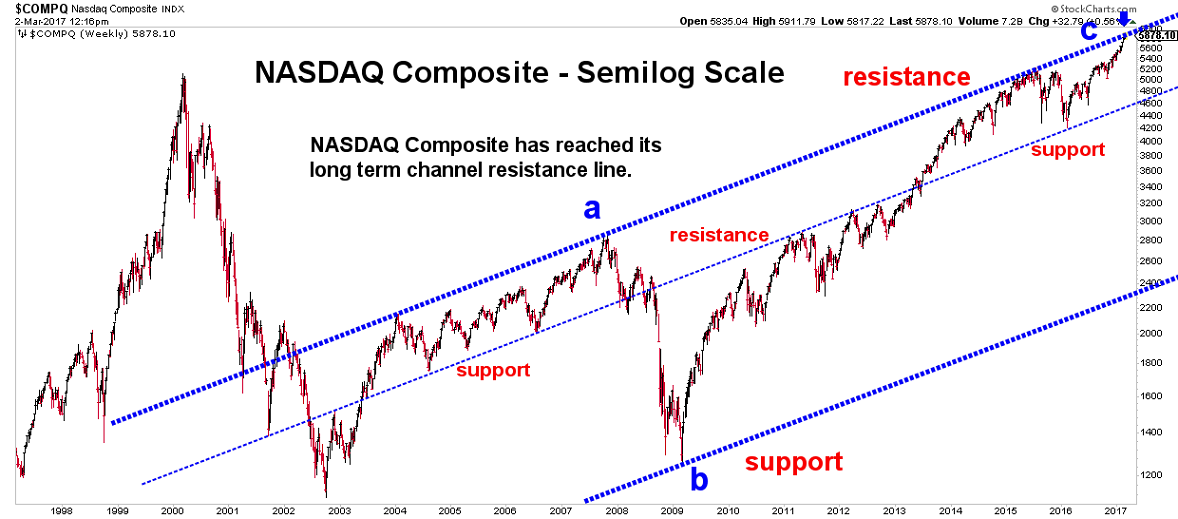
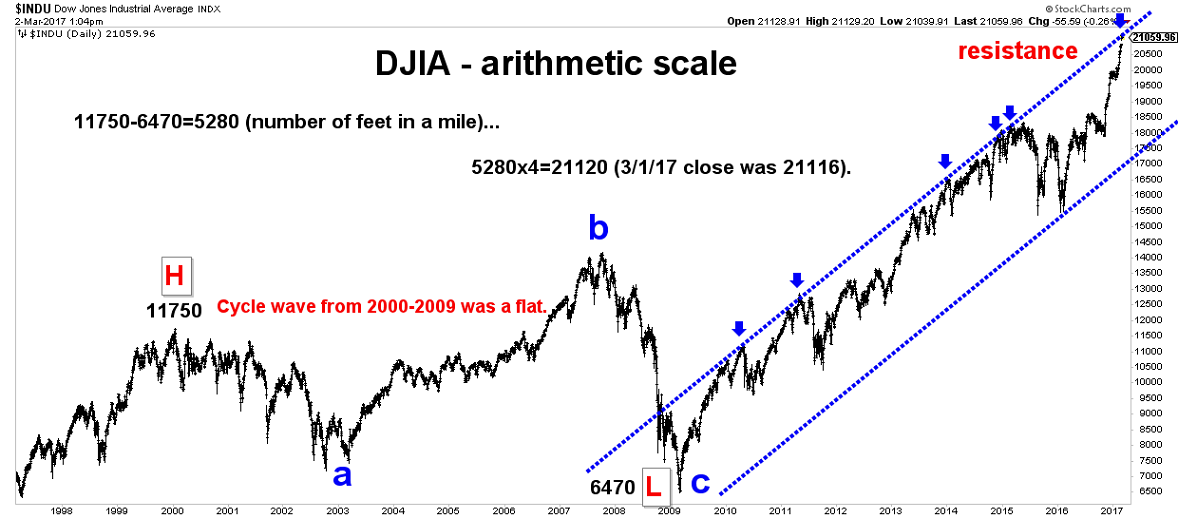
| March 2, 2017 update...Yesterday's rally took the market right to the very top of its long term channel. All technical indicators now call for a downward correction of some sort. The entire advancing wave from last year's lows looks like a completed (or nearly so) corrective pattern. If the next pattern is, worst case, the C wave decline that I said would follow this advance, it should take us below last year's lows. Of course, there are several alternate possibilities with less severe outcomes. | |
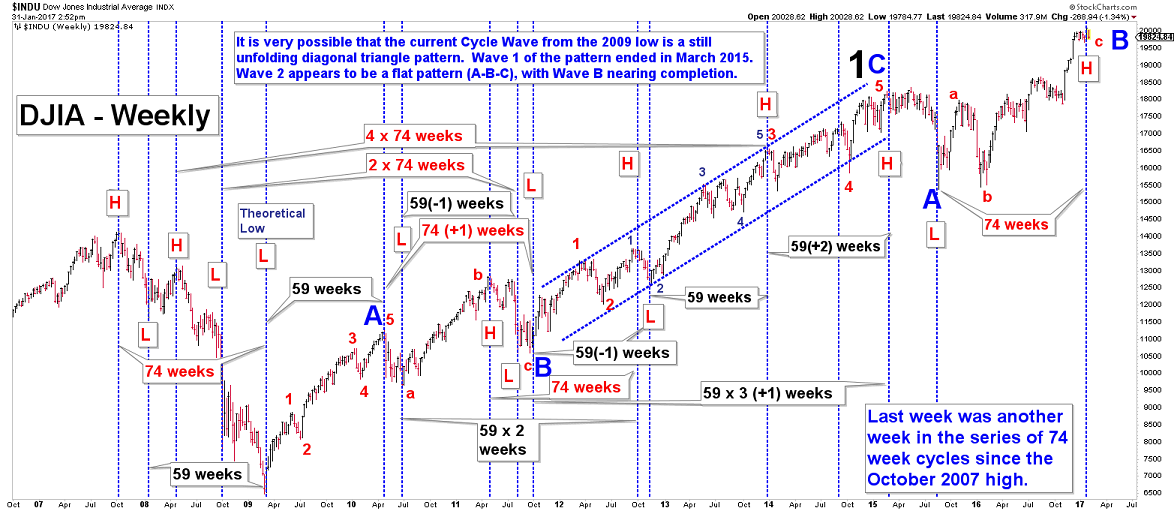
| January 31, 2017 update...Last week was another 74 week cycle week and may have finally coincided with the end of the B wave that I spoke about in last month's update. From the 59 cycle week high last month the DJIA declined over 300 points (not the thousand that I thought was possible) before rallying to a new high last week. While most indices followed the DJIA to new highs, the small caps did not. If wave C of the pattern is now underway, the DJIA should decline dramatically in 5 waves over the coming months. I do see a slight possibility of a few other complex patterns unfolding, one of which which would allow the DJIA to make one more new high if it holds above the 19,200 area during the current decline. We'll see! | |
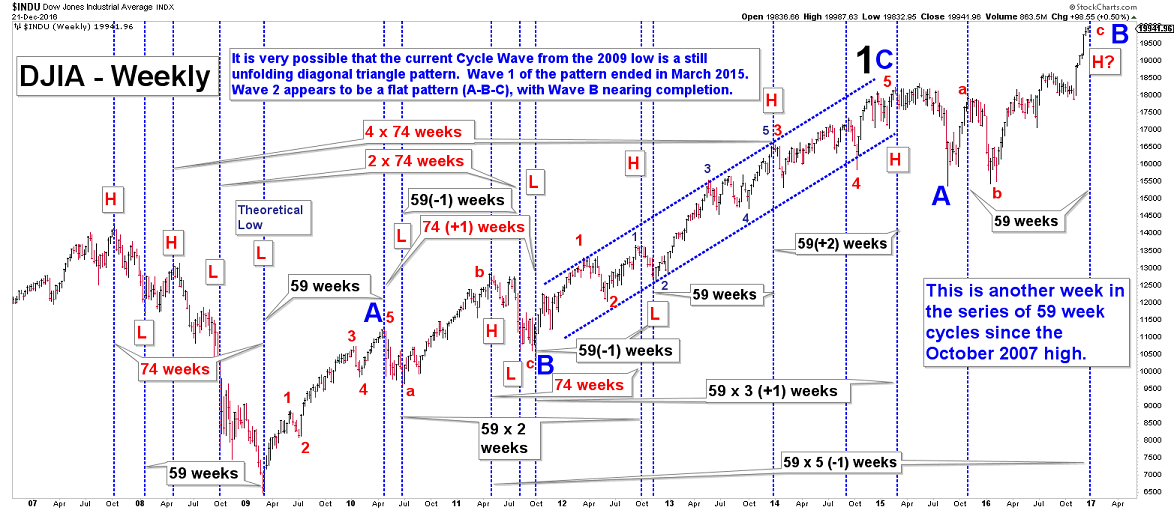
| December 22, 2016 update...This week is another 59 week cycle week and may coincide with the end of the B wave that I spoke about in last July's update. Instead of ending 5 months ago, the wave became more complex, which postponed the onset of Wave C until now. I currently see two possibilites. Wave C could either be starting at the present time...or possibly weeks from now after a thousand point decline and a rally to new highs (in the DJIA). If the DJIA does rally to a new high early next year, it is possible that some of the other indices may not. We'll see! | |
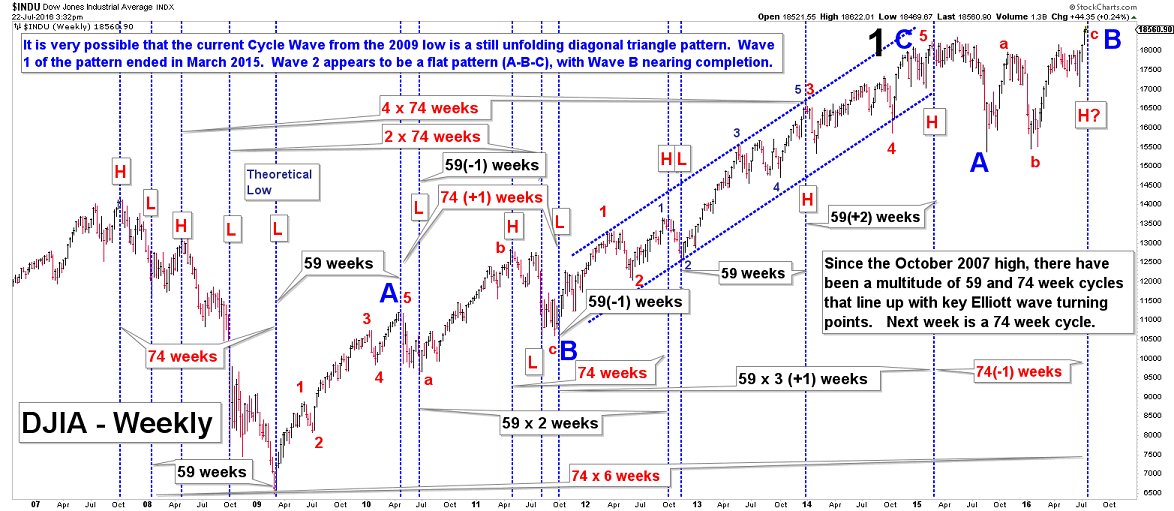
| July 22, 2016 update...Last January, I said that "another a-b-c pattern to new highs" would follow the next low. That low came just a few weeks later. If my analysis is correct, the DJIA is nearing the completion of a B wave (a-b-c) that began at the August 24, 2015 "crash" low. Wave C of the A-B-C flat pattern that started in March 2015 should be next...and take the DJIA below this year's lows. Based on the 74 week cycle, the market should reverse course next week (or the week after since the last 59 week cycle high was one week late. We'll see! | |
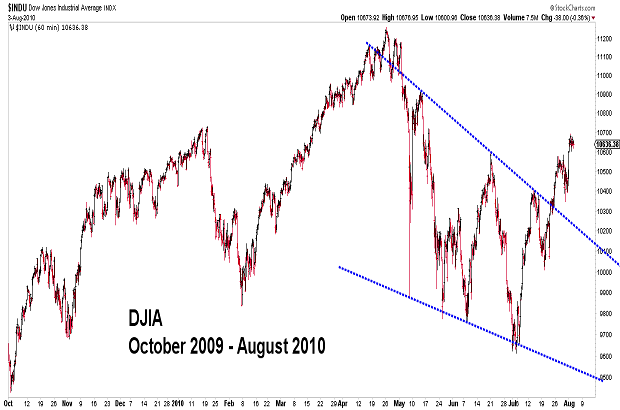 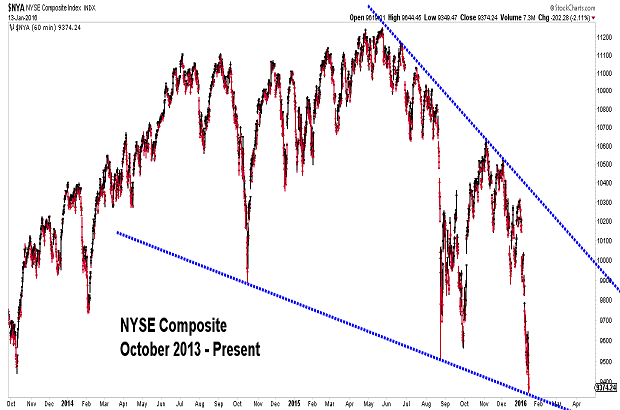
| January 13, 2016 update...Note the similarity in patterns. If the 2009-2010 pattern continues to unfold, the market should now rally. | |
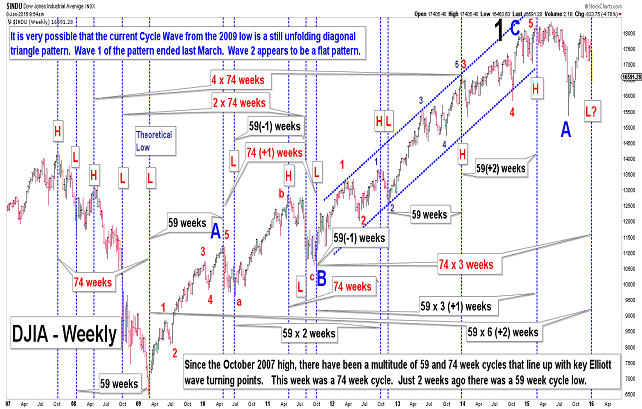
| January 8, 2016 update...It's been more than 10 months since I last updated this page...so this update is long overdue. I believe my wave count was correct last February when I indicated that the then unfolding wave C pattern was terminating. That pattern, I believe, was the conclusion of wave 1 of a CYCLE Wave diagonal triangle pattern, which began at the 2009 low. Since then, wave 2 has been unfolding in the form of a flat pattern. Wave A of 2 ended with the "crash" last August. I think wave B of 2 is still unfolding in the form of a double three pattern...with another a-b-c pattern to new highs to follow. Once complete, Wave C should take the market well below the lows of last August. We'll see! | |
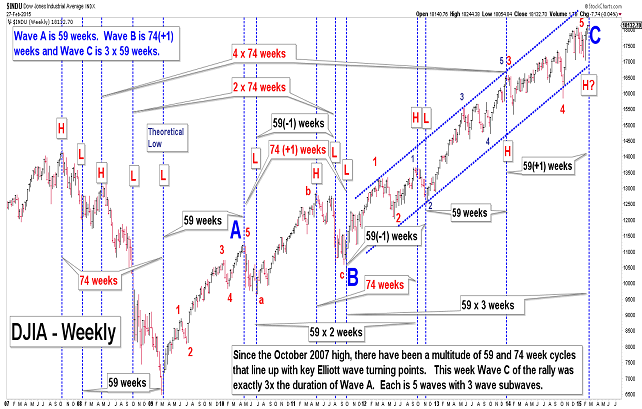
| February 27, 2015 update...Here is the latest update. Wave C has now lasted exactly three times as long as Wave A. Both time and pattern are in sync. Price is close. Wave A advanced about 70 percent...Wave C about 74 percent. | |

February 17, 2015 update...There is a significant Elliott wave cycle this week that coincides with the possible completion of an A-B-C pattern from the 2009 low. This is the 310th week since that 2009 low
(74 + (4x59) = 310). Wave A lasted 59 weeks; wave C was 3 times A (-1) and wave B was 74 (+1) weeks. If the pattern is now finishing, the start of a substantial decline is imminent. | |
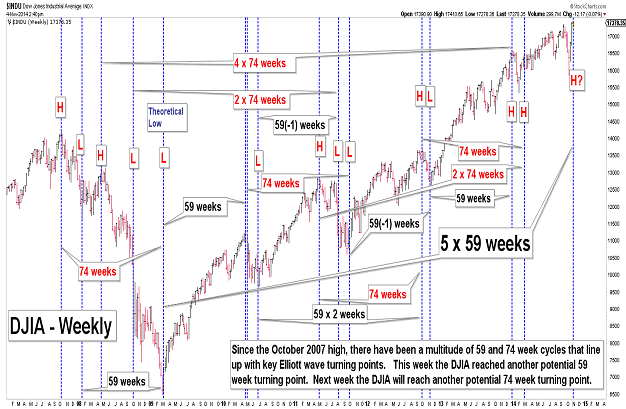
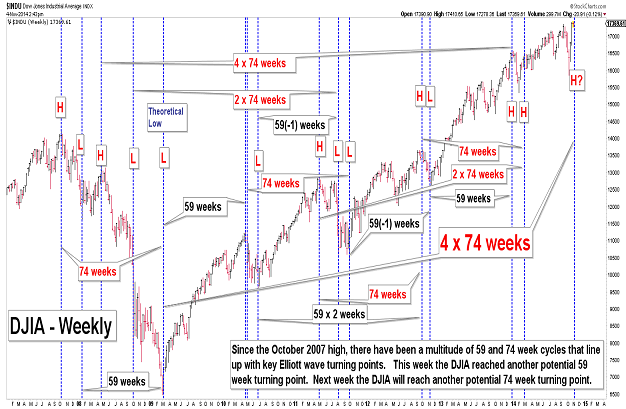
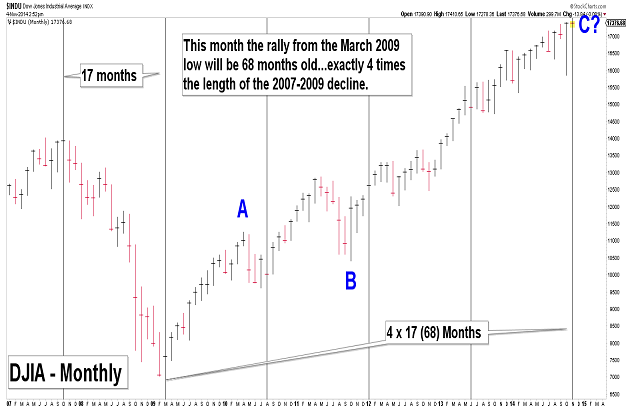
| November 4, 2014 update...There are a number of cycles converging this week, next week and this month...suggesting a significant turning point may be at hand. Once the current rally pattern is complete, the largest decline since 2011 will begin. | |
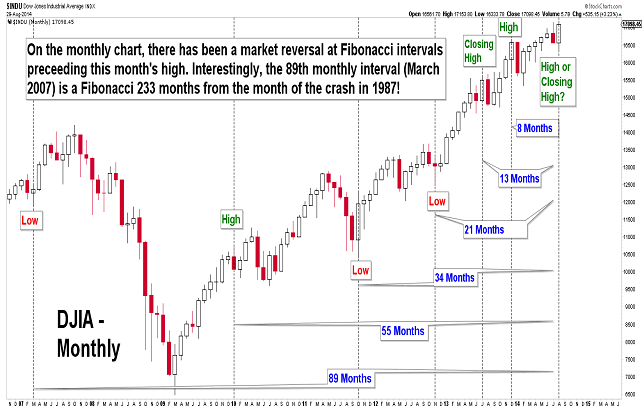
| August 30, 2014 update...There is an interesting Fibonacci time pattern on the DJIA's monthly chart suggesting that August of 2014 will turn out to be a market high, either on an intraday basis or a closing basis. | |
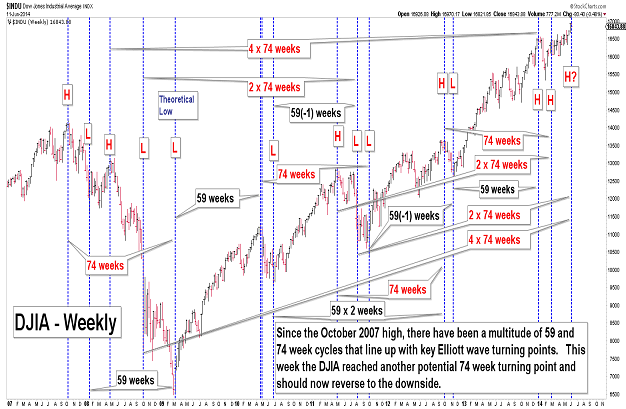
| June 11, 2014 update...Here is the latest update of the 74 week cycle, which has produced important market turning points since the October 2007 high. Since the DJIA make a new rally high this week, the 74 week cycle calls for a reversal to the downside. We'll see! | |
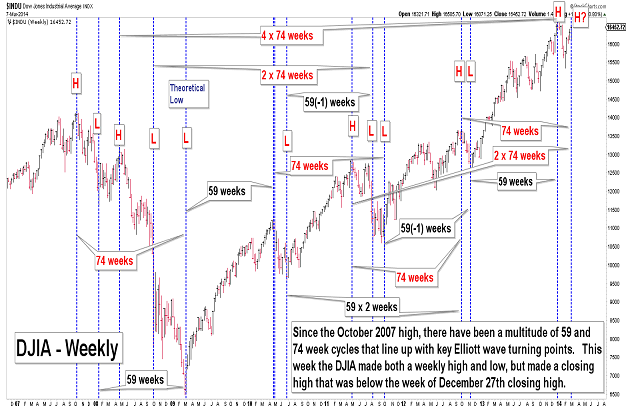
| March 7, 2014 update...Here is an update of the 74 week cycle, which has produced important market turning points since the October 2007 high. The DJIA this week was both higher and lower than last week (an "outside week"), so the cycle would be technically valid no matter which direction the DJIA went next week. However, given that this cycle has generally reversed from a closing high as well as intraweek high during the past 7 years, the odds tilt toward a decline beginning next week. | |
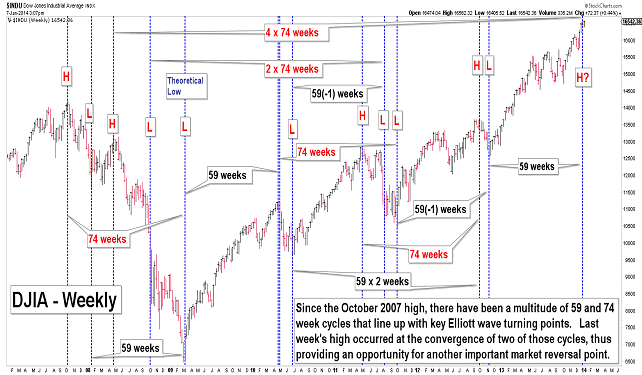
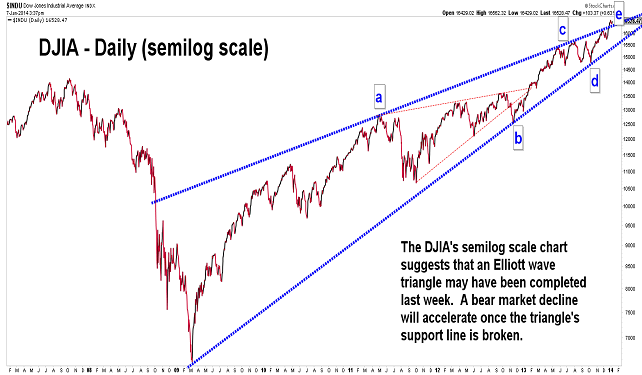
| January 7, 2014 update...Just as it did one month ago, the elements of Elliott wave analysis, i.e., price, pattern and time, have aligned to provide another opportunity for an important market reversal. Should the DJIA make a new high next week or later, however, the next likely time period for a top would be early March, i.e., the bull market's five year anniversary. | |
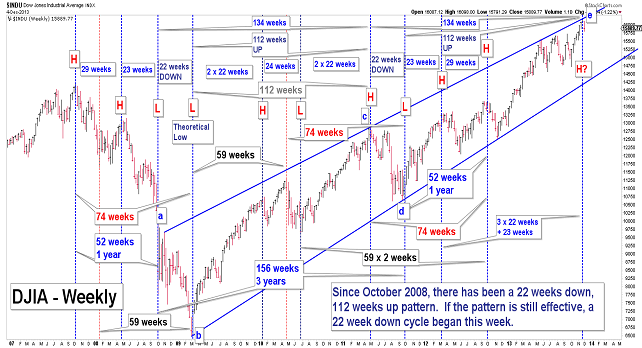
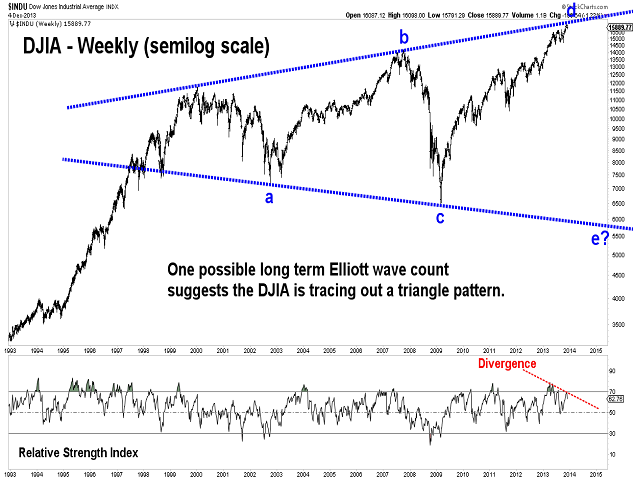
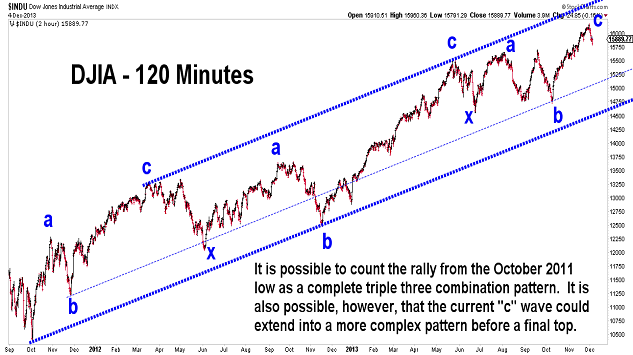
| December 4, 2013 update...The principal Elliott wave concepts concerning price, pattern and time suggest that last week's high may be the top for the bull market rally that began in March of 2009. A more complex topping pattern is, of course, possible that would extend the bull market into August of 2014. But, as you can see in the charts above, a strong case can now be made that the bull market, at least in the DJIA, is over. We'll see! | |
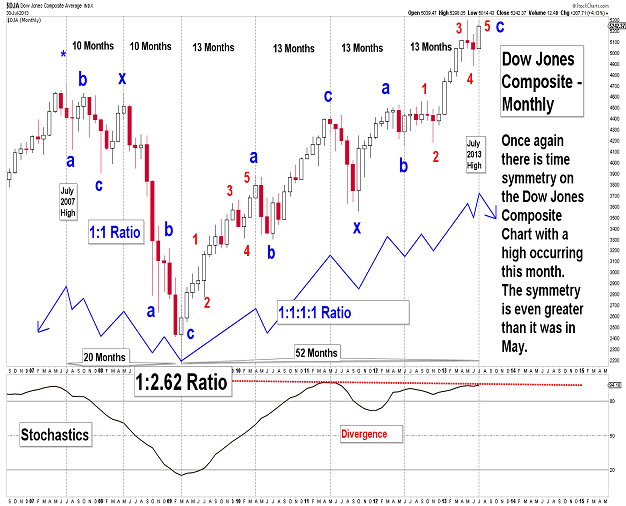
| July 30, 2013 update...Here is an update of the monthly Dow Jones Composite chart, which suggests a cycle top is likely this month. Any type of rally in August that exceeds this month's high would negate the chart's perfect time symmetry and delay the conclusion of the rally from the March 2009 low. | |
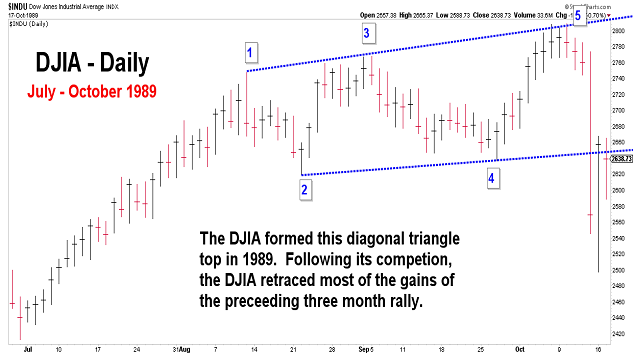
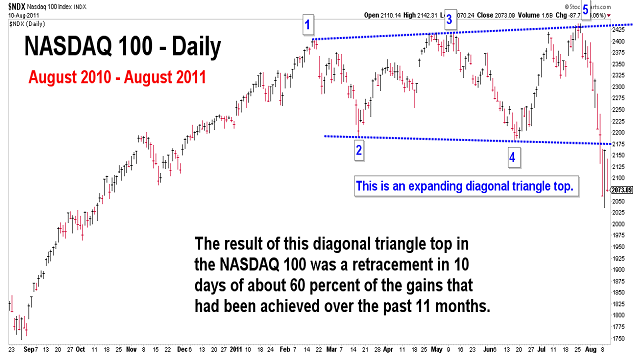
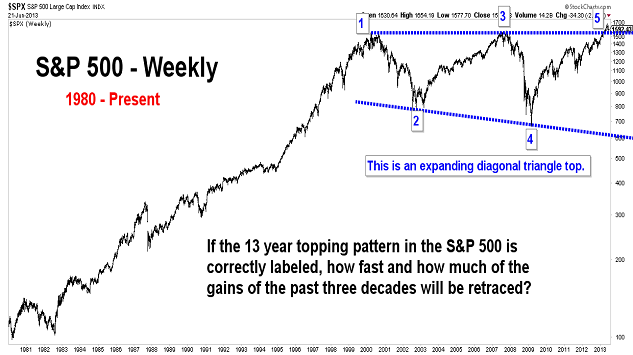
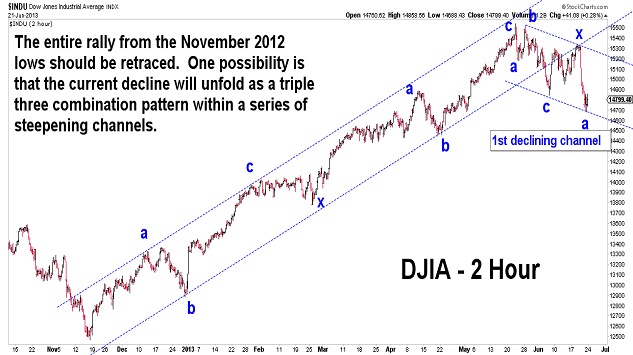
| June 22, 2013 update...Has the market formed the largest diagonal triangle top in its history? The third chart above shows the possible completion of a diagonal triangle topping pattern for the S&P 500. Note the three tops that occurred in 2000, 2007 and this year. To show what happens after a diagonal triangle pattern is complete, see the examples for the DJIA in 1989 and the NDX in 2011. | |
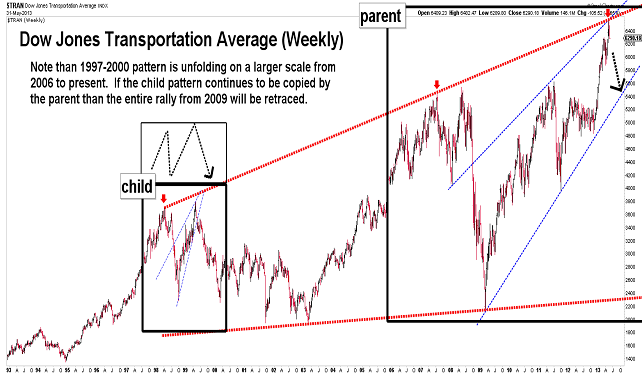
| May 31, 2013 update...Most of the stock indices closed near their lows for the week...with the DJIA and S&P 500 losing more than 1 percent. One of the interesting charts that I noticed this week was the weekly Dow Jones Transportation Average going back to 1997. A visual case can be made than the average is following its 1997-2000 pattern on a larger scale (a child:parent pattern). If the earlier pattern continues to be copied, the entire rally from the 2009 low will be retraced in the coming months/years. | |
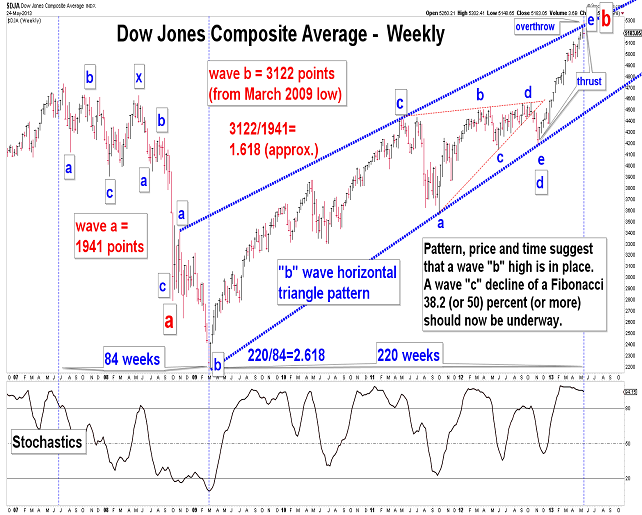
| May 24, 2013 update...Last week's update revisted the "b" wave triangle analysis that was discussed several years ago. Just one week later, that analysis appears to correspond exactly with the confluence of price, pattern and time on the weekly chart of the Dow Jone Composite Average. If the analysis is correct, a top is in place and a wave "c" decline is now getting underway. If wave "c" lasts 73 weeks, then the entire a-b-c pattern from the 2007 high would last a Fibonacci 377 weeks. Interestingly, the decline in the DJIA from its October 2007 high to the March 2009 low was 74 weeks. | |
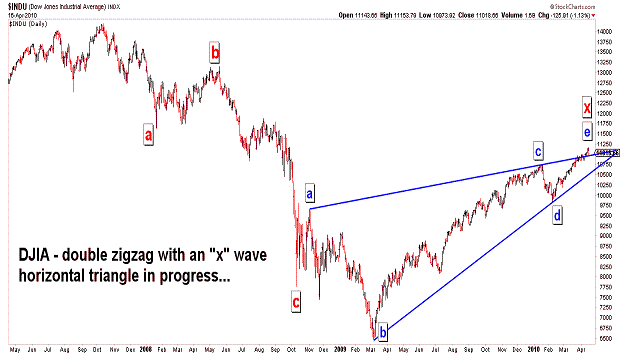
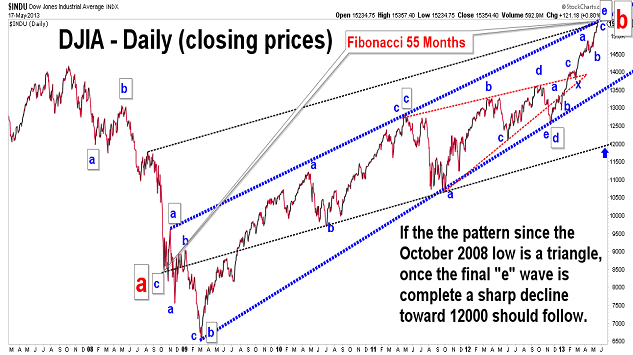
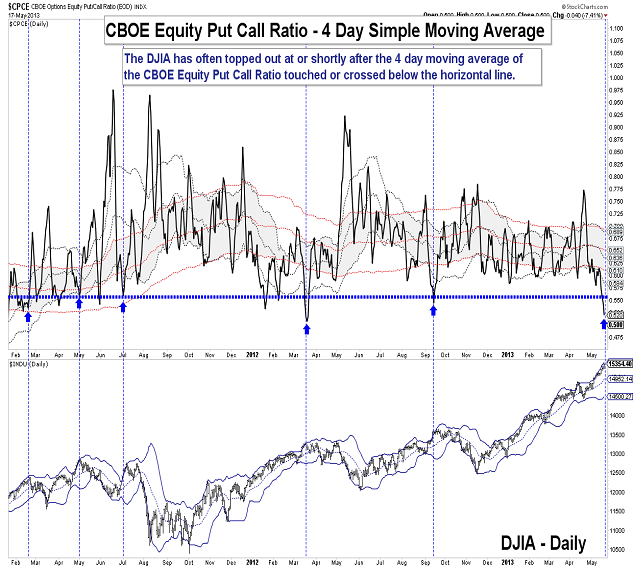
| May 18, 2013 update...As you can see in the first chart above, three years ago I thought the DJIA was tracing out a triangle pattern...which would lead to the next phase of a long term decline. The timing was obiously wrong in hindsight. But, maybe the pattern was not after all! Take a look a the second chart. The DJIA has once again rallied to a resistance line...which forms the upper border of a triangle. If the DJIA has formed a triangle...and the rally from the November 2012 low was the final "e" wave of that triangle...then the next decline will completely retrace this rally and begin wave "c" of the long term bear market that began at the 2007 high. | |
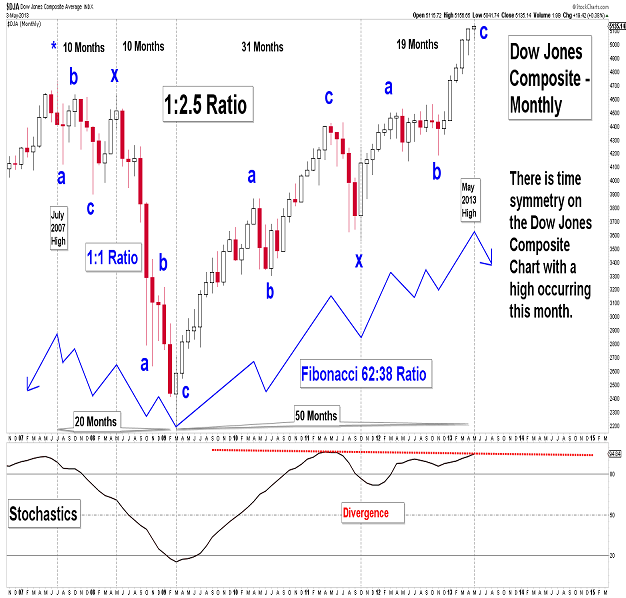
| May 4, 2013 update...As I suggested last week, the DJIA's mirror chart indicated a reversal from this week's action. Since it was a high, we'll see if the market reverses to the downside next week. Interestingly, the Dow Jones Composite monthly chart also suggests a reversal this month. From 1999 through 2012 (a Fibonacci 13 years), the month of May has produced a significant high (either intraday or close) 8 times (a Fibonacci 61.8 percent of the time). We'll see if these odds lead to another high this year. | |
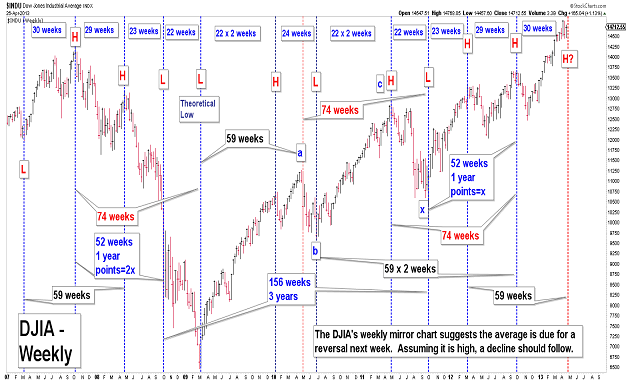
| April 27, 2013 update...Given this week's rather strong snap-back rally, the market has several options in completing its topping pattern. One more down-up pattern would be one way. In any event, the weekly mirror chart strongly suggests that which ever way the market goes next week, it should turn the opposite way thereafter. If, for example, the market makes a high next week above this past week's high, the market should move lower the following week. | |
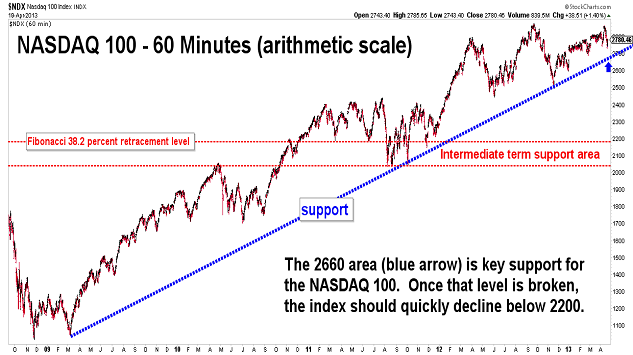
| April 20, 2013 update...This week's 2 to 3 percent decline among the indices should be the kick-off to the intermediate term decline that I have been anticpating. The strong decline IMO is confirmation that the "diagonal triangle" pattern from the October 2011 lows is complete. As suggested by the NASDAQ 100 chart above, the current decline should accelerate once the long term support line from 2009 is broken. | |
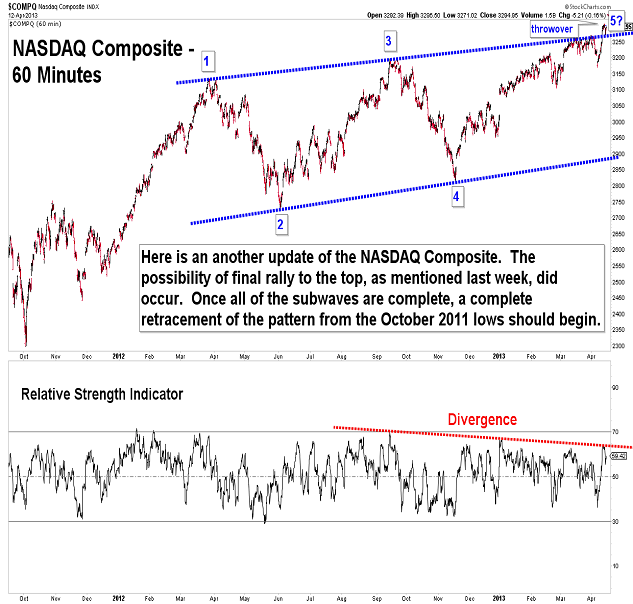
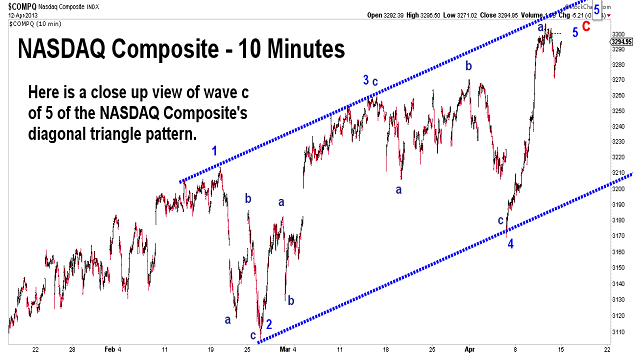
| April 12, 2013 update...Last week I indicated that the market's action left "open the possibility that a final top is not yet in place." This week's sharp rise made that point clear. But, if the larger wave count labels are correct, we are in the very late stages of a diagonal triangle pattern from the October 2011 lows. Once all the subwaves are complete, the entire pattern should be retraced. Timewise, the week of April 22nd would be ideal for a top. | |
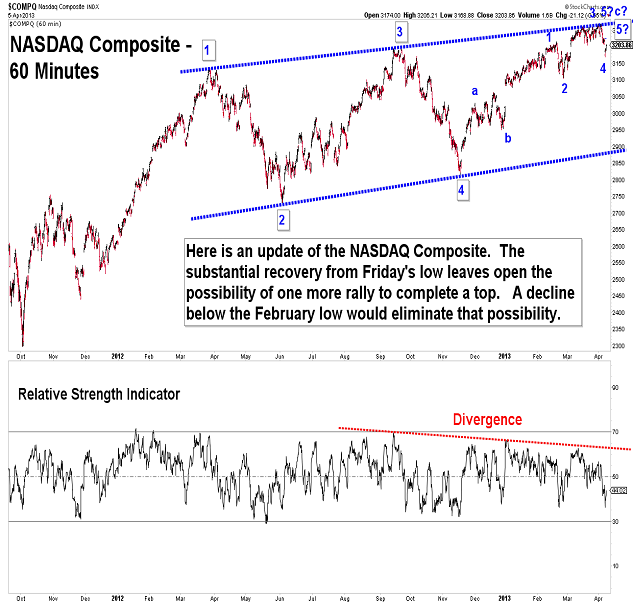
| April 7, 2013 update...Friday's bounce from its opening lows leaves open the possibility that a final top is not yet in place. The three wave decline from this week's high to Friday's low could be a fourth wave...with a fifth wave rally yet to come. A deline below the February lows would eliminate that possibility. We'll see. | |
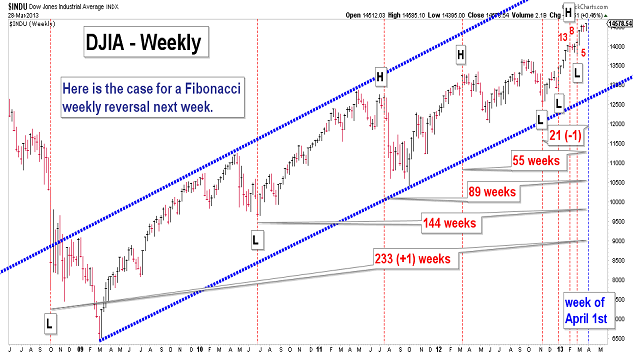
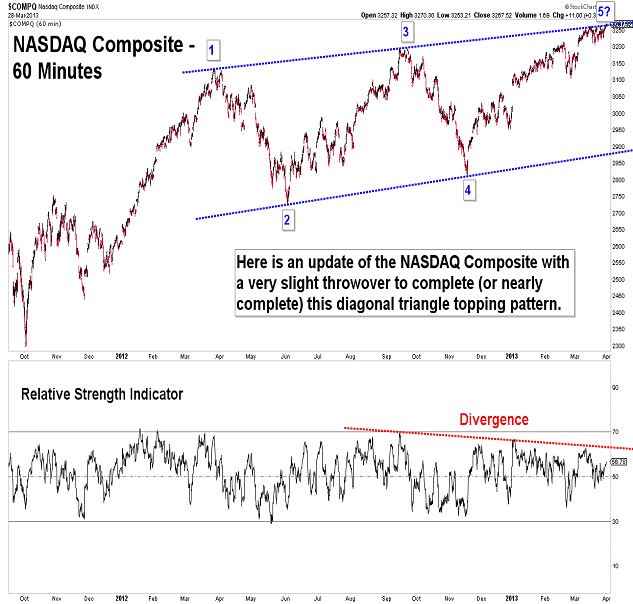
| March 29, 2013 update...A Fibonacci case can be made for a market turning point next week. With several indices appearing to be completing (or nearly completing) small degree diagonal triangle tops (in addition to a larger one from 2011), the long wait for the end of the rally since 2009 and a major decline to begin may finally be over. Happy Easter! | |
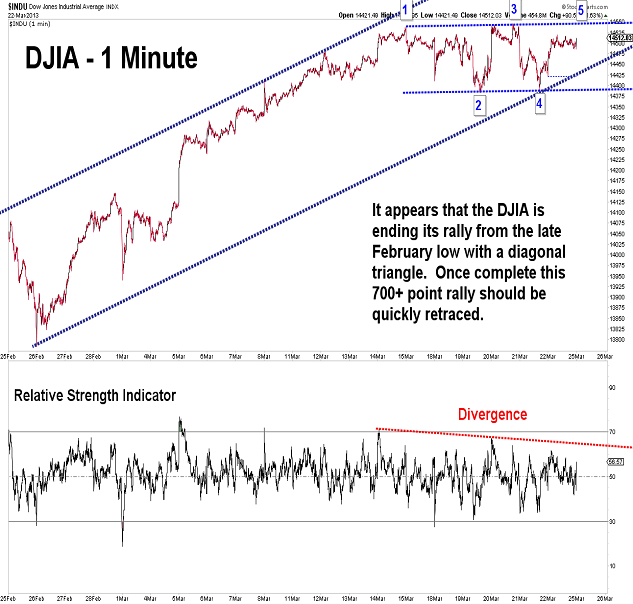
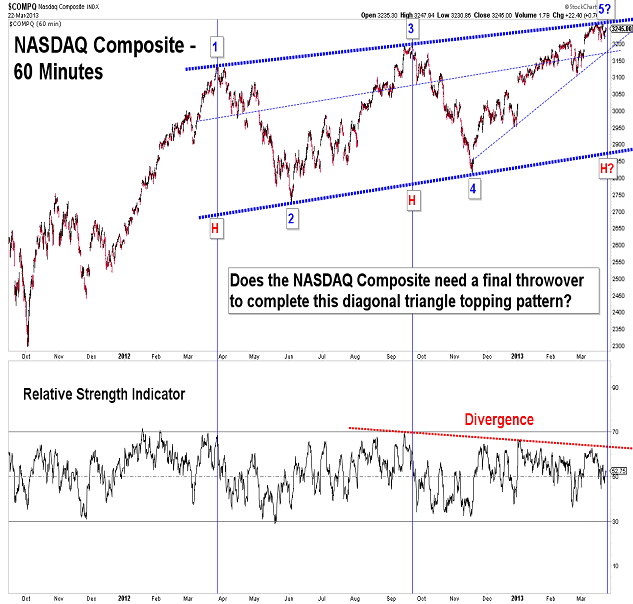
| March 22, 2013 update...If the market is forming a major top, as I think it is, it is sure taking its good time about it. The DJIA lost a measly 2 points for the week; the NASDAQ Composite lost only 4. The Cyprus news could be the trigger next week...but, who knows for sure what will send all of the world markets into a tailspin. A big key reversal day would be a perfect technical signal...but a decline through this week's lows may just be enough. We'll see. | |
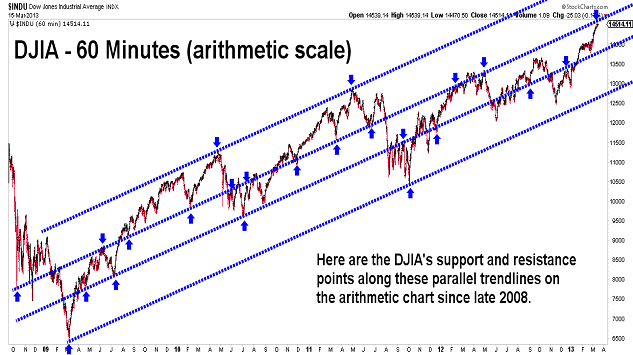
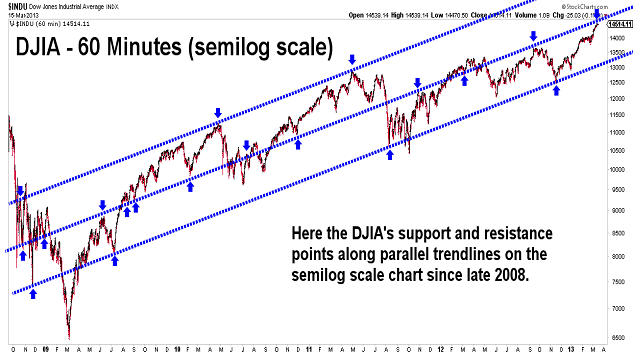
| March 15, 2013 update...The markets ended the week on a mixed note, with the DJIA continuing to gain ground and the NASDAQ 100 stalling. The talk on Wall Street seems to be nothing but bull market ahead, especially with Ben Bernanke at the helm of the Fed. Even the bear Richard Russell has now caved in based on a DJIA Theory Buy Signal. Its getting pretty lonely seeing the market at the end of a four year rally and forming a major top. This week the DJIA is testing both the cycle turning point discussed last week and important "resistance" lines on its arithmetic and semilog scale charts. (Not sure what the pattern is if we continue higher.) | |
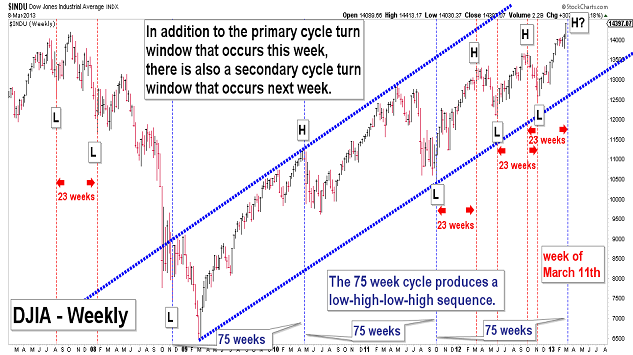
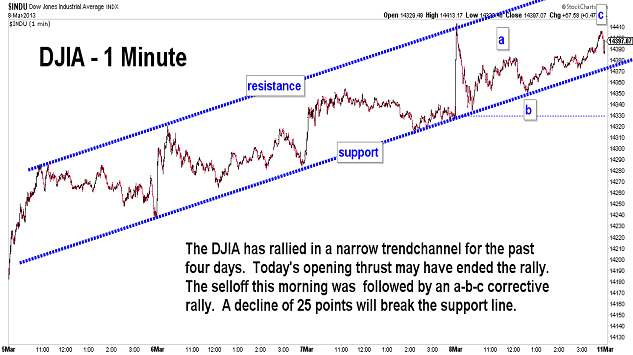
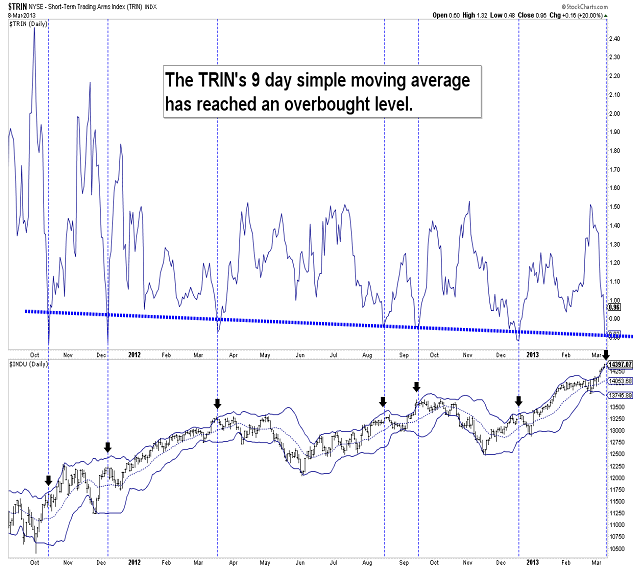
| March 8, 2013 update...For me, this week was ideal for the end of the four year rally in the market. As indicated in last week's chart, there were a number of cycles that converged this week that suggested a reversal was likely. If these cycles are still in effect, the market will turn down immediately next week. However, should the DJIA exceed this week's high, there are two secondary cycles that also call for a reversal. Since 2008, there has been a 75 week cycle that has, so far, produced a low-high-low sequence. A high next week would continue that pattern. We'll see. | |
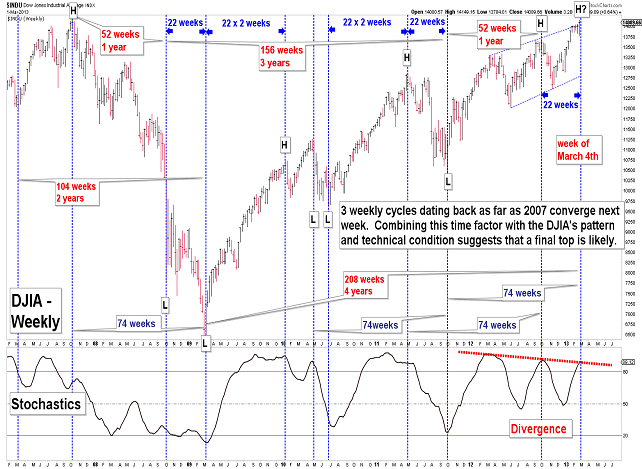
| March 1, 2013 update...Last week I suggested that next week (the week of March 4th) would be ideal for a top. That forecast is about to be put to the test! If next week is a high, I would initially expect an important low to occur 8 weeks later. But, before that happens, I first want to see a confirmation of an intermediate term decline. | |
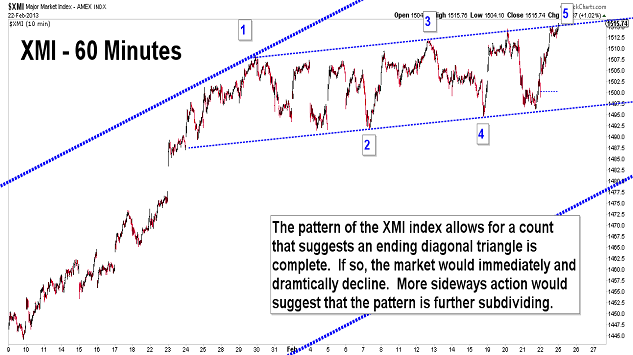
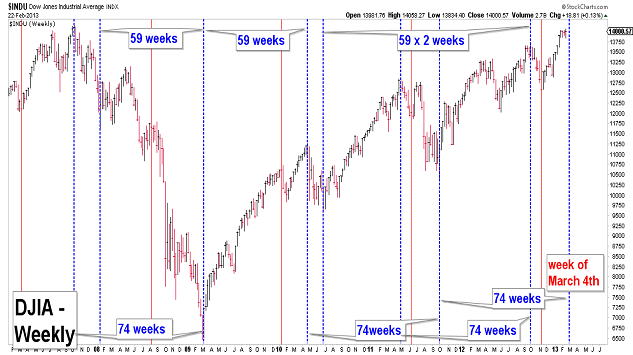
| February 22, 2013 update...Midweek weakness in the market opened the possibility that a top was made and a major decline had begun. Today's rally, however, exceeded the Fibonacci 61.8 percent retracement level of the decline...creating doubt. The time alignment for a top this week was not ideal...given that a 74 week cycle pattern occurs the week of March 4th. So, futher sideways action is still possible a little beyond next week. A decline that exceeds this week's lows and into the hundreds of DJIA points is what I am looking for to confirm that a top is in place. | |
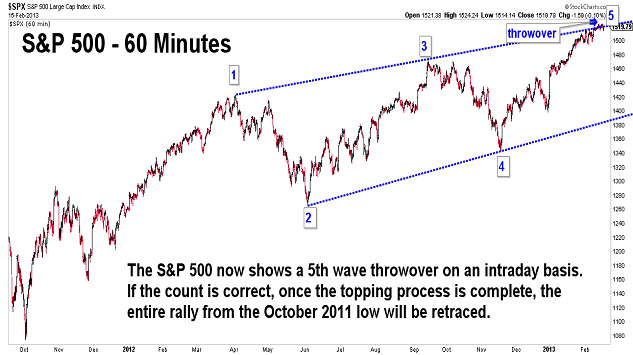
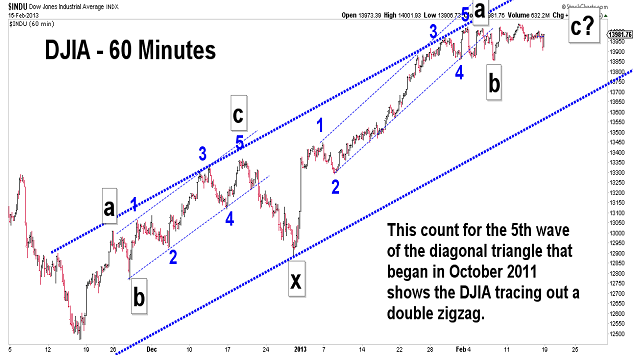
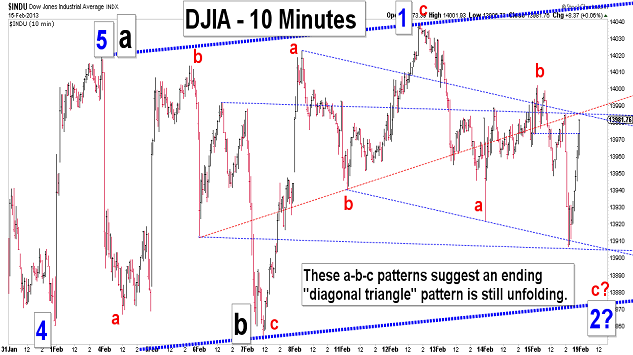
| February 15, 2013 update...The DJIA and NASDAQ lost nominal ground this week as the market continues to chop sideways. The longer term pattern from the October 2011 lows still appears to be a diagonal triangle...which will be retraced when completed. Unfortunately, given the choppiness of the current short term pattern, the timing of the completion date is not clear. One possible short term pattern suggests continued choppy action for a few more weeks...as a smaller diagonal triangle unfolds. On the other hand, a sizeable and powerful decline through the recent lows would suggest the highs are in place and the retracement back to the October 2011 lows is underway. | |

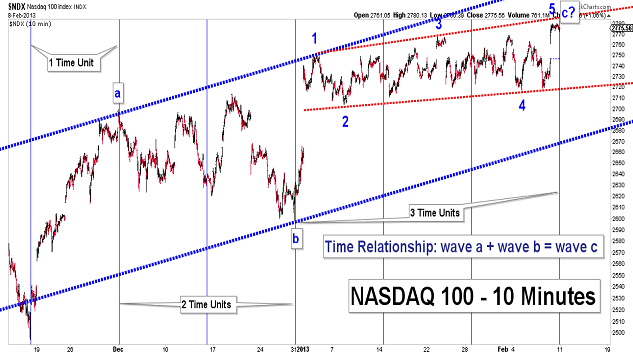
| February 8, 2013 update...Thirty years ago, the question posed in a Wendy's commercial was "where's the beef?" The question now is "where's the top?" As you can see in the chart above, all of the indices appear to be tracing out "diagonal triangle" topping patterns. The only problem is that some appear to be more complete than others, i.e. wave 3 vs. wave 5. If we see another choppy decline next week, it will most likely be "wave 4" action. A powerful decline below the triangle support line will confirm that a top is in place. | |
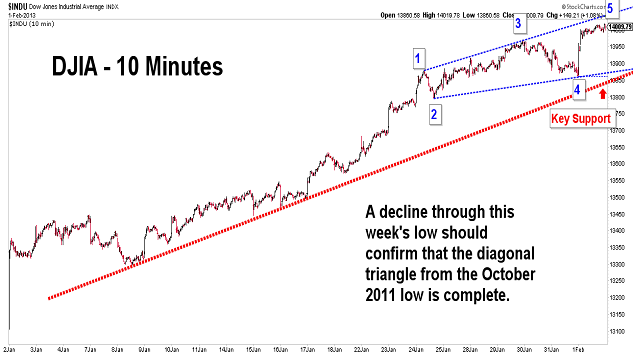
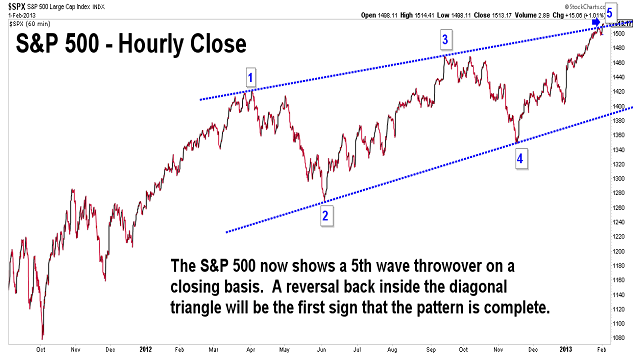
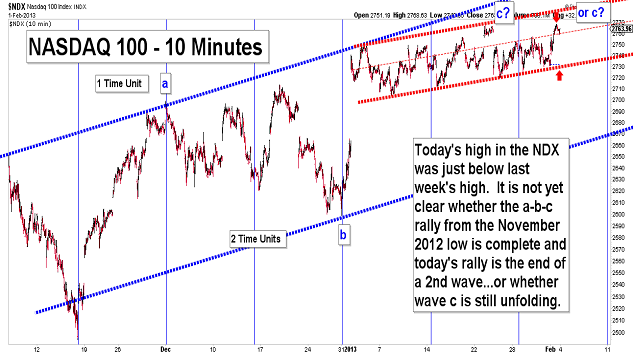
| February 1, 2013 update...The final 5th wave of the diagonal triangle that has unfolded since the October 2011 low continues to subdivide higher. Once complete, the market will reverse course in dramatic fashion. All or substantially all of the price gains since that low will be retraced. | |
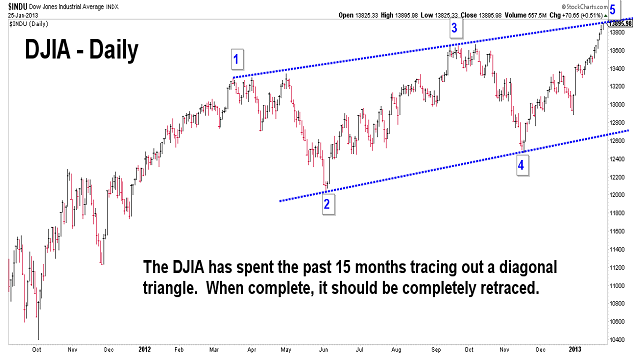
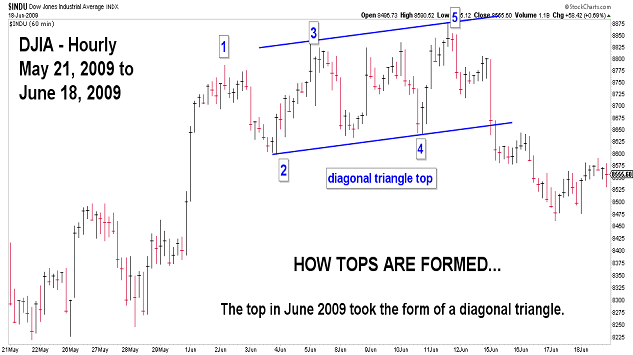
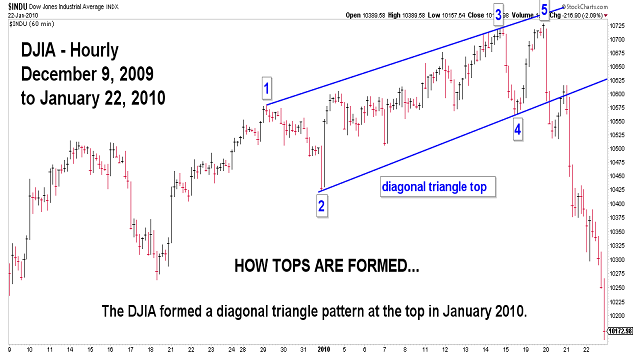
| January 25, 2013 update...In terms of price, pattern and time, the market should be at or near the completion point of its "diagonal triangle" top. Once complete, the entire rally since the October 2011 lows should be retraced. If some other pattern is underway, I don't see it yet. | |
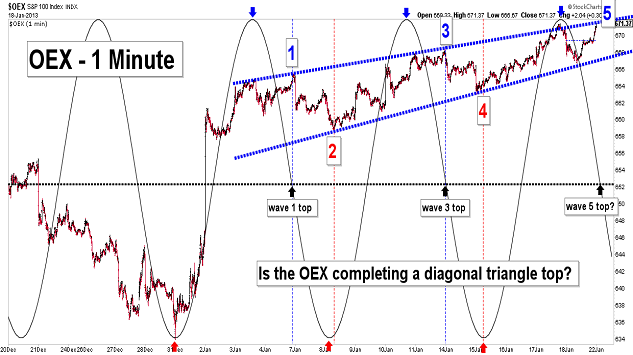
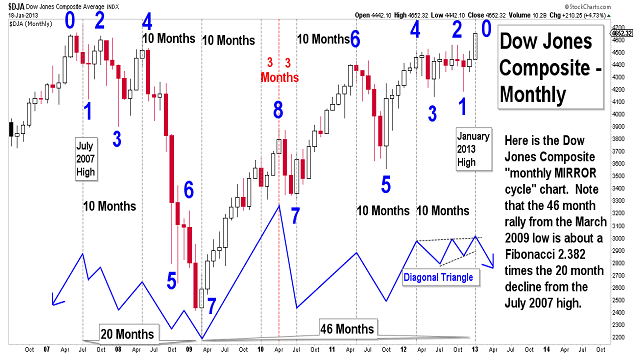
| January 18, 2013 update...On a closing basis, the DJIA exceeded its October 2012 high. In the December 7th update, I speculated that the October high could be exceeded...and suggested that the "longer this market goes without taking out the November lows, the more likely it becomes that the October high will be exceeded next year." At that time, I thought the next best time for a high would be April, but the current time frame would work as well (see Dow Jones Composite monthly MIRROR chart). As I indicated last week, the next decline "must be intense" to confirm that an important high is in place. | |
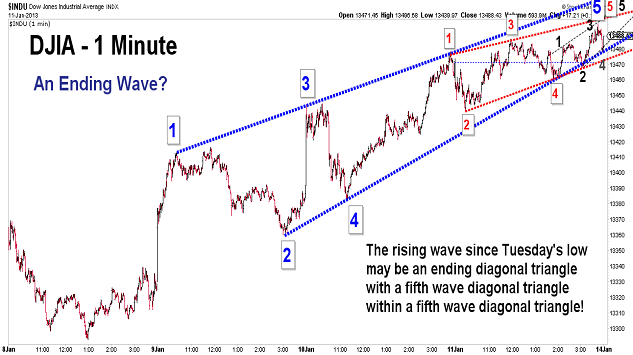
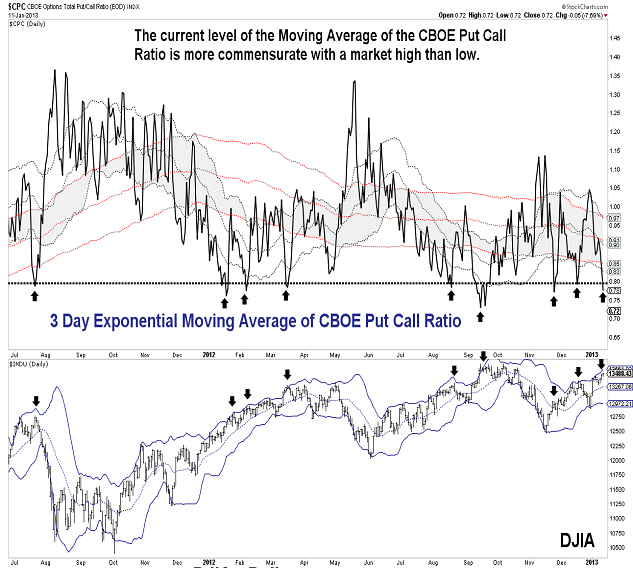
| January 11, 2013 update...The Mirror Cycle signal suggests a turn in the market next week. The rally from Tuesday's low can be viewed as a bearish ending diagonal triangle pattern. If that is correct, the rally from the November low will likely be confirmed as complete once the DJIA declines below 13293. The decline, however, must be intense if an important high is in place. Otherwise, we may see more subdivisions before a final top. | |
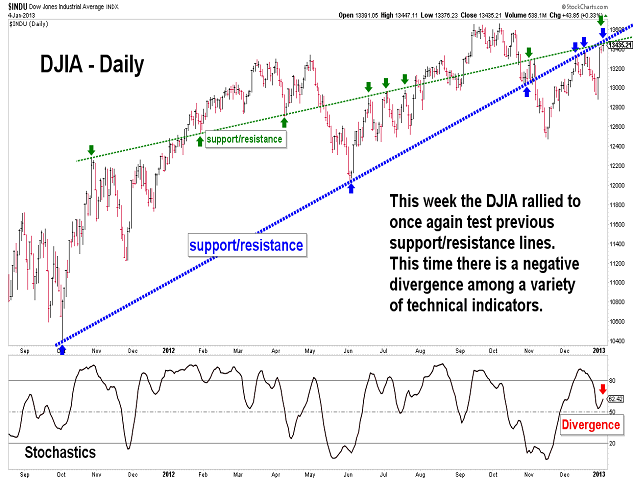
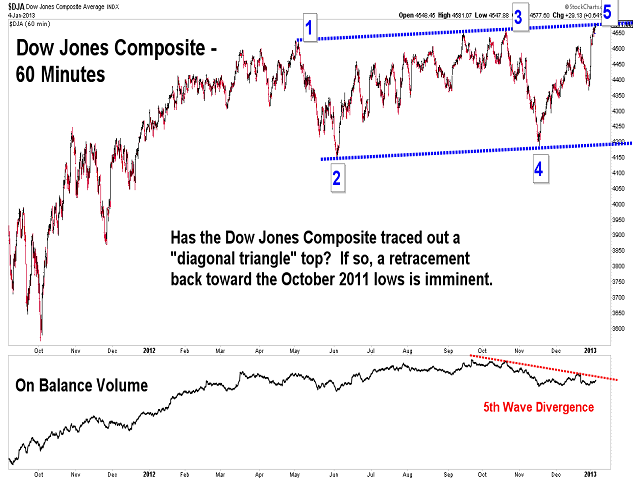
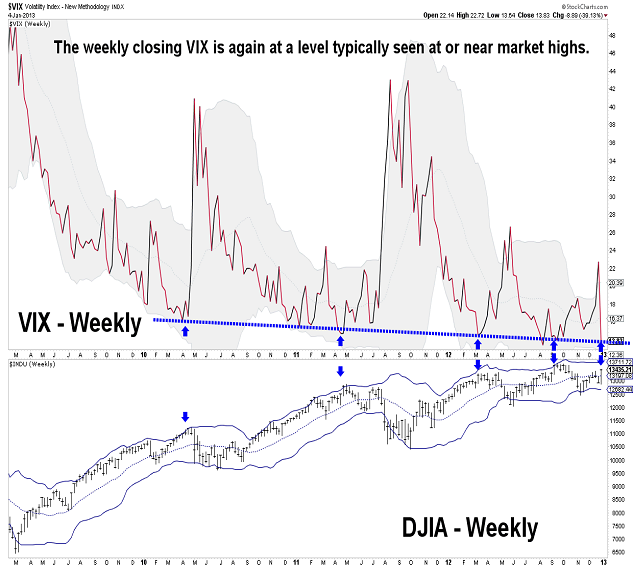
| January 4, 2013 update...Several weeks ago I indicated that Christmas week was a Cycle turn week...and it did, in fact, produce a low. This week the "fiscal cliff averted" rally took the market back to some previous support/resistance lines...and this time there were serious negative divergences among a host of technical indicators. If the rally ends near current levels, a "diagonal triangle" top will remain on the Dow Jones Composite chart, which suggests an imminent decline back toward the October 2011 lows. We'll see! | |
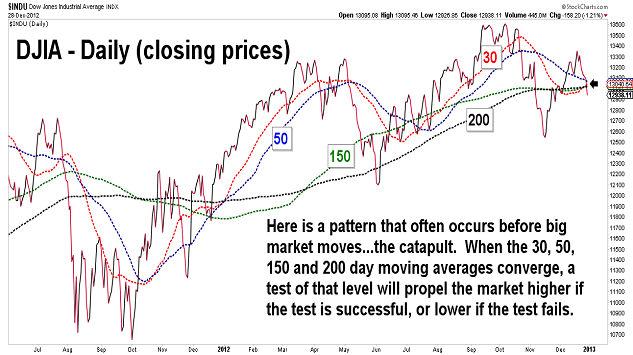
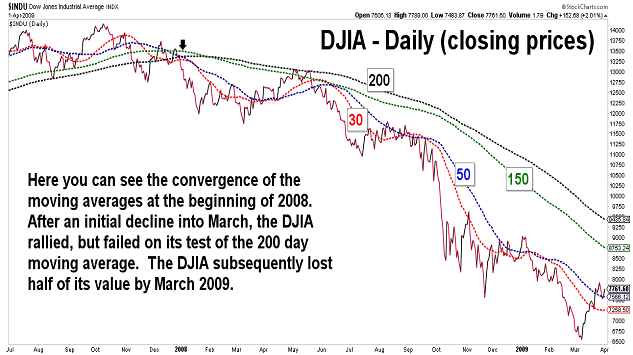
| December 28, 2012 update...Last week's lows were broken and the market declined about 2 percent. The news headlines continued to focus on an imminent "fiscal cliff." Until this week the political and financial talk was clearly optimistic that some type of fix was inevitable. But, as noted here since the October highs, the market pattern since then has suggested that a major DECLINE was inevitable...no matter what the politicians did or the economists forecast. So, in light of the weakening techncial pattern, any "good news" creating rallies will be golden opportunities to sell the market and wait for better opportunites down the road. Happy New Year? I doubt it! | |
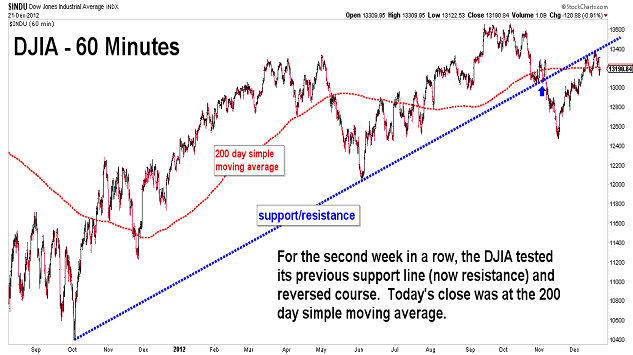
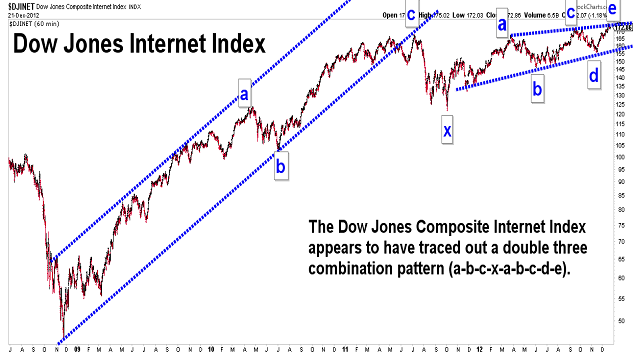
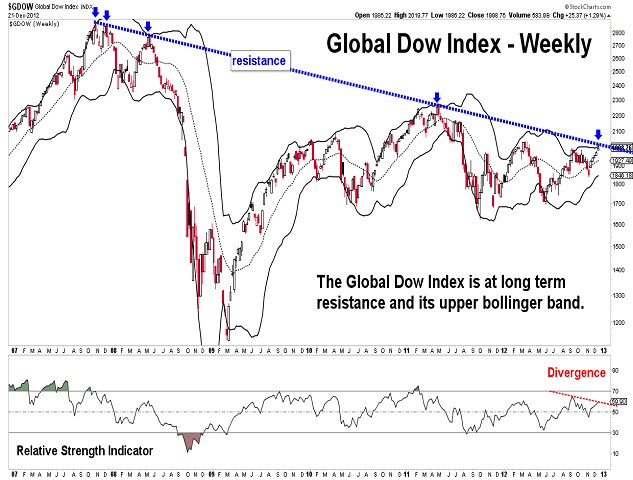
| December 21, 2012 update...The DJIA failed to follow through on last week's key reversal...and instead rallied early in the week to retest its previous support line. The market reversed to the downside at the end of the week, but the DJIA still managed to close up 55 points for the week. The markets typically trade in a narrow range between Christmas and New Year's, so unless today's lows are broken, next week is likely to be uneventful. Wishing everyone the best holiday season! |
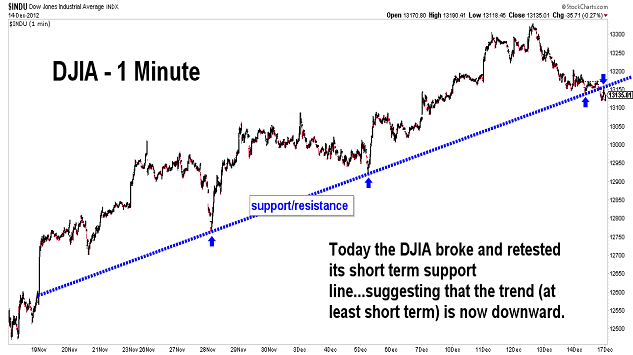
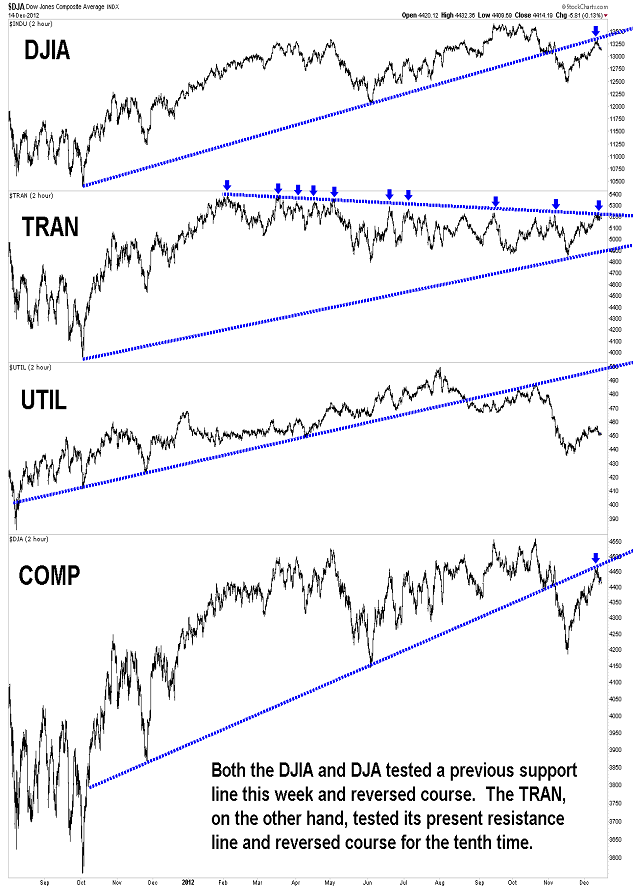
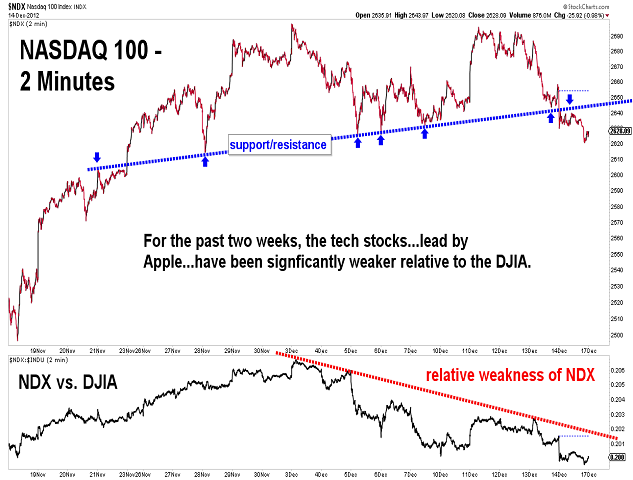
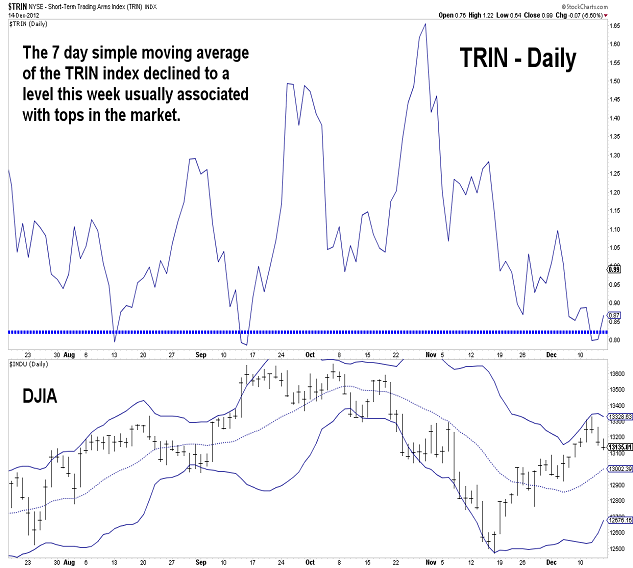
| December 14, 2012 update...The market reversed course during the latter part of the week...with the the DJIA tracing out a weekly key reversal pattern. The DJIA and other indices tested previous support lines, which should now act as resistance. Short term, the market this week reached its upper Bollinger band and was relatively overbought. The next cycle turn week is the week of Christmas...so, we'll see if the current decline continues at least until then. |
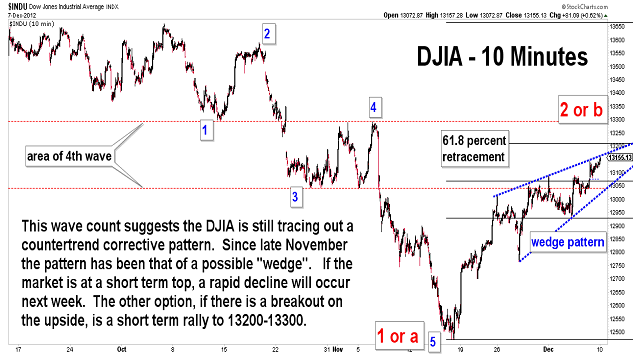
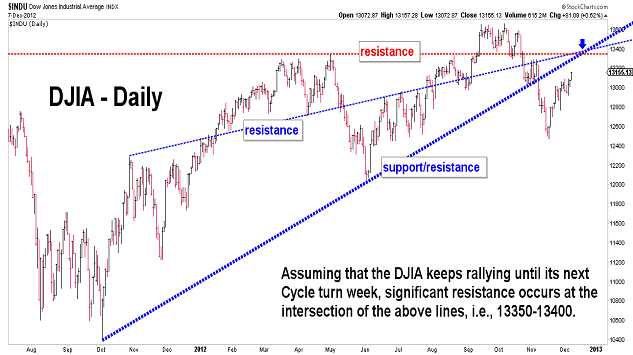
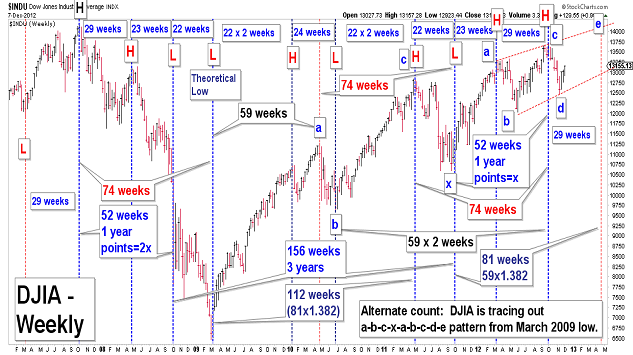
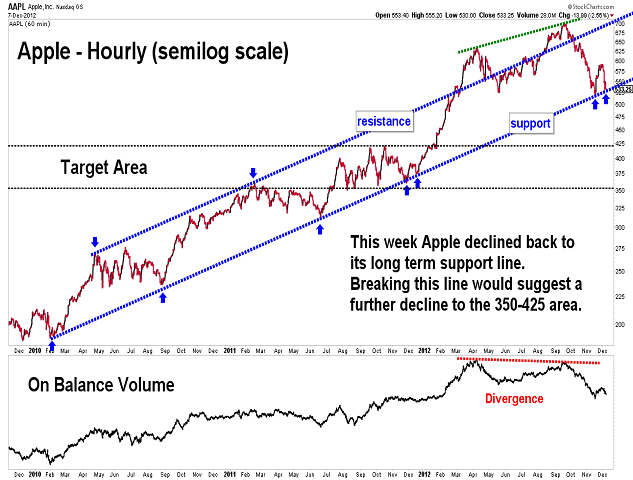
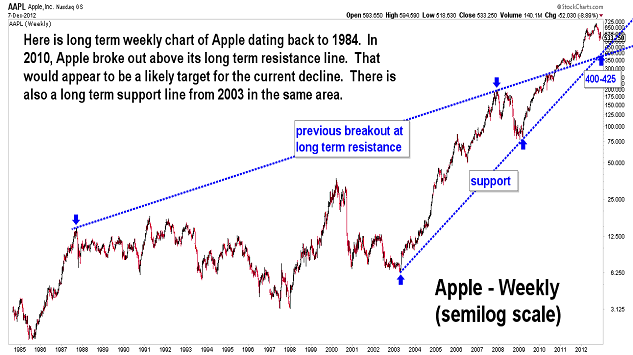
| December 7, 2012 update...It was a mixed week for the market...the DJIA gained about 1 percent; the NASDAQ lost about 1 percent. So, last week's mirror cycle signal turned out to be only half correct. Christmas week is the next projected cycle turn week. Given the market's current lack of volatility (except for Apple...see charts above), I began to think about the possibility that a final top is not yet in place (at least for the DJIA). Looking at the DJIA's pattern in conjuction with the mirror cycle chart...if in fact a final top is not yet in place...the next best time for such a top is in April. See the alternate count on the updated mirror cycle chart. The longer this market goes without taking out the November lows, the more likely it becomes that the October high will be exceeded next year. |
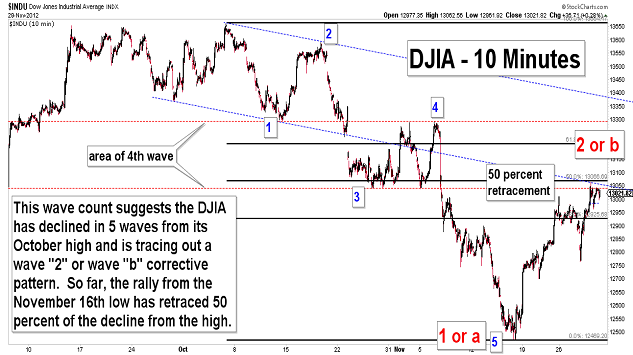
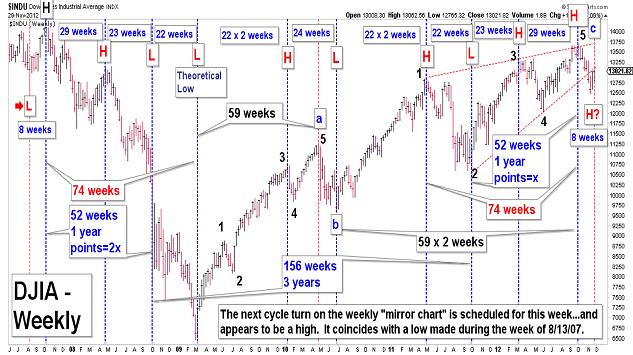
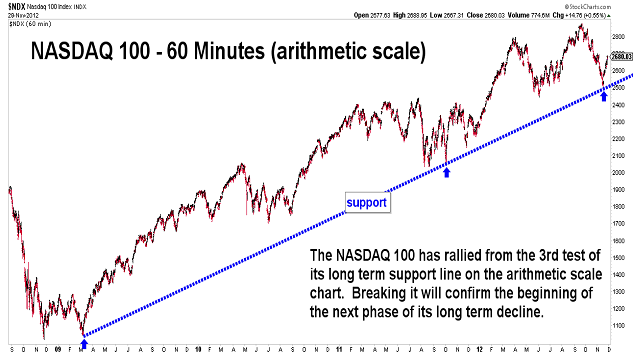
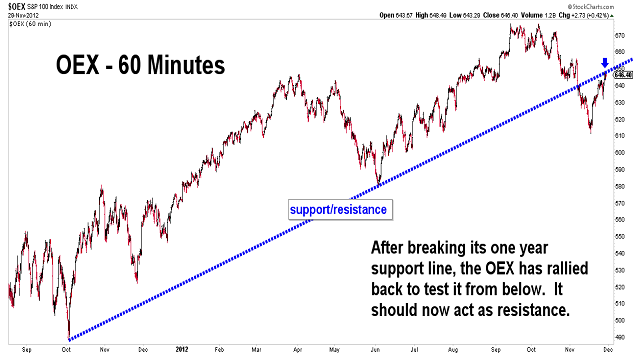
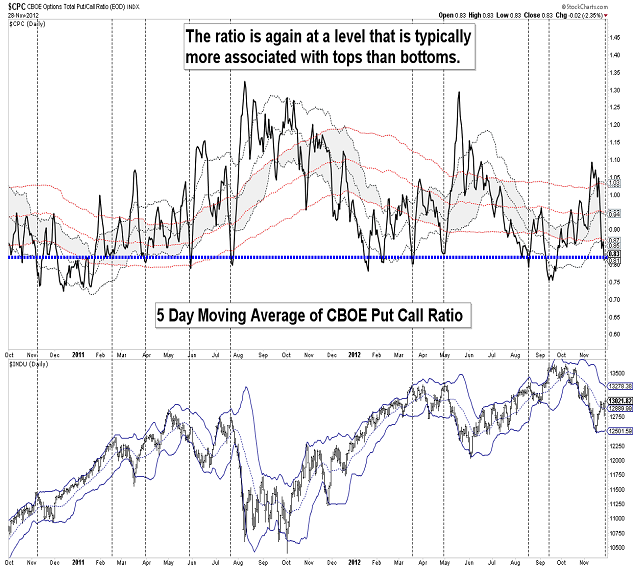
| Nomember 29, 2012 update...As pointed out two weeks ago, the mirror cycle chart suggested that this week would be a turning point for the market. Since the market has moved higher this week, a rally tomorrow would be an opportunity to go short (assuming the mirror pattern is still working). In support of the bearish view, there are some indicators that have moved to an overbought condition on a short term basis. It is still not clear, however, whether a decline in the coming days would be part of an ongoing wave "2" or wave "b" corrective pattern or the start of the next intermediate wave lower (i.e., wave "3" or wave "c"). That will depend on the next decline's pattern and strength. In the meantime, market volatility will likely be influenced by the debate and resolution (or lack thereof) of the so-called "fiscal cliff." We'll see. |
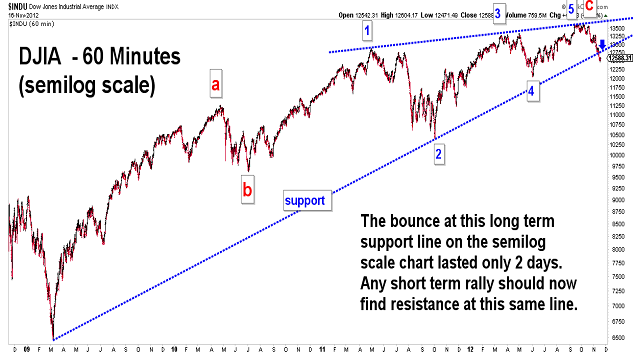
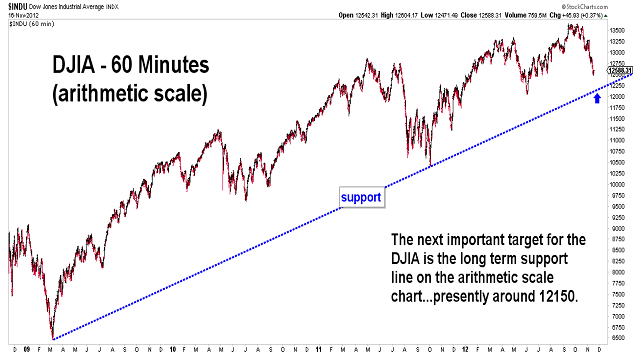
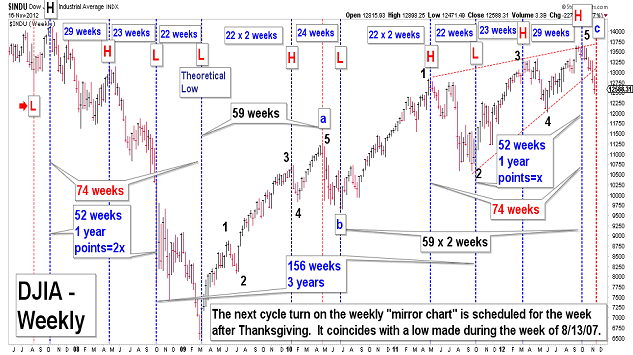
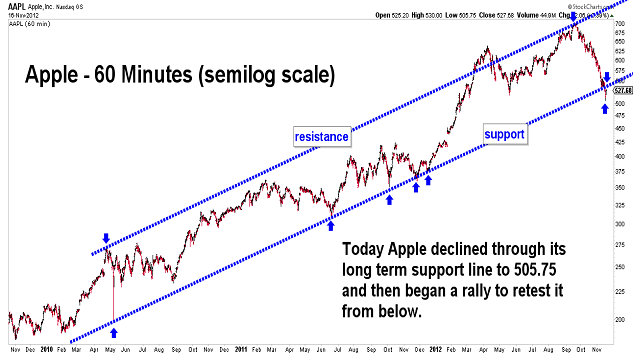
| Nomember 16, 2012 update...After a very brief rally attempt early in the week, the DJIA reversed course and declined through its long term support line on the semilog scale chart. Any short term rally should now find resistance at that line. The next target is the long term support line on the arithmetic scale chart...currently around 12,150. One possibility is that this support level will be tested the week after Thanksgiving, when the next cycle turning point occurs on the "mirror chart". |
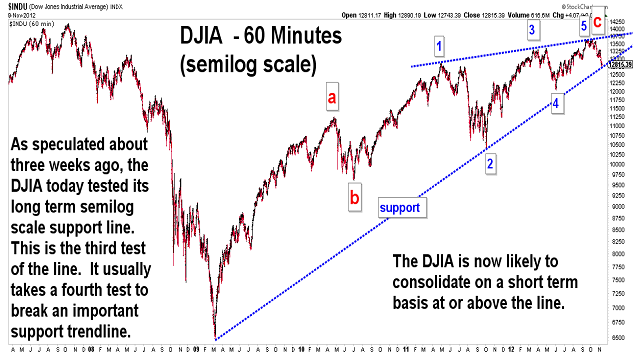
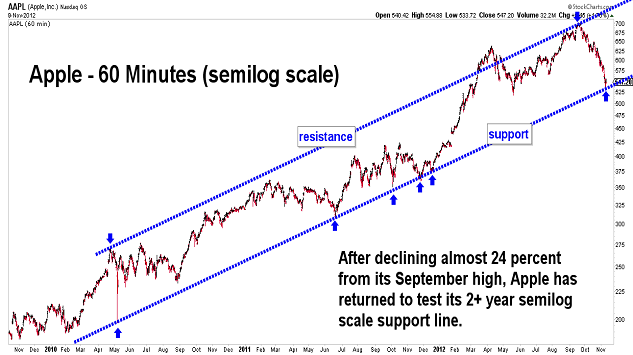
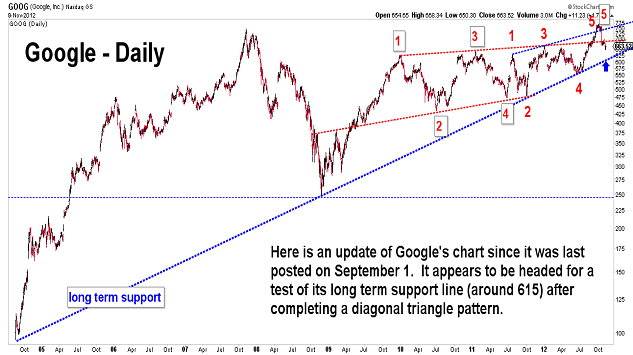
| Nomember 9, 2012 update...Almost three weeks ago, I suggested the DJIA would test its long term support line on the semilog scale chart. It did so today. Short term, there is good chance the DJIA will consolidate here before resuming its long term decline. Note that Apple today also tested a long term support line on its semilog scale chart...and may also experience a period of consolidation or retracement. |
Important: Information and chart access provided herein is limited to current subscribers only and shall not be forwarded or retransmitted without written authorization. It is educational in nature and shall not, directly or indirectly, be construed as investment advice. No guarantees are made with respect to the accuracy of the information, opinions, predictions,etc. offered here in. The username/password provided to a subscriber is unique and it is the sole responsibility of the subscriber to protect the confidentiality of said username/password and to further protect it from any unauthorized use.
Copyright © 1997 - 2024. The Elliott Wave Chart Blog. All rights reserved. Email
|
![]() What is The Elliott Wave Chart Blog About? / Elliott Wave Quotes, Research & Charts / Historical Elliott Wave Charts
What is The Elliott Wave Chart Blog About? / Elliott Wave Quotes, Research & Charts / Historical Elliott Wave Charts